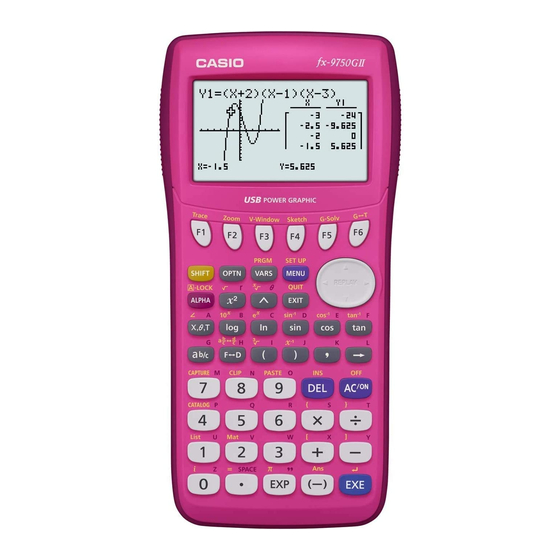
Casio fx9750GII Getting Started
Graphic calculator
Hide thumbs
Also See for fx9750GII:
- User manual (412 pages) ,
- Quick reference manual (16 pages) ,
- Quick start manual (16 pages)
Advertisement
Advertisement

Related Manuals for Casio fx9750GII


Summary of Contents for Casio fx9750GII
- Page 1 GETTING STARTED WITH THE CASIO GRAPHIC CALCULATOR fx9750GII...
-
Page 3: Table Of Contents
Chapter 7 the FX9750GII Normal, Binomial and Chapter 8 Poisson Distributions Connecting the FX9750GII to Chapter 9 other devices Chapter 10 Key Index Getting Started with the Casio Graphic Calculator. Produced by Derek Smith and Monaco Corporation Ltd. Copyright © 2012... - Page 5 INTRODUCTION Congratulations on your recent purchase of the CASIO FX9750GII. ® The 14 Main Menu Icons Select any mode from the MAIN MENU by using the arrow keys to highlight the MODE icon that you want or press any of the digits 1 ~ 9 or letters A ~ E.
- Page 6 Time, Value of Money and other financial and economic calculations. LINK Allows the calculator to link to a PC or another CASIO calculators to transfer programs and data, via the USB or 3-pin. Connection can also be made to a data projector and settings.
- Page 7 GETTING STARTED Switching on and off In order to start your Casio FX9750GII, after you have placed the four AAA batteries into the battery compartment, do the following: RESULT Screen This is called the MAIN MENU and can be accessed by: What are the ‘Icon’...
- Page 8 GETTING STARTED Mode, Fraction result, Function Type, Draw Type, Derivative, Angle, Complex mode, Co-ordinate, Grid, Axis, Label, Display and Simplify are self-explanatory settings. Returning to previous ‘Menus’ on the screens Example Display NORM 1 NORM 2 This mode determines the form in which answers obtained from calculations will be displayed.
- Page 9 Clear Screen Clearing the Graphical Screen so that you don’t superimpose graphs can be done either by: Enter V-Window and alter the viewing screen domain and range values as desired. Enter Sketch. then Basic activities in RUN-MAT icon BEDMAS to reinforce the importance of the order of mathematical operations.
- Page 10 GETTING STARTED Basic activities in RUN-MAT icon cont. Fractions, decimals and percentages Fractions can be entered into calculations with the fraction key. Example To add 3 and 2 together Result then then then then then To convert to a mixed fraction Example Convert result of 3 and 2...
- Page 11 Fractions and decimals can be calculated together. Example Multiply by 2.8 Result then Decimal Fraction Percentage key Example graphics calculator Calculate 48% of $16.40 Result does not have a specific ‘Percentage’ key. Just remember that 48% is the ÷...
- Page 12 GETTING STARTED Basic activities in RUN-MAT icon cont. Powers and roots cont. Example Evaluate √625 Result SHIFT then Algebraic Substitution Enter the calculation by replacing each letter in the formula with its corresponding number. Example Calculate V = (A – 4)(B + 4) where A = 30.34 and B = 47.5 Result then When you have a number of algebraic substitutions to do then it would be easier to use the memory aspect of the...
- Page 13 Notes: CHAPTER 1 | PG 13...
- Page 14 GRAPH DRAWING Drawing graphs is easy using the FX9750GII! They can be drawn in the RUN-MAT or GRAPH icons. RUN-MAT icon The functions (and more) listed below (and there are many more) have been ‘installed’ into the calculator for quick graphing. Each has its own unique pre-set domain and range values.
- Page 15 Clearing the screen [Cls] After each graph has been drawn then [SHIFT] [F4] [F1] key followed by [EXE] is necessary to clear the previously drawn graph, otherwise the graphs will be superimposed. Note: Numerous graphs can be superimposed, allowing linear programming.
- Page 16 GRAPH DRAWING Zooming in and out The ‘zooming’ is easily initiated when parts of a graph need to be seen in more detail - ‘roots’ to the equation, maximum or minimum points or other aspects under investigation. RESULT By choosing BOX [F1] you can decide what ‘new’ domain and range values will be used for the V-Window.
- Page 17 GRAPH icon From the MAIN MENU enter into the GRAPH icon by either moving the cursor to highlight the icon or pressing the [3] key. This part of the calculator has a lot of functionality. Stores graphs, up to 20 functions that you use regularly or ‘families’...
- Page 18 GRAPH DRAWING Find the... Root/s Minimum SHIFT SHIFT Maximum Y-intercept SHIFT SHIFT Y-value calculations X-value calculations SHIFT SHIFT Other G-Solve features are shown in other chapters in this book where appropriate. Basic activities in the GRAPH icon This activity shows how the calculator can be used: to draw multiple lines; to see the relationship to the change in the constant ‘c’...
- Page 19 A parabola - multiple representations for y = ax Note: Make sure that the V-Window is appropriate to see the graphs that you will be drawing. Enter [SHIFT] [F3] then change the settings to the conditions shown here. Go back to the Graph Function menu with [EXE] or [EXIT] .
- Page 20 GRAPH DRAWING Basic activities in the GRAPH icon cont. Piecewise Functions Note: Piecewise functions are pieces of different functions, restricted in the domain (x-values) for which they are to be drawn. Use [ , ] to restrict the domain values. Example Draw the graphs of y = x², -2 ≤...
- Page 21 Auto Zoom cont. The most important viewing windows are: Note: INITial Setting The more graphs that you experience drawing on the FX9750GII the more familiar you will get with understanding the relationship between the graphs and their equations that represented STanDard algebraically.
- Page 22 GRAPH DRAWING Basic activities in the GRAPH icon cont. Graphing and calculating unknown x-values to view multiple solutions Graphing and intercepts Finding the x–intercepts (roots to the equation when y = 0) and the y–intercepts (x = 0). Make sure that the V-Window is set up to see the graph efficiently.
- Page 23 Example cont. for ISCT (intersection points) to find all others Solving trigonometric equations It is necessary to check that the domain (x-coordinates) and range (y-coordinates) are set up for graphing trigonometric graphs, through the V-Window ( [SHIFT] [F3]). By pressing the [F2] key this sets the calculator up for TRIGonometric graphs.
- Page 24 GRAPH DRAWING Basic activities in the GRAPH icon cont. Solving ‘X=…’ equations. Example Draw x = 2y + 1 Result ALPHA — then then to draw the graph Example 2 Draw x = y Result ALPHA — then then to draw the graph Other settings under TYPE [F3]: Rectangular Inequalities...
- Page 25 OPTION, VARIATIONS AND CATALOGUE KEYS OPTN, VARS and CATALOG These mathematical tools can be selected in most of the MAIN MENU icons, namely, RUN-MAT, Statistics, Graph, Dynamic Graph, Tables and Program. The OPTION key will bring these tools up on the screen for use.
- Page 26 OPTION, VARIATIONS AND CATALOGUE KEYS OPTN, VARS and CATALOG cont. What is in Statistics? RESULT What is in Conversion? RESULT What is in Hyperbolic? RESULT What is in Probability? RESULT RESULT...
- Page 27 What is in Number? RESULT What is in Angle? RESULT What is in E Symmetry? RESULT RESULT What is in Picture? RESULT CHAPTER 3 | PG 27...
- Page 28 OPTION, VARIATIONS AND CATALOGUE KEYS OPTN, VARS and CATALOG cont. What is in Function Memory? RESULT What is in Logic? RESULT What is in Capture? RESULT What is in Time, Value and Money? RESULT RESULT...
- Page 29 The VARIATIONS key will provide commands, settings, values and solutions to equations namely: V-Window, Factor, Statistics, Graph, Dynamic graph, Table, Recursion, Equation, Financial (TVM) and String. CHAPTER 3 | PG 29...
- Page 30 OPTION, VARIATIONS AND CATALOGUE KEYS CATALOGue Key CATALOGue provides list mathematical symbols, commands to enter. These can be accessed through most of the MAIN MENU icons using the OPTN or VARS keys. They can also be accessed via [SHIFT] [4] where you will need to scroll a list and select the required command required. The catalogue can be viewed through 13 different catalogues that are linked to the MAIN MENU icons for easier access to the commands required.
- Page 31 Catalogue Screen Next Screen Catalogue Screen Next Screen Table Equation Financial String (TVM) Conversion The mathematical and statistical commands available in CATALOGue can be accessed via the OPTN or VARS keys also. Notes: CHAPTER 3 | PG 31...
-
Page 32: Chapter 4 Statistics
STATISTICS The statistics icon incorporates the two types: • Univariate (1 variable) RESULT • Multivariate (2 variables). There are 24 ‘list’ spaces that you can enter data into. Lists 1 to 24 can be used in any order. The lists can be used as frequency values also. - Page 33 Uni-variate cont. Example cont. Result Note: Wrongly entered scores can be edited by moving to the appropriate cell with the and typing over the score and pressing Sorting data entries: Ascending (lowest to highest) (SRT-A) Descending (highest to lowest) (SRT-D)
- Page 34 STATISTICS Uni-variate cont. Example 2 Enter the following data into list 1 and list 2 spaces to calculate summary Result statistics from given data. Set up the lists so the List 1 is the x-values, List 2 is the frequency values. Score x - List 1 Frequency f - List 2 then...
- Page 35 Bi-variate cont. Example cont. Result You can now set up the calculator to draw the graph in regression format EXIT to return to the main screen [GRPH] [SET] [GPH1] [Graph Type] [SCAT] EXIT then Graph has been drawn Select the mathematical models to fit the data points...
- Page 36 STATISTICS Bi-variate cont. Example 2 cont. EXIT Summary statistics Scroll through the complete set of calculated statistics Editing Lists As mentioned earlier, lists can also be used for storing many types of lists. For example, recursive sequences and partial series, table values, statistical trends etc.
- Page 37 Deleting Lists Deleting list entries use either [F6] then [F3] for one entry at a time or use the [DEL] key when in the cell to be deleted. To delete the entire column use [F6] [F4] then [F1]. Note: You cannot delete rows, only columns or individual cell entries.
- Page 38 PROGRAMMING PROGRAMMING icon The programming icon is an area where programmes can be written, edited, retrieved and deleted. Access to the programming tools are through the PRGM key. When you have no programmes, the first few screens will look like the images to the left.
- Page 39 Example ‘Rain on the Roof’ is a simulation of raindrops that have fallen on a roof (that has been divided into 16 square) in a ‘snapshot’ in time. This is a Poisson Distribution activity that lets the ‘user’ decide how many raindrops are to fall.
- Page 40 PROGRAMMING Example 3 ‘Factors of Numbers’, is a “FACTOR OF NUMBERS” program that finds all factors of “PERFECT NUMBER CHECK” Lbl 0 any input number, checks whether ?→A it is prime, and / or a perfect “” 0→Z number and counts the number N=2⇒Goto 3...
- Page 41 Example 5 ‘Fractal-Fern’ is a program that “FRACTAL-FERN” Goto 0 draws a fern. Editing the program ViewWindow 1,14,0,1,11,0 Lbl 2 can create a fern tessellation by 0→C .85A+.04B→C using a series of extra loops, and 0→H -.04A+.85B+1.6→B dummy variables to create the 4.3→E...
- Page 42 PROGRAMMING PROGRAM MODE COMMAND LIST...
- Page 43 Notes: CHAPTER 5 | PG 43...
-
Page 44: Other Icons
OTHER ICONS Graph Graph [3] Stores graphs, up to 20 functions, that you use regularly or ‘families’ of graphs where relationships and special features can be viewed. All of the Function key menus, such as Trace, Zoom, V-Window, Sketch, Graphical Solutions and Graph - Text are available. It is also where you can view Graph - Graphs and Graph - Table split screens. - Page 45 Graph [3] re-visited The ‘Graph’ mode can also have Graph - Graph or Graph - Table. You can Change dual screen Change dual screen ‘toggle’ between the table and to ‘G to T’ to ‘G & G’ the graph.
- Page 46 OTHER ICONS Dyna cont. Store the expression to override “B” to override “C” then Change the variable [VAR] Set the dynamic range EXIT [SET] then to draw graph Prior to you seeing the dynamic graph a message will come on the screen (left). This is where the calculator generates the differing views in relation to the coefficient starting, finishing and pitch values that has been chosen for the displaying of the ‘family of graphs’.
- Page 47 Equations cont. Simultaneous Equations 2 Equations–2 Unknowns TO 6 Equations–6 Unknowns The calculator can solve simultaneous linear equations up to 6 unknowns, any other linear equation systems > 6 unknowns should be solved in the RUN-MAT icon from the MAIN MENU using matrices.
- Page 48 OTHER ICONS Solving Polynomial Equations cont. Example 2 Solve + 4x − 5 = 0 Result Enter the coefficients of the equation then to solve the equations Note: In solving the polynomial equations the solutions can be displayed in polar and rectangular format if the solutions are complex. Use SETUP and then scroll down to change the settings, as required by pressing the appropriate Function key(s).
- Page 49 Solving Other Types of Equations cont. Example Solve 2x + 1 = 5 Result Enter the equation X, θ ,T SHIFT then to store to solve Note: You are able to use any letter of the alphabet as the ‘dummy’ variable in the equation, using the ALPHA keys and corresponding key.
- Page 50 OTHER ICONS Solving Other Types of Equations cont. Example 2 cont. Change the known variables to those defined in the problem Move the ‘cursor’ so that it is ‘sitting’ over the top of the variable that you want to calculate the answer to, in this case ‘M’. then [SOLV] Example 3...
- Page 51 Conics cont. Example Find the directrix, symmetry line, length, vertex and the focal points for the Result parabola x = 2(y – 3)² + 1 Enter in the appropriate coefficients Make sure that the domain and range are set up adequately, via the V-Window.
- Page 52 Language Version Select the language to be used on the calculator. Operating system version number – linked to version releases from CASIO ® Reset Resetting the graphic calculator to the predetermined manufacturers specifications (as set when you initially placed in the batteries).
- Page 53 TVM [A] In this icon economic and accounting formulae can be selected and used to calculate various time, value or money problems. Notes: CHAPTER 6 | PG 53...
- Page 54 SET UP via [SHIFT] [MENU] and adjusting the appropriate settings for Sigma ∑ display to be on [F1]. CLIP and PASTE Cutting and pasting from a document (via emulator) or from a particular icon on the hand-held FX9750GII and pasting it into another working area. Copy and paste from a document Working to be transferred to another area of the calculator using COPY/CUT and PASTE.
- Page 55 Complex Numbers [in RUN-MAT] You may have noticed the calculator can provide complex number answers, for example when finding the roots to equations where the graph does not ‘cut’ the x-axis. Here the calculator that performs complex number calculations in either a + ib form or polar form (lzl and arg z).
- Page 56 MISCELLANEOUS FUNCTIONS Differentation [in RUN-MAT] cont. Example cont. Drawing the function f(x) = (x-2)e and its first and second derivatives. Result Comment on the relationships between the graphs drawn. Enter the function [SKTCH] [GRPH] [Y=] SHIFT X, θ ,T SHIFT X, θ...
- Page 57 Integration [in RUN-MAT] cont. Example cont. Do not forget to set up the Domain and Range values through the View Window. SHIFT EXE EXIT Graph and integral value SHIFT X, θ ,T then Piecewise Functions [in RUN-MAT] Piecewise functions can be entered in the usual way and then the domain values for each can be defined and finally drawn.
- Page 58 MISCELLANEOUS FUNCTIONS Piecewise Functions [in RUN-MAT] cont. Example cont. Set the V-Window to [INIT] EXIT SHIFT then You are able to trace the ‘different parts’ of a Piecewise Function using [SHIFT] [F1], then the replay arrows. Inequalities [in RUN-MAT] Finding regions that satisfy constraints as used in linear programming. Example Make sure that you have an appropriate View-Window to Function...
- Page 59 Algebraic substitution – numeric [in RUN-MAT] cont. Example Calculate the value of the following when x = -2, 0, 2 and 4, in the expression Result + 4x – 1. Enter the expression SHIFT VARS X, θ ,T SHIFT VARS X, θ...
- Page 60 MISCELLANEOUS FUNCTIONS Factorisation checking [in RUN-MAT] cont. Example 2 Factorise x + 3x - 40 Result Enter in the equation in bracketed and the expanded form X, θ ,T X, θ ,T SHIFT then X, θ ,T X, θ ,T The result 1 indicates correct factorisation.
- Page 61 In linear programming inequalities are required to find the ‘feasible region’ that satisfies the given constraints. You are able to draw inequalities with x ≥ or < or > or ≤ on the FX9750GII but finding intersection points involving vertical lines cannot be performed.
- Page 62 MISCELLANEOUS FUNCTIONS Linear programming with vertical lines: converting x = c to y = mx + c [in GRAPH] cont. Example 2a Problem: Find the feasible region that satisfies the following Result constraints over the domain 0 25 and range 0 x + y 4x + y Answer:...
- Page 63 Factorials, Combinations and Permutations – Calculations [in RUN-MAT] cont. Example How many arrangements are there of 8 people standing in a line? Result Enter either Example 2 How many ways can we choose a committee of 7 people from a group of 11...
- Page 64 MISCELLANEOUS FUNCTIONS Conversions [in RUN-MAT] Converting between units of measure can be performed on the FX9750GII using the CONVersion which is accessed via the OPTN key. The [F1] key is the conversion tool, note that it is on each conversion page.
- Page 65 Commonly used keys cont. FUNCTION LOCATION EXAMPLE Factorials OPTN, F6, F3 (PROB), F1 Permutations OPTN, F6, F3 (PROB), F2 Combinations OPTN, F6, F3 (PROB), F3 OPTN, F6, F3 (PROB), F4 then the Random Numbers Ran# desired random number generator.
- Page 66 MISCELLANEOUS FUNCTIONS Commonly used keys cont. Polar Coordinates to Rec( OPTN, F6, F5 (ANGL), F6, F2 Rectangular Differentiation for first or d/dx or d OPTN, F4, F2 (CALC), F6, F2 or F3 second derivatives Integration for area under ∫dx OPTN, F6, F5 (ANGL), F6, F4 curves Notes:...
- Page 67 Normal Distribution Analysis [in RUN-MAT] Although this could have been covered in the Statistics Chapter this topic needs to be treated separately. RESULT This is the Normal Distribution (N.D.) ‘menu’. P( calculates the N.D. shading from the left, Q( calculates the N.D.
- Page 68 NORMAL, BINOMIAL AND POISSON DISTRIBUTIONS � Normal Distribution Analysis [in RUN-MAT] cont. Data that you have entered in the ‘List’ can also be used to model the data to be normally distributed, that is, assuming the data is normally distributed. By using the z-score transform and using ‘µ’ and ‘ ’...
- Page 69 Normal Distribution Analysis [in STAT] cont. Example 3 Find the values of k such that Prob(k < Z ) = 0.45 Result then Example 4 A machine produces ball bearings with the weights of each Result normally distributed with a mean of 2700 mg and a standard �...
- Page 70 NORMAL, BINOMIAL AND POISSON DISTRIBUTIONS Binomial Distribution calculations [in STAT] cont. Example 2 Calculate the probability that from 10 trials there are at most two Result successful outcomes and the probability of a success is 0.5. Here x < 4 or x ≤ 3, i.e. x = 0, 1, 2 or 3. then Prob(x ≤...
- Page 71 Confidence Intervals [in STAT] There are four types of confidence interval calculations, one statistic (1-S), two statistic (2-S), one proportion (1-P), and 2 proportions (2-P). RESULT Note: You will have a choice of 4 different options of confidence intervals. 1-S, 2-S, 1-P, and 2-P. Use the function to select the one that fits with the statistics.
- Page 72 NORMAL, BINOMIAL AND POISSON DISTRIBUTIONS Confidence Intervals 2-S type cont. C-Level is at the 90% level Example cont. Z-score [2-S] [VAR] then This gives the interval [-0.26235, 0.46235], hence there is NO statistical difference between the two samples as 0 is contained within the interval. [-0.26235, 0.46235] Confidence Intervals 1-P type Example...
- Page 73 CONNECTION TO OTHER DEVICES A number of devices can be connected to the FX9750GII and other CASIO graphic calculators via the EA-200 data logger. [Previous data logger model EA-100 is also described as this data logger needs to have the data transferred to the calculator using small programs to send the information to the data logger and to receive the data collected back to the calculator for analysis.
- Page 74 CONNECTION TO OTHER DEVICES A Quick Guide to Using the EA-100 Data logger - Manual Set Up Step 1: Be sure to connect an Auto-ID probe to CH1, CH2, CH3 or SONIC channel. Step 2: Switch the Data Analyser to Communications mode by pressing the [MODE] key (“Done”...
- Page 75 To change sampling unit Press [Data Log] key continuously until desired unit is displayed. Note: The Data Analyser’s Auto Power Off feature is not active in this mode. Data Analyser - Program Mode Equipment Set Up Step 1: Connect the calculator to the Data Analyser using the cable. Press ends in firmly.
- Page 76 CONNECTION TO OTHER DEVICES Procedure Step 1: Heat approximately 250 ml of water. Bring it to the boil (approx 100° C). Step 2: Place the thermometer probe into the cup of water after it has been heated. Step 3: Set the rate of sampling of the EA-100 at 10 seconds and the number of samples to be taken at 200. Start the data gathering with the EA-100 and relax for the next 33 minutes and 10 seconds.
- Page 77 Using the E-CON2 icon from the MAIN MENU. The introduction of this new icon to the MAIN MENU on the FX9750GII has enabled the setting up of the devices that can be attached to the calculator easy by following the prompts on the screen using the WIZard via SET [F1].
- Page 78 CONNECTION TO OTHER DEVICES Calculator to computer data transfer Calculator to calculator connection is via the 5-pin/USB cabling. Follow the Function keys for setting up this feature via LINK from the MAIN MENU. Calculator to data projector data transfer Calculator to calculator connection is via the 5-pin/USB cabling. Follow the Function keys for setting up this feature via LINK from the MAIN MENU.
-
Page 79: Key Index
KEY INDEX Primary Function Combined with Combined with SHIFT ALPHA Trace Turns trace function on/off. Selects first function menu item Zoom Turns zoom function on. Selects second function menu item Displays View Window parameter input V-Window screen. Selects third function menu... - Page 80 KEY INDEX Primary Function Combined with Combined with SHIFT ALPHA Press before entering value to calculate Press before entering exponent Enters letter B common logarithm value of 10 Press before entering value to calculate Press before entering exponent Enters letter C natural logarithm value of e Press before entering value to calculate...
- Page 81 Primary Function Combined with Combined with SHIFT ALPHA Division function Enters close curly set bracket Enters letter T ÷ List Enters number one ‘Hot key’ for list Enters letter U Enters number two ‘Hot key’ for Matrix Enters letter V...
- Page 82 INDEX A - D PAGE Algebra Algebraic substitution 12, 57 Analysis of the Results Angle Auto zoom Binomial distribution calculations in STAT Bi-variate Calculator settings Calculus Capture Catalogue Key 25, 31 Change sampling unit Channel Clear Screen 9 , 15 Clip and Paste Combinations Commonly used keys...
-
Page 83: Getting Started
D - G D cont. PAGE Decimal Deleting Lists Differentiation Display Distribution Binomial distribution calculations in STAT Normal Distribution Analysis RUNMAT Normal Distribution Analysis STAT Poisson Calculation in STAT Domain edited Dyna 5, 45 E Symmetry EA100 Manual Set Up... -
Page 84: Option, Variations And Catalogue Keys
INDEX G - O G cont. PAGE Graph cont. Zooming in and out G-Solve features Hyperbolic Icon modes Inequalities Integration Intercepts Intersection points Key Index Language Light Probe Line Linear programming with vertical lines Link 5, 51 List Deleting Editing List Main Menu Icons Manual Set Up –... -
Page 85: Other Devices
O - S O cont. PAGE Other cont. Types of Equations Other Devices Connection to Venier Probes Parabola Paste Percentage Percentage key Percentages Permutations Picture Piecewise functions 20, 56 Plotting points Poisson Distribution Calculations in STAT Polynomial Equations Power Properties... - Page 86 INDEX S - T S cont. Sequence and Series in RECUR Series Setting Time Interval, Number of Samples and Time Type Setting up within each icon Simultaneous Equations Solving Other Types of Equations Polynomial Equations Trigonometric equations ‘X=...’ equations STAT Binomial distribution calculations Confidence Intervals Distribution Poisson Calculations...
- Page 87 V - Z V cont. Vertical Lines – Linear Programming Voltage Probe ‘X=...’ equations X-values Zoom Auto In and out INDEX | PG 87...
Need help?
Do you have a question about the fx9750GII and is the answer not in the manual?
Questions and answers