Advertisement
Table of Contents
QU ICK RE FE RE NC E CARD
Selecting the RUN
will allow you to perform
general computations and
arithmetic.
The
key is used to obtain a
z
fraction bar. To obtain a mixed
number, press
z
the whole number.
icon
after inputting
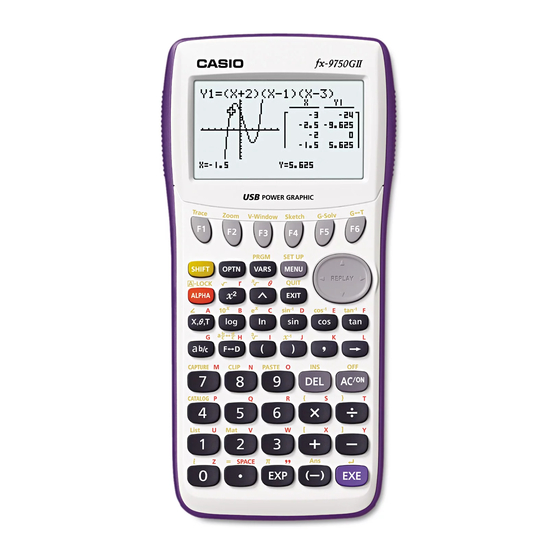
"The Basics" Reference Card
CASIO fx-9750 Series
The function keys allow you to
access the tab (soft key) menus that
will come up at the bottom of the
screen. When an
the ukey, selecting
more on-screen choices
The
key displays every mode the
p
calculator has. To select a mode,
you may
$B
and press
or press the number or
l
letter in the lower right hand corner
The
key operates like the back
d
arrow on a web browser; it will take
you back one screen each time you
select it. The
d
you to the icon menu.
The
key is a toggle key that will
x
change answers or entered numbers
back and fourth from decimal to
The
key will power the unit on.
O
To turn the unit off, press the yellow
L
The
key executes operations.
l
When data is entered, the
must be pressed to store the data.
II
fx-9750G
appears above
will offer
u
to the desired icon
of the icon.
key will not take
fraction form.
key, then Okey.
button
l
.
Advertisement
Table of Contents

Related Manuals for Casio FX-9750GII-IH


Summary of Contents for Casio FX-9750GII-IH
- Page 1 “The Basics” Reference Card fx-9750G CASIO fx-9750 Series QU ICK RE FE RE NC E CARD The function keys allow you to Selecting the RUN icon access the tab (soft key) menus that will allow you to perform will come up at the bottom of the general computations and screen.
- Page 2 This icon menu is use to control the optionally available EA-200 Analyzer Data Analyzer. For information about this icon menu, download Link the E-CON2 manual from http://edu.casio.com. This icon menu is used to transfer memory contents or back-up LINK data to another unit or PC.
- Page 3 To change the number of decimal places displayed, enter the set up menu by pressing to Display, select (Fix) and enter the desired amount of decimal places followed by For this example, 3 decimal places are used. LpNNNNNNNNNNNq3ldlx Casio “The Basics fx-9750GII”...
- Page 4 Note: Calculations can be performed with complex numbers and answers can be displayed in a+bi form. 3 To calculate ; enter the following from the Run home screen: iewj3+4qkl To calculate ( ; enter the following: iejn3+2qk+15ql Casio “The Basics fx-9750GII”...
- Page 5 32fs-5f-3l To analyze features of this graph (roots, maximum and minimums, y-intercepts, intersections, determine coordinates, and integrals) select (G-Solve) (Root): Note: The left-most root will always display first. Select to display the next root. Casio “The Basics fx-9750GII ”...
- Page 6 (y-calculation): What is the value of y when x is (x-calculation): What is the value (s) of x when y is 1? (integral): Determine the integral value at (0,3) for the function Casio “The Basics fx-9750GII ”...
- Page 7 ). You can insert and delete rows in this view by pressing (ROW). From the table view screen, you can press (G-CON) to see a linear graph or (G-PLT) to see a plot graph for the function you entered. Casio “The Basics fx-9750GII ”...
- Page 8 To see a split screen of your table and graph, press to enter the setup menu for the table icon and to Dual Screen, select (T + G), , and then Casio “The Basics fx-9750GII ”...
-
Page 9: Statistics
The initial default graph is a scatter-plot. To change the type of graph you would like to use, press (GRPH), then (SET), to Graph Type:, for this set of data, we will make a histogram, press and then for histogram. Casio “The Basics fx-9750GII ”... - Page 10 To see a scatter-plot of these data, you can go through and change back GPH 1 using the process above, or select (GPH 2) from the List Editor screen whose default is also a scatter-plot. Casio “The Basics fx-9750GII ”...
- Page 11 form. From this screen, you select (COPY) to copy and then paste the equation into the initial graph screen or select (DRAW) to show the linear regression. Casio “The Basics fx-9750GII ”...
- Page 12 To enter this system of equations (already in standard form) input the following: There are four options at the bottom of the screen, press (SOLV). The solution to this system is (1, -1, 2). Casio “The Basics fx-9750G...
- Page 13 We will take a look at solving a linear equation and a formula. To find the value of x in the following equation, 2(x 5) = 3x + 2, input the following starting from the Equation Editor Screen: e2jf-5kL.n3f+2lu Casio “The Basics fx-9750GII ”...
- Page 14 To enter the formula input the following in to the calculator: qBa2L.4z3Lca6^3l Note: Selecting will take you back to the previous screen where you can edit and re- solve the previous equation or begin a new problem. Casio “The Basics fx-9750GII...
- Page 15 For example, you can now examine the line of symmetry for this parabola and the equation of that line will be displayed. You can continue to analyze different areas of this graph and the line of symmetry will still be displayed. Casio “The Basics fx-9750GII ”...
Need help?
Do you have a question about the FX-9750GII-IH and is the answer not in the manual?
Questions and answers