
Related Manuals for 3nh TS Series


Summary of Contents for 3nh TS Series
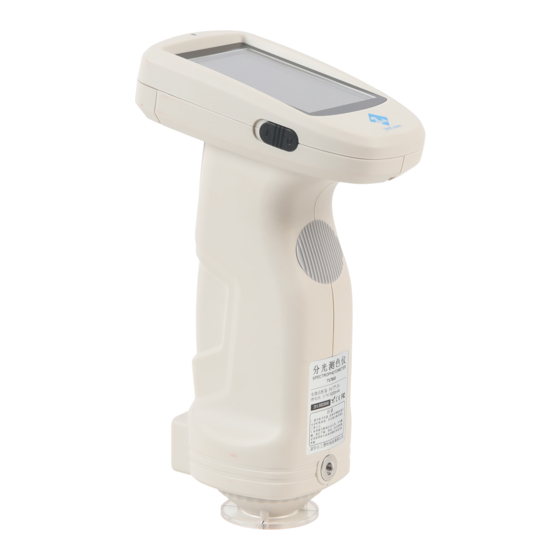
- Page 1 Spectrophotometer OPERATION MANUAL Please read this manual carefully before use the spectrophotometer.
- Page 2 Safety Instructions Please read carefully and strictly abide by the following provisions to avoid accidental injury or harm. The company shall not be liable for any loss arising from the use of the instrument in violation of this manual. 1. This instrument uses built-in battery which can not be replaced with other batteries, in case of damage to the instrument or other malfunctions.
-
Page 3: Table Of Contents
Content Instruduction....................................4 Cautions.......................................4 1. Interface Description................................5 2. Operating Instruction................................6 2.1 Power On& Off................................6 2.2 Calibration..................................6 2.3 Measurement Instruction............................9 2.4 Measurement................................11 2.4.1 Standard Measurement..........................11 2.3.3 Sample Measurement...........................14 2.3.4 Average Measurement..........................16 2.5 Connecting to PC..............................16 2.5.1 USB Connection.............................16 2.5.2 Bluetooth Connection............................17 2.6 Print....................................17 3. -
Page 4: Instruduction
Instruduction This instrument is a high-precision spectrophotometer with independent intellectual property rights independently developed by the company. It is a leader in the field of portable spectrophotometers. It is suitable for precise color transfer and quality control of plastic electronics, chemical coatings, ink printing, textile printing and dyeing, automotive electronics, medical analysis, cosmetics and food analysis, etc. -
Page 5: Interface Description
1. Interface Description Figure 1 Interface Description Port Description 1. Power Switch 1/0: Push the switch to “1” to turn on the instrument. Push the switch to “0” to turn it off. 2. USB/RS-232/Charging port: common interface. The instrument automatically judges the connection. USB interface is used to connect to PC software. -
Page 6: Operating Instruction
* When the instrument is in working mode and the power of the instrument is less than 10%, the red light will flash. 6. M5 fixed thread hole: fixed instrument thread interface. Thread type is standard metric common coarse thread, pitch 0.8mm, depth 5mm. - Page 7 Figure 2 Main menu Select “Calibration” to enter white and black calibration interface as shown in Figure 3. It will show if the calibration is valid or not, and the remaining time if it is valid. Figure 3 White and Black Calibration Click to continue and enter “Black Calibration”...
- Page 8 Figure 4 Black Calibration After black calibration, it will prompt you to white calibration as shown in Figure 5. According to the prompt, confirm the serial number of white calibration plate correspond to the instrument and correct aperture setting, then put the measuring aperture on white board and press “Testing key” for white calibration, or click to cancel and quit the calibration.
-
Page 9: Measurement Instruction
Figure 5 White Calibration 2.3 Measurement Instruction As shown in Figures 6, 7, and 8, it is working condition area at the top of measurement interface, displaying the status of measurement mode (SCI/SCE), Bluetooth and UV conditions. Under the measurement interface is a shortcut display area. - Page 10 Figure 6 Standard Measurement Interface...
-
Page 11: Measurement
Figure 7 Spectral Reflectance Figure 8 Color Index Interface 2.4 Measurement Measurement is divided into standard measurement and sample measurement. The standard measurement is to measure the chromaticity data of standard sample, while sample measurement is to measure the color different or contrast chroma data between standard sample and target sample. After turning on the the instrument and finishing the white and black calibration, it is ok to do the standard measurement and sample measurement (the users can set the corresponding color space and color index in the main menu interface as required (please refer to Chapter 3 for... - Page 12 1) Interface Title: Indicating it is under interface of standard measurement. 2) Condition area: display system setting such as illumination,UV (on/off), Bluetooth (on/off), measurement mode and the current time, date and power etc. Only when turn on Bluetooth or UV function, they will be highlighted. 3) Camera Locating: Click to use the camera to position the measurement, then press “Testing”...
- Page 13 Figure 9 Standard measurement...
-
Page 14: Sample Measurement
Figure 10 Reflectance of standard measurement 2.3.3 Sample Measurement After testing the standard, click “Sample measurement” to enter Sample Measurement interface. It is the same steps with standard measurement. After measurement, it will display as shown in Figure 11 and in Figure 12. Sample measurement is similar with standard measurement but it will display the color difference between the current standard and measured sample. - Page 15 9) Wavelength switch button: As shown in Figure 12, click , the wave length and reflectance of the current sample will switch as range of 10nm interval. Figure 11 Sample Measurement...
-
Page 16: Average Measurement
Figure 12 Reflectance of Sample Measurement 2.3.4 Average Measurement When the measured sample is very large or relatively not very uniform, it needs to measure several points to get an average reflectance to show the sample true chromatic value. This instrument can realize 2-99 times average measurement. -
Page 17: Bluetooth Connection
2.5.2 Bluetooth Connection For these models with Bluetooth function, it can connect to PC software through Bluetooth. After installing the PC software, open Bluetooth function in the system setting, and set Bluetooth matching in the PC software setting. If Bluetooth matching successes, it could measure the sample and standard or analyze the data on the computer.If the connection is successful, the instrument can be fully controlled by software, and relevant samples can be tested and analyzed. -
Page 18: Main Menu
Figure15 Print Data 3. Main Menu Click in the main menu interface or in other interfaces to enter the main menu and set all system functions from each submenu. 3.1 Data Management Click “Data Manage” in main menu to enter data management interface as shown in Figure 16. Data management is mainly for checking, operating the measured records and inputting standard data manually. -
Page 19: Check Record
Figure 16 Data Management 3.1.1 Check Record 1)Check Standard Record Select “Check Record” to enter “Standard Record” interface as shown in Figure 17. The measurement condition shows the standard light mode, UV status and the measurement mode, measurement time & date. - Page 20 Figure 17 Standard Record...
- Page 21 Figure 18 Reflectance of Standard Record Click to check previous or next record. Click to switch among chromatic data, reflectance, color index as shown in Figure 17 and in Figure 18. Click “Operate” to delete record, edit name, standard entering or print data as shown in Figure 19. Figure19 Standard Record Interface Click the standard name in standard record interface to edit as shown in Figure 20, and input new name (not over 8 characters), click...
- Page 22 Figure 21 Edit Name...
- Page 23 Figure 21 Standard Entering 2)Check Sample Record Click in standard record interface to check the sample record as shown in Figure 22. Figure 22 Sample Record...
-
Page 24: Delete Record
Figure 23 Reflectance of Sample Record Click to check previous or next record. Click to switch among chromatic data, reflectance, color index as shown in Figure 22 and in Figure 23. Click to delete record, edit name, standard entering or print data. It is the same with standard record operation. - Page 25 Figure 24 Delete Record...
-
Page 26: Search Record
Figure 25 Delete All Samples 3.1.3 Search Record In the data management interface, click "Search Record" to enter the search menu, as shown in Figure 26. It could choose "Search Standard Name", "Search Standard Index" and "Search Sample Name". Figure 26 Search Record Search Standard Name Click “Search Standard Name”... - Page 27 Figure 27 Input Search Name...
-
Page 28: Standard Input
Figure 28 Search Record Figure 29 Tips for no records 3.1.4 Standard Input In the data management interface, click "Standard Input" to enter the standard input interface, as shown in Figure... - Page 29 Figure 30 Standard Input Click "Name" to input the standard name. The default is "No Name". Click "Measurement Mode" to set the standard measurement mode, including SCI, SCE, SCI+SCE(I+E). Click "Illuminant" to set the standard light source. Click "Color Space" to select color space. At present, it only supports CIE LAB, and CIE XYZ. Click "Observer Angle"...
-
Page 30: Calibration
Figure 30 Input L Value 3.2 Calibration White and black calibration as a standard for chromatic data, is required to be done correctly, otherwise it will affect the validity of the data. When the calibration environment is very different from the test environment of the current sample (for example temperature fluctuate violently), the instrument is required to be re-calibrated timely. - Page 31 Figure 32 Light Source Click "Observer Angle" to switch 10 degree or 2 degree. 10 degree is CIE1964 standard, while 2 degree is CIE1931 standard. Click "Illuminant",as shown in Figure 33, users could select D65, A, C, D50, D55, D75, F1, F2(CWF), F3, F4, F5, F6, F7(DLF), F8, F9, F10(TPL5), F11(TL84), F12(TL83/U30).
-
Page 32: Average
Figure 33 Illuminant 3.4 Average When the measured sample is very large or relatively not very uniform, users need to measure several points to get an average reflectance to show the sample true chromatic value. This instrument can achieve 2-99 times average measurement. -
Page 33: Set Color Index
Figure 34 Color Space 3.6 Set Color Index Color Index interface could select the current color formula and color index, as well as set the parameter of color formula and metameric index, as shown in Figure 35. 3.6.1 Set Color Index In the main menu, click “Color Index”... - Page 34 Figure 35 Color Index...
- Page 35 Figure 36 Color Formula Click any color formula or color index to choose the corresponding color formula or color index and click confirm as shown in Figure 36. The selected color formula will be used to calculate the color difference during sample measurement as shown in Figure 37.
- Page 36 Figure 38 Yellowness Index 3.6.2 Parameter Factors Settings and Metameric Index In the color index interface, click “Parameter factors settings” as shown in Figure 39.
- Page 37 Figure 39 Parameter Factors Setting 1) Setting Factors For C I E D E 2000 (ΔE00), C I E D E 1994 (Δ E 94), C M C (Δ E C M C (l: C)), users can set L, C, H value (CMC only sets L and C).
- Page 38 Figure 40 Δ E 94 Factors Click KL, KC, KH to enter edit interface as shown in Figure 41, input a value to click to confirm or cancel.
- Page 39 Figure 41 Factor KL 2) Metameric Index In the Parameter factors settings interface, click “Metameric Index” as shown in Figure 42, separately set light 1 and light 2, and click to confirm or to cancel.
-
Page 40: Display Setting
Figure 42 Metameric Settings 3.7 Display Setting In the main menu, click “Display” as shown in Figure 43. It could set color offset, test result, and operate habit. If turn on the function of color offset, it will display the color offset on the sample measurement as shown in Figure 44;... - Page 41 Figure 43 Display...
-
Page 42: System Setting
Figure 44 Sample Measurement with color offset 3.8 System Setting In the main menu, click “System Setting” as shown in Figure 45, Figure 46 and Figure 47. System Settings include automatic measurement save, measurement aperture, Bluetooth, buzzer, measurement mode, calibration valid, measurement control mode, language, time, screen backlight time, screen backlight brightness, etc., as well as factory Settings recovery, view software and hardware version number, SN code and other functions. - Page 43 Figure 46 System Settings...
-
Page 44: Auto Save
Figure 47 System Settings 3.8.1 Auto Save When turn on the function of auto-save, it will automatically save data when measured, or it is required to manual click to save as shown in Figure 48. Figure 48 Manually Save Data 3.8.2 Measurement Aperture The series spectrophotometer features with 8mm or 4mm aperture. -
Page 45: Bluetooth
Note: Please confirm the system measurement aperture should be the same with the actual aperture. If it is Φ4mm aperture, switch to SAV; if Φ8mm aperture, switch to MAV, or it could cause wrong test result. After switching the measurement aperture, you have to re-calibrate the instrument Figure 49 Measurement Aperture 3.8.3 Bluetooth The Bluetooth®... -
Page 46: Measurement Mode
3.8.5 Measurement Mode SCI: Specular Component Include SCE: Specular Component Exclude In this instrument, the SCI / SCE test mode is switched through the traditional way of setting mechanical optical well. The SCI measurement mode is when the motor drives the paddle to block the mechanical optical well, and the SCE measurement mode is when the paddle is opened. -
Page 47: Control Mode
Figure 50 Calibration Validity If power on calibration is selected, it could do white and black calibration every time when you turn on the instrument. If not, it would be only able to check records and not complete the test. If 4 Hours validity is selected, the validity of Calibration will expire in 4 hours. -
Page 48: Language Setting
PC software: if selecting this mode, when the instrument is connected with PC software, the instrument only could use software to complete the test and if necessary, it is able to upload data to the instrument. Key | PC software: if selecting this mode, the instrument could use software or keys to complete the test and upload data to PC software. -
Page 49: Backlight Time
Figure 51 Time Setting 3.8.10 Backlight Time Click “Backlight Time” in the system settings interface to enter the “Backlight Time” selection interface. It includes: "Normally Open", "1 minutes", "5 minutes", "10 minutes", "30 minutes". If selecting normally open, It will not automatically stop the screen or shut down when there is no operation except no power. If it is set to "1 minute", the instrument will be timed from the last operation, the screen will disappear after 60 seconds, and the instrument will automatically soft shut down after 3 minutes, and enter the power saving mode. -
Page 50: Restore Factory Settings
Figure 53 Screen Brightness 3.8.12 Restore Factory Settings Click “Restore Factory Setting” in “Settings” as shown in Figure 54. Click , the instrument will restore factory settings and all records will be cleared, while click to cancel this operation. Note: Restore factory setting will delete all test data and settings. All are irrecoverable so please operate it carefully. -
Page 51: Daily Maintenance
Figure 54 Restore Factory Setting 4. Daily Maintenance 1) The instrument is a precision optical instrument. This instrument is a precision optical instrument. Please keep and use the instrument properly. Avoid using and storing the instrument under humid, strong electromagnetic interference, strong light and dusty environment. -
Page 52: Technical Parameters
5. Technical Parameters 5.1 Technical Features (Advance) 1. Perfect combination of beautiful appearance and the human body mechanics structural design; D / 8 geometric optical structure, conforming to CIE No.15, GB / T 3978, GB 2893, GB / T 18833, iso7724 / 1, ASTM e1164, din5033 teil7;... - Page 53 Reflectance Range Customized one aperture: Measuring MAV:Φ8mm/Φ10mm;SAV:Φ4mm/Φ5mm MAV:Φ8mm/Φ10mm; Aperture SAV:Φ4mm/Φ5mm Specular SCI&SCE Component CIE LAB,XYZ,Yxy,LCh,CIE CIE LAB,XYZ,Yxy,LCh,CIE Color Space LUV,s-RGB,HunterLab,βxy,DIN Lab99 Munsell(C/2) LUV,s-RGB,βxy,Munsell(C/2) Color Difference ΔE*ab,ΔE*uv,ΔE*94,ΔE*cmc(2:1),ΔE*cmc(1:1),ΔE*00 ΔE*ab,ΔE*uv,ΔE*94,ΔE*cmc(2:1),ΔE*c Formula , DINΔE99,ΔE(Hunter) mc(1:1),ΔE*00 WI(ASTM E313, WI(ASTM E313,CIE/ISO,AATCC,Hunter), CIE/ISO,AATCC,Hunter), YI(ASTM D1925,ASTM 313), YI(ASTM D1925,ASTM 313), Other Staining Fastness, Color Fastness, Color Colorimetric...
-
Page 54: Appendix
Language Simplified Chinese, English, traditional Chinese Operating 0~40℃, 0~85%RH (no condensing), Altitude < 2000m Environment Storage -20~50℃, 0~85%RH (no condensing) Environment Power Adapter, User Guide, PC Software(Download Power Adapter, User Guide, PC from office website), USB cable, White and Black Software(Download from office website), Standard Calibration Cavity, Protective Cover, Wrist strap, 8mm... - Page 55 CIE 1994 ∆E*ab Color cast judgment ∆L+ represent whitish, ∆L- represent blackish ∆a+ represent reddish, ∆a- represent greenish ∆L+ represent yellowish, ∆L- represent bluish 4. The human eye distinguishes colors The color difference unit of NBS is derived from the unit of the color difference calculation formula established by Judd-Hunter.
Need help?
Do you have a question about the TS Series and is the answer not in the manual?
Questions and answers