Table of Contents
Advertisement
Quick Links
Advertisement
Table of Contents

Related Manuals for Sencore VB2 Series

Summary of Contents for Sencore VB2 Series
- Page 1 VB2xx GigE Probes Applies to software release v5.4 Form 7653J • February 2018...
- Page 2 Inquiries should be made directly to those companies. This document may also have links to third-party web pages that are beyond the control of Sencore. The presence of such links does not imply that Sencore endorses or recommends the content on those pages. Sencore acknowledges the use of third-party open source software and licenses in some Sencore products.
-
Page 3: Table Of Contents
Contents Contents Document Revision History INTRODUCTION About the Probe ........1.1.1 Probe –... - Page 4 4.7.1 Interfaces ........4.7.2 Additional notes .
- Page 5 6.3.2.3 OTT — Details — Alarms ......6.3.2.4 OTT — Details — Thumbnails ..... 6.3.2.5 OTT —...
- Page 6 6.9.11 ETR 290 — Compare ....... . 147 6.9.12 ETR 290 — ETR threshold ......151 6.9.13 ETR 290 —...
- Page 7 6.17.5.4 Example 3 – Mixed Mode IPv4 ..... 231 6.17.6 Setup — VLANs ........231 6.17.7 Setup —...
- Page 8 Wait while the software is being saved ......266 Verify the new image ........266 Software upload troubleshooting .
-
Page 9: Document Revision History
Document Revision History Date Version Description February 2018 Updated manual to reflect changes in v5.4 software February 2017 Updated manual to reflect changes in v5.3 software March 2016 Updated manual to reflect changes in v5.2 software February 2015 Updated manual to reflect changes in v5.1 software January 2014 Updated manual to reflect changes in v5.0 software VB2xx GigE User’s Manual version 5.4... -
Page 10: Introduction
1 INTRODUCTION 1.1 About the Probe 1.1.1 Probe – Overview The VB2xx series of probes consists of the VB220 rack-mount IP probe, the VB220-DMG DMG3200 chassis 1RU/4RU IP probe and the VB20 portable IP probe. The VB220 can be bundled with a range of interface modules for monitoring of signals as found in cable (QAM), satellite (DVB-S/S2) and terrestrial (DVB-T/T2/8VSB). -
Page 11: Probe - Features
The ETR 290 software option performs extended ETSI TR 101 290 analysis, enabling detailed transport stream monitoring, including verification of PSI/SI and bitrate monitoring for individual services and service components. A built-in web server in the probe allows remote signal monitoring using a standard web browser. This can be managed either through a separate Ethernet network, or by using the regular video/data network –... -
Page 12: Probe - Functionality
ETR analysis (Requires ETR290-OPT, (Requires ETR290-OPT, (Requires ETR290-OPT, can be licensed with up can be licensed with up can be licensed with up to 50 parallel ETR290 to 50 parallel ETR290 to 50 ETR290 Engines Engines for Ethernet Engines for Ethernet for Ethernet.) and one Engine for and one Engine for ASI. -
Page 13: How To Use This Manual
Full Service Monitoring (FSM) checks that vital system components like CA-servers are active. Optional Ethernet TR 290 monitoring allows the operator to check parameters like transport stream sync and PSI/SI standards conformity. This option also performs further PSI/SI analysis, making it possible to view PSI/SI contents. - Page 14 E Appendix: Software Upload explains how to upgrade the software on the Probe. F Appendix: Restoring probe factory defaults details how to reset the Probe to factory default settings. Note that current version of the User’s Manual can be obtained from Sencore ProCare support by emailing procare@sencore.com.
-
Page 15: Principle Of Operation
2 PRINCIPLE OF OPERATION The probe module is equipped with two RJ45 Ethernet ports and one SFP optical port. The user selects which transport stream signal input to be used by the monitoring engine, either the Ethernet video/data port or the SFP optical input. Management of the probe is conducted via the Ethernet management port or alternatively in-band via the video/data ports. - Page 16 If the data do not comply with the threshold values alarms will be generated. The overall alarm settings further make it possible to enable and disable alarms, thus defining which alarms should be reported in the Probe alarm list and sent as SNMP traps to an external management system. SNMP Alarm Alarms...
-
Page 17: Safety
3 SAFETY Read the installation instructions before connecting the chassis unit to the power source. Do not install the chassis unit with power on. The chassis or the portable unit is intended for installation in restricted access areas. A re- stricted access area can be accessed only through the use of a special tool, lock and key, or other means of security. -
Page 18: Installation And Initial Setup
4 INSTALLATION AND INITIAL SETUP 4.1 Quick Installation Guide 1. Read the safety instructions, refer to chapter 3 2. Install the unit in a 19 inch rack for rack mount probes, refer to section 4.9 3. Connect the signal cables, refer to section 4.8.1 4. -
Page 19: Dual Power Supply
4.2.1 Dual Power Supply The Enhanced Chassis (VB300) is delivered with two 100–240V AC / 75W power supplies, providing power redundancy. Each VB300 unit consists of a 1RU chassis with 3 option slots. In normal operation load is shared between the two power supplies. If mains fall-out occurs for one of the power sources or one of the power supplies fails, the power supply still in operation will take the full load, seamlessly. -
Page 20: Cooling System
4.3.2 Cooling System The chassis is equipped with six long-life fans that suck in air from front of the chassis. The air exits at the back of the unit. The fans are temperature controlled, allowing them to run at an optimum speed. Venting holes at the sides of the chassis provide an optional air intake, ensuring good aerodynamic properties of the cooling air flow. -
Page 21: Serial Number Location
4.4 Serial Number Location The serial number of the Enhanced Chassis is located at the rear of the unit. The serial numbers of the individual optional modules are located on the components side of the modules. All serial numbers can also be found on the shipping box. -
Page 22: Vb200-Dc Power Supply
4.5.3 VB200-DC Power Supply The VB200-DC unit is equipped with a –48V DC / 50W power supply. The power plug is a male 3-PIN D-sub(15) Connector. A matching female plug is supplied with the VB200-DC unit. This plug should be soldered to the power cable in accordance with the drawing in figure 4.7. -
Page 23: Portable Chassis (Vb20)
4.6 Portable chassis (VB20) The VB20 portable probe is built for real world use. Its ruggedized exterior and fan-less design gives engineers the perfect fault-finding tool when roaming in the network or for permanent placement in a harsh environment. Figure 4.8: The VB20 portable probe 4.6.1 AC Power Supply The portable chassis is delivered with one built-in 100–240V AC / 40 W power supply. -
Page 24: Dmg3200 Chassis (Vb220-Dmg)
4.7 DMG3200 chassis (VB220-DMG) Figure 4.9: The VB220-DMG probe The VB220-DMG is available to order for use in DMG3200 4RU and 1RU chassis. 4.7.1 Interfaces Both DMG3200 chassis versions of VB220 support all the same Ethernet traffic monitoring features as the standard VB220. -
Page 25: The Hardware Modules And Connectors (Vb220)
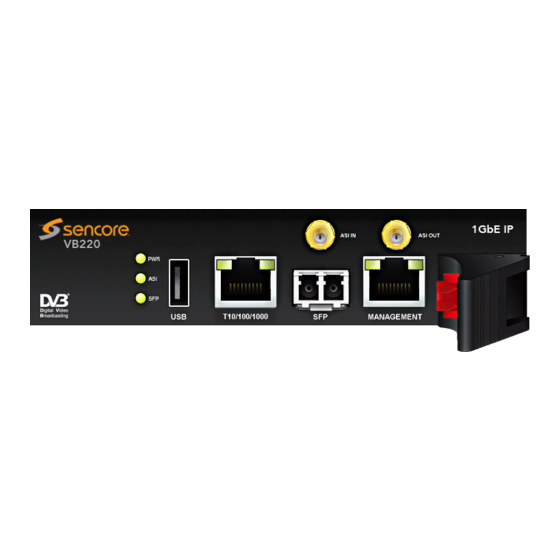
4.8 The Hardware Modules and Connectors (VB220) 4.8.1 The Probe Module The Probe module is equipped with the following connectors: USB: USB serial port emulator for initial set-up of the probe – Type A 1PPS: 1PPS reference clock input – 50 ohm BNC female ASI IN: ASI transport stream input –... -
Page 26: The Vb242 Asi Input Module (Vb220 Option)
4.8.2 The VB242 ASI Input Module (VB220 option) The VB242 module is equipped with the following connectors: ASI 1 – 6 : ASI transport stream input – 75 ohm BNC female For each ASI input an associated LED indicates current status: GREEN: The associated ASI input is currently being monitored and there is ASI sync RED:... -
Page 27: The Vb262 Dual Qam/8Vsb Demodulator Module (Vb220 Option)
The VB252 COFDM demodulator is an optional input interface module. It supports DVB-T and DVB-T2. It has two RF inputs; one or two of these are enabled according to probe licensing. The connectors are: RF IN: RF input – 75 ohm F-connector 1PPS IN: 1PPS reference clock input –... -
Page 28: The Vb272 Dual Dvb-S/S2 Demodulator Module (Vb220 Option)
4.8.5 The VB272 Dual DVB-S/S2 Demodulator Module (VB220 option) The VB272 DVB-S/S2 Demodulator is an optional input interface module capable of receiving DVB-S (QPSK) and DVB-S2 (8PSK, 16APSK, 32APSK) signals. The module has two RF inputs. The second input can be activated through a software option key. The connectors are: DVB-S/S2 1: RF L-band input with DiSEqC 1.2 –... - Page 29 Figure 4.10: Block diagram A VB220 (Controller card) must be in the leftmost slot in the chassis, the VB272-SMA must be placed in the middle slot and the 273 blade in the slot to the right. The RF out 1 and RF out 2 should be connected to their corresponding connector on the VB272 blade.
- Page 30 IF in 1: 75 ohm female BNC for 70 MHz IF signals as found in satellite uplink scenarios. First input terminal. The input signal level should lie in the range -15 dBm to 0 dBm in order to guarantee a correct level on the up-converted RF out 1 terminal IF in 2: 75 ohm female BNC for 70 MHz IF signals as found in satellite uplink scenarios.
-
Page 31: Installing The Unit In A Rack (Vb220)
• Permanently on: Auto mode • Slowly flashing: SuperLocal mode. Basic specifications: IF frequency range: 50 to 140 MHz Main Line Loss: Typically 1 dB Isolation: Typically 60 dB for 70-140 MHz Oscillator feedthrough: Typically -60 dBm at 1094 MHz IF connectors: BNC, female, 75 ohm RF connectors:... -
Page 32: Optional Installation - Connectors At The Rear Of Rack
4.9.2 Optional Installation — Connectors at the Rear of Rack For rear mounting of the chassis, the rack ears should be moved prior to rack installation. Unscrew the six size 2 Phillips screws holding the rack ears, and move the six screws covering the rear mounting holes to the front mounting holes. -
Page 33: Initial Configuration
4.11 Initial Configuration There are two alternative ways of performing an initial configuration of the probe module: 1. By using the preconfigured IP address of the probe management port 2. Via serial console emulated over USB For most users the first method will be the easiest. Note that if there are several Probe modules in the chassis, each module should be configured individually, one by one. - Page 34 Figure 4.13: Setting the IP address manually in Windows Most operating systems will have native support for the FT232 driver needed. When a USB cable is connected between a PC and the Probe, the operating system will detect a new USB device. For Windows, the new device will appear as a COM port in the Device Manager view as shown in figure 4.14.
- Page 35 Figure 4.14: Connecting to the serial console over USB • Parity: None • Stop bits: 1 • Flow control: None Press a few times to bring up the login prompt. Log in using the user name admin and the Enter password elvis (this password can be changed in the Setup –...
-
Page 36: Verifying Correct Initial Setup Of The Probe
Menu: /ewe/probe/core/setup/ethernet/ ============================================================================== <0> Back <9> Exit <1> ethStatusDoc ------------------------------------------------------------------------------ <A> data_medium - Copper Input for the video traffic <B> data_dhcp - false RJ45 data port (eth0) DHCP <C> data_ipa - 10.0.30.101 RJ45 data port (eth0) IP address <D> data_mask - 255.255.255.0 RJ45 data port (eth0) netmask <E>... -
Page 37: Initial Setup Troubleshooting
Figure 4.16: Web-based management view • Microsoft Edge • Microsoft Internet Explorer 11 or higher • Apple Safari Type the IP address of the probe in the browser URL field and press . The IP address of the Enter probe is that of the eth0 or eth1 port (the one used for management) as set in the initial set-up procedure. The default management view should be displayed inside the browser. - Page 38 • Make sure that the IP address of the gateway and the network interface are not the same • Verify that the appropriate Ethernet link indicators of the PC and probe are lit • Verify that web browser proxy settings are not interfering •...
-
Page 39: Quick Setup Guide
5 QUICK SETUP GUIDE This quick setup guide is intended to provide a step-by-step explanation of how to setup a probe once the initial setup has been performed (as described in chapter 4). More detailed instructions are found in chapter 6 of this manual. The Return Data Path and Full Service Monitoring features are not covered by this quick setup guide. -
Page 40: Ott Input (Ott Engine Option Only)
Note: Often upstream equipment will not transmit multicasts unless join messages have been received, and in this case it will usually not be possible to detect multicasts automatically. Select predefined threshold templates that seem appropriate for the signal. Note that the sequence of the multicast definitions will be reflected in monitoring, so order the multicasts correctly if required. -
Page 41: Adjusting Alarm Thresholds
For ASI input the relevant monitoring views are Alarms, ETR 290 and ASI — Status. For demodulator inputs the relevant monitoring views are Alarms, ETR 290 and COFDM/QAM/VSB/RF/ SAT — Status. Ethernet monitoring hints are found in B Appendix: Monitoring Practices. 5.4 Adjusting Alarm Thresholds When the probe inputs and streams have been defined using default thresholds, the result will usually be a number of more or less permanent alarms, some which may not be relevant under the current... - Page 42 Creating a new threshold template is done either by copying an existing one and altering the copy, or by creating a new threshold template from scratch. The thresholds are defined in these views: ETR 290 — ETR thresh., ETR 290 — PID thresh., ETR 290 — Service thresh., and possibly COFDM/QAM/VSB/ RF/SAT —...
- Page 43 VB2xx GigE User’s Manual version 5.4...
-
Page 44: The Probe Graphical User Interface
6 THE PROBE GRAPHICAL USER INTERFACE VB2xx GigE User’s Manual version 5.4... - Page 45 The VB220 web interface is reached by pointing a web browser to the IP address of the Probe as shown in the screen shot above. The following web browsers are recommended: • Google Chrome • Mozilla Firefox • Microsoft Edge •...
-
Page 46: Main
6.1 Main 6.1.1 Main — Summary The intention of this page, together with the alarm list, is to provide enough information for the operator to immediately see if there is anything seriously wrong with one or more input streams. At the very top, a graphic is displayed representing the front panel of the probe, indicating the status of the different inputs. - Page 47 Timezone: The time zone as selected by the operator in the Setup — Params view. Time: The current local time (configured in the Setup — Params or Setup — Time view). (Bulb): The RDP bulb indicates whether RDP is active or not. Green indicates RDP active whereas grey indicates that RDP is currently not active.
- Page 48 (Bulb): The bulb indicates whether the data interface is connected and active or not. IPv4 status: The IPv4 status as defined in the Setup — Ethernet view IPv4 address: The probe IPv4 Ethernet data/video interface IP address as defined by the user in the Setup —...
-
Page 49: Main - Cpu Usage
OTT info Channels: The number of enabled OTT channels. Profiles: The total number of profiles in the enabled OTT channels. At the very bottom of the Summary page, an overview of the Ethernet network interfaces on the VB220 are displayed. Network interfaces Interface: The ID of the selected network interface. -
Page 50: Main - Thumb Overview
display the historical maximum value for an averaging period of 10s and 60s respectively. To clear peak values click the Clear peaks button. 6.1.3 Main — Thumb overview The Thumb overview view displays a mosaic of all decoded thumbnails. By default the Normal mode is used. - Page 51 Freeze-frame status: If the probe has been licensed with the Content Extraction and Alarming option, status bulbs are displayed indicating the current freeze-frame and color-freeze status for the streams. White: Unknown (typically due to the VB220 being unable to decode video) Grey: freeze-frame detection is disabled.
-
Page 52: Main - Eii Graphing
6.1.4 Main — Eii graphing Eii is short for External Integration Interface and constitutes a set of XML files accessible through the probe web server interface for machine access to measurement data. Portions of the Eii interface are available in this view for simple trend graphing over arbitrary long time by the web browser. -
Page 53: Alarms
6.2 Alarms SNMP Alarms Alarm Lists Alarm Settings System Events and Scheduling FSM Settings FSM Measurements OTT Thresholds ETH Thresholds ETR Thresholds PID Thresholds Service Thresholds Demodulator Thresholds OTT Channel ETH Multicast ASI/QAM/QPSK/COFDM Stream OTT Analysis ETH Measurements ASI/QAM/QPSK/COFDM Measurements OTT Option ETR 290 Option Figure 6.1: Alarm handling in the Probe. -
Page 54: Alarms - All Alarms
traps to support third party management systems. Refer to Appendix: VB220 Versus VBC Alarms for a description of alarm handling in the VideoBRIDGE Controller. The Probe distinguishes between events and alarms. The ETR software module will always generate alarms and the Systems software module will always generate events. The Ethernet software module will by default generate events for errors that are resolved within 1 second, otherwise it will generate alarms. -
Page 55: Alarms - Alarm Setup
description can be viewed. The search field in the upper right corner of the view allows the user to type a text string and the alarm list is updated to display only streams and alarms matching the specified text. To update the offline alarm list click the Auto-refresh list button and then go back to the offline mode. The alarm lists can be deleted by clicking the Flush alarms button. - Page 56 The following alarms and events are configured: ETH (Ethernet) alarms No signal: There has been no UDP packet for Default: Enabled, the predefined period of time (de- severity Major fault 1sec) FEC packet drop: One or more RTP packets could not Default: Enabled, be corrected by the FEC severity Error...
- Page 57 Bitrate overflow: The net stream bitrate exceeds the Default: Enabled, maximum bitrate Ethernet threshold severity Error value specified by the operator. Bitrate underflow: The net stream bitrate goes be- Default: Enabled, low the minimum bitrate Ethernet severity Error threshold value specified by the op- erator.
- Page 58 NIT: Network Information Table error Default: Enabled, severity Major SI Rep Rate: Wrong repetition rate for SI tables Default: Enabled, severity Major Unref PID: PID is unreferenced Default: Enabled, severity Major SDT: Service Description Table error Default: Enabled, severity Major EIT: Event Information Table error Default: Enabled,...
- Page 59 Service checks: Service check error Default: Enabled, severity Major MIP: Megaframe Insertion Packet error Default: Enabled, severity Major Content: Content check error (checking of au- Default: Enabled, dio and video) severity Major Reference: Reference check error (comparing Default: Enabled, the stream with a Gold TS) severity Major Gold TS: Error found while comparing the...
- Page 60 Post BCH FER: DVB-T/T2 BCH Frame Error Rate Default: Enabled, exceeds specified threshold (VB252 severity Major in DVB-T mode) T2MI Errors in DVB-T2 Modulator Inter- Default: Enabled, face protocol analysis severity Major LDPC LDPC iteration count higher than Default: Enabled, threshold (VB252) severity Major Eb/N0...
- Page 61 Download bitrate too low: The download duration time ex- Default: Enabled, ceeds the OTT chunk duration time. severity Error Manifest size: The manifest file size exceeds the Default: Enabled, OTT manifest size threshold. severity Warning Actual bitrate: The actual measured bitrate does Default: Enabled, not match the profile bitrate speci- severity Warning...
-
Page 62: Alarms - Flash Alarms (Flash Option)
6.2.3 Alarms — Flash Alarms (FLASH option) The FLASH option enables the Flash alarms tab. This alarm list contains the last 20,000 alarms and keeps them in non-volatile memory so that they survive reboots and power-outages. This opens up a lot of possibilities for probes that cannot be reached while doing measurements and for probes that need to be powered down and consulted elsewhere. -
Page 63: Ott (Option)
6.3 OTT (Option) 6.3.1 OTT — Active testing The OTT option enables monitoring of up to 250 OTT channels. Up to 25 OTT engines (depends on license) can operate in parallel, and each engine licensed allows any channels to be analyzed. Each engine analyses channels in series and can be configured with any number of channels up to the maximum allowed by the license. - Page 64 Thumbnail decoding is available for non-encrypted HLS, HDS, DASH and RTMP channels, as well as some types of encrypted HLS channels. The following OTT information is displayed in the Active testing view: Status bulb: A bulb indicates the current status of the channel, i.e. the most severe profile status.
-
Page 65: Ott - Details
6.3.2 OTT — Details Click the blue information button on a channel to open the details window. This window provides detailed information about the status and alarms on all the profiles for the selected channel. The same pop-up can be opened from the Main — Thumb Overview view, see chapter 6.1.3 for more information. 6.3.2.1 OTT —... - Page 66 Profile status: The channel health bar displays the current status for individual channel profiles. Profiles are separated by vertical black lines. Colors indicate profile alarm status: • Green: OK • Yellow: Warning • Orange: Error • Red: Major • Black: Fatal Stream type: Channel and profile information is resolved from the manifest files.
-
Page 67: Ott - Details - Manifest
6.3.2.2 OTT — Details — Manifest The Manifest view shows health information on the overall manifest file for the channel as well as for the manifest files for the individual profiles. Channel: The channel name defined by the user and linked to a URL in the OTT — Channels view. - Page 68 Profile info: The type of stream is shown here. Apple HLS, Microsoft Smoothstream, Adobe HDS, MPEG DASH or SHOUTcast. Manifest size: The size in bytes of the main/top manifest file for the overall channel. Manifest file: Clickable URL for displaying the manifest file as text for the overall channel. Manifest URL: A clickable link to the current main/top manifest file for the overall channel.
-
Page 69: Ott - Details - Alarms
6.3.2.3 OTT — Details — Alarms The Details — Alarms view gives an at-a-glance overview of any active OTT alarms for the selected channel. An alarm log for the selected channel is also provided here. In the right corner of the pop-up window is a free text search field used to narrow down the entries in the alarm log. -
Page 70: Ott - Details - Thumbnails
6.3.2.4 OTT — Details — Thumbnails The Thumbnails tab will provide information about the current thumbnails in the channel. The quality of the content in the selected profile can be viewed in the thumbnail section, and the user may alter the selected profile in the drop down list. The section on the right hand side provides specific decoder and chunk information. -
Page 71: Ott - Details - Alignment
Chunk Information Engine ID: The OTT engine monitoring the selected channel. Channel ID: The ID of selected channel corresponding to the list of channels defined by the user. Profile ID: The ID of the selected profile. Bitrate: Bitrate rate of the a chunk. Streamtype: The type of the stream detected;... - Page 72 Chunk/Sequence Number: The chunk or sequence number for the current thumbnail. This is either signaled in the stream, or generated by the VB220. If the sequence numbers are highlighted in yellow, the thumbnails are not generated from the same chunk for all profiles, and may therefor appear to be out of synchronization.
-
Page 73: Ott - Latency
6.3.3 OTT — Latency The OTT Channel Latency Distribution feature makes it possible to measure the delay from when a chunk is available through different caches, compared to its origin. Before using this feature, you must set aside a number of OTT engines to exclusively measure the timings of one channel on one server. -
Page 74: Ott - Channels
6.3.4 OTT — Channels The OTT Channel Configuration list shows OTT channels configured by the user. To add a channel to the list click the Add new channel button. This will open the Edit channel pop-up view, allowing the user to define channel parameters. A channel entry can be selected by clicking the channel;... - Page 75 General Enabled: Check the ‘Enabled’ check box to start monitoring the OTT ser- vice. Select engine: A number between 1 and 25, depending on license activated, indicating which OTT engine the channel uses. Threshold: The OTT threshold that should be assigned to the OTT channel. OTT thresholds that have been defined in the OTT —...
- Page 76 Adv. manifest Enable adv. settings: Check this box to enable the advanced manifest settings. If unchecked, all settings on this page are ignored. Method: Determines which HTTP method to use when requesting the top-level mani- fest file. Supported methods are GET and POST. Content-Type: When requesting the manifest using the HTTP POST, use this Content-Type for the submitted request body.
-
Page 77: Ott - Settings
6.3.5 OTT — Settings The Settings tab makes it possible to change OTT global monitoring parameters. Press Apply to confirm changes made. Settings Round time: Sets the minimum round time of all of the OTT engines, in seconds (default: 15 seconds). If an engine finishes processing all its channels in less time than this, it waits until this amount of seconds has passed since it started the round before starting to process through its channels again. - Page 78 To add a threshold template to the list click the Add new threshold button. This will open the Edit threshold pop-up view, allowing the user to define threshold parameters. A threshold template entry can be selected by clicking the threshold template; the list entry will be highlighted. Several list entries can be selected by using regular Ctrl + click functionality.
-
Page 79: Multicasts
6.4 Multicasts 6.4.1 Multicasts — Parameters The Multicasts — Parameters view displays detailed information about each stream. The user selects which group of measurements should be displayed. Selections are IP parameters, TS parameters, Ethernet parameters, RTP and FEC parameters, User-defined parameters and Statistical parameters. - Page 80 Peak and aggregate measurements are cleared when the Clear counters or Clear counters all pages button is clicked. Clicking the Export button will allow export of the measurement data as an XML file that is opened in a new window. Click the Trim ch-list button to unjoin streams with current status ‘No signal’, thereby removing them from the list.
- Page 81 Joined multicasts Click the information icon to access the Detailed Monitoring pop-up view. Thumb: A thumbnail is displayed for each stream. Click the small thumbnail to view a larger image that is updated more frequently. Name: The stream name specified by the user in the Edit Multicast view Signal: Time since last signal loss Page:...
- Page 82 Max bitrate: The maximum current bitrate measurement IP packets: The number of IP packets received Dst address: Multicast/unicast destination address : port TOS: Type-Of-Service (also called Differentiated Services Field) TTL: Time-To-Live VLAN ID: Native VLAN ID of this stream Src address: Multicast/unicast source address : port Joined src: The source address of the originally joined multicast.
- Page 83 Min hole sep: Minimum number of RTP packets separating any holes. The sequence 1,2,3,10,11,12,15 gives a min hole sep of 3. Num holes: Number of packet loss sequences. The sequence 1,2,3,10,11,12,15 gives a num holes of 2. FEC mode: The CoP3 FEC mode FEC drops: Number of RTP packet drops in the main stream that the FEC could not correct C-FEC drops:...
- Page 84 Shown if no data is received for the stream. There should be a match between presenting this icon and a No-signal alarm; however since the alarm and thumbnail mechanisms work independently of each other they have been given different names (loss of signal and no signal).
- Page 85 Detailed Monitoring The Detailed Monitoring pop-up is activated by clicking a stream line in the monitoring list. The Probe is continuously gathering detailed information for the selected multicast. The VB220 will continue updating the detailed information for the selected multicast until another is selected. Clicking the Clear button will clear all information about the selected stream, including PSI/SI analysis data.
- Page 86 Directly beneath this list, the current parameters for the selected stream are displayed, as in the Joined multicasts list. In the Detailed Monitoring — IAT view the Inter Arrival Time histogram shows the accumulated number of IAT measurements within each presented interval. Vertical green lines indicate the maximum and minimum IAT values.
- Page 87 Thumb View The Thumb View pop-up is accessed by clicking an information icon in the Detailed Monitoring — Services view. This view presents a large thumbnail, as well as video and audio metadata for the selected stream, with an increased update rate compared to non-selected streams. Service audio level is indicated by one audio level bar per audio component.
- Page 88 The right-hand column will display the following detailed metadata: VB2xx GigE User’s Manual version 5.4...
- Page 89 Multicast Name: The name of the multicast containing the selected service, as defined by the user Type: The type of the stream containing the selected service; multicast or unicast Multicast address: The multicast address of the stream containing the selected service Multicast port: The port number of the multicast containing the selected service Transport stream ID:...
- Page 90 Pixel aspect ratio: The video pixel aspect ratio of the selected service, or “N/A” if no information is available Codec: The video encoding format of the selected service Quality: The video sampling format of the selected service Frame rate: The video frame rate of the selected service (Hz) Audio PID/Component PID/Component: The audio PID of the selected service for MPEG-TS services, or the audio...
-
Page 91: Multicasts - Parameters - Fields
6.4.2 Multicasts — Parameters — Fields The Multicasts — Parameters — Fields view enables selection of the parameters to be displayed in the Multicasts — Parameters view. Note that thumbnails must also be enabled in the Setup — Params view for thumbnail availability. 6.4.3 Multicasts —... - Page 92 The intention of this page, together with the alarm list, is to provide enough information for the operator to immediately see if there is anything seriously wrong with one or more Ethernet input streams. The overall status for the Full Service Monitoring (FSM) is also shown. Throughout this view the bulb colors indicate the most severe active alarm.
-
Page 93: Multicasts - History
6.4.4 Multicasts — History The probe keeps statistical Ethernet information for the last 4 days for visual inspection in the history timeline view. Each bar in the histogram corresponds to a number of events that occurred within a certain time interval. The interval that each bar represents depends on the scale, from 1 minute (when 90 min is selected) to 1 hour (when 4 days is selected). -
Page 94: Multicasts - Join
Tot bitr: Bitrate sensed on the eth0 interface Mon bitr: Bitrate on eth0 corresponding to joined multicasts CRC errs: Detected CRC errors. Ethernet CRC errors are most likely caused by a bad cable or a misconfigured router. A CRC error may impact packet loss measurements such as CC errors and RTP errors. -
Page 95: Multicasts - Streams
6.4.6 Multicasts — Streams In this view the operator can define multicasts available to the probe and associate a name with each multicast address. This name will be used by the probe when referring to the multicast. If no name has been defined the probe will use the multicast address:port notation. - Page 96 General Name: A name should be assigned to each unicast/multicast. The name will be used throughout the VB220 user interface when referring to this stream. It may also be used by an external management system like the VideoBRIDGE Controller. Address: The IP address of the unicast or multicast.
- Page 97 SSM source 1: If source specific multicasts (SSM) is enabled in the VB220 and a zero source address is specified for a multicast it will be joined using IGMP version 2 (i.e. without a source). This allows both source specific multicasts and non-source specific multicasts to co-exist in the same network and be joined by the VB220.
- Page 98 Select ETR engine: If the probe is licensed for several Ethernet ETR engines the user may select which engine should be used to analyze the stream. The default ETR engine selection is Ethernet1. It is also possible to use the Distribute ETR engines button described above to assign streams to engines.
- Page 99 Redundancy Has FEC: The stream carries COP3 (SMPTE 2022-5) Forward Error Correction. If enabled, statistics about FEC drops and correctible errors will be reported for the stream. First stream: For a Seamless Protection Switching (SMPTE 2022-7) protected stream, select the first of the two redundant RTP streams here. For other streams, (none) should be selected.
-
Page 100: Multicasts - Ethernet Thresh
6.4.7 Multicasts — Ethernet thresh. Thresholds are used to determine when to actually raise an alarm upon detection of an error. The Ethernet thresholds are used for generating Ethernet probe alarms as well as for calculating error-seconds. Error seconds and ETH probe alarms are issued whenever measurements exceed the defined threshold levels for a parameter. - Page 101 Ethernet thresholds Name: A text string that identifies the Ethernet threshold IAT:MLR error: This threshold contains error limits for IAT (Inter-packet Arrival Time) and MLR (Media Loss Rate). The IAT limit is the first parameter (before the colon), the MLR limit is the last parameter.
-
Page 102: Mw (Media Window)
PCR packets do not carry a valid CC field). The patented Sencore VideoBRIDGE Media Window presents both jitter and packet loss measurements in one graph, with jitter (IAT) values growing upwards (+ve Y) and packet loss (MLR) growing downwards... - Page 103 (-ve Y). Each sample along the x-axis corresponds to a measurement time-interval that depends on the range of the graph selected. Periods of no sync are also displayed in the graph. Error-second statistics for the graph-interval is displayed to the right. As the graphs are zoomed or scrolled the error-second statistics is updated as well as the graphs.
-
Page 104: Media Window - Selected Channel
6.5.1 Media Window — Selected channel The Media Window — selected channel view is activated by clicking a multicast label in the MW page. By clicking the pop-up button a pop-up window will appear, the user can have this separate window showing selected channel even when navigating away from the probe. -
Page 105: Media Window - Inter Arrival Time Graph
By clicking the BW:MLR button the graph displays the peak bandwidth as a function of time. The negative part of the composite graphs is still the packet loss (i.e. the MLR). If the stream contains a transport stream (mapping TS/x) the bitrate corresponds to the Multicasts parameter Net bitrate (i.e. -
Page 106: Rdp - Control
6.6.1 RDP — Control Click the icons in the Control tab to activate or de-activate an RDP engine. There are different icons for controlling RDP engines depending on whether they are configured to relay or record. The state of each RDP engine is restored after a reboot. -
Page 107: Rdp - Setup
6.6.2 RDP — Setup Each of the RDP engines is configured separately. First the Mode is selected. Depending on the mode either the Relay or Record settings needs to be configured. The Input selects the stream or interface to relay or record. These are the settings: Mode and Input Mode:... - Page 108 IPv4-address: The unicast address or multicast address to forward to. Multicast addresses are in the range 224.0.0.0 – 239.255.255.255. Port: The port to forward to. The combination of IP address and port fully describes the destination address. TTL: The Time-To-Live flagging of the relayed signal. The default value is 64. Timeout: The relaying period in minutes.
-
Page 109: Traffic
6.7 Traffic 6.7.1 Traffic — Protocols The Protocols view allows monitoring of IP traffic on the selected port in terms of the protocols used. The interface can be selected using the drop-down at the bottom of the page. Clicking the Clear statistics button will reset displayed values. - Page 110 Bitrate graph: Click the bitrate graph button to display a detailed bitrate graph for the specified protocol Frames Statistic: As above Frames/sec: Traffic speed for this protocol expressed in number of IP packets per second Frames: A graph displaying frames per second over time, displaying the last five minutes Frames graph: Click the frames graph button to display a detailed frames per second graph for the specified protocol...
-
Page 111: Traffic - Detect
6.7.2 Traffic — Detect The Traffic Detect view displays all UDP traffic sensed by the probe. Note that promiscuous network mode should be enabled in the Setup — Params view for the probe to detect all traffic, and not only multicasts already joined by the probe. -
Page 112: Traffic - Filter Statistics
Click the blue information icon to pop up the detailed stream info. Dst address: The multi- or unicast address Src address: The streams source address Name: The stream name, as defined in the Multicasts — Streams view. A generic name will be used for multi- or unicasts not defined by the user. - Page 113 RTP loss %: Percentage of time an average stream that matches the filter experiences RTP packet loss inside selected time period. Example: If the Last 1m period is selected and there are totally three streams caught by filter: • stream A: present for 60 seconds, 4 RTP error seconds •...
- Page 114 The detailed graph window displays up to 4 days of history. Trending Clicking the Trending last 60m button will present at-a glance trending graphs for each parameter for the last 60 minutes. Clicking a graph icon displays the corresponding detailed graph for the selected filter. Clicking the trend graphs itself will bring up the same detailed graph but will plot all the filters so that they can easily be compared.
-
Page 115: Traffic - Filter Setup
6.7.4 Traffic — Filter setup The Traffic — Filter setup view makes it possible to define stream filter requirements affecting the Traffic — Detect and Traffic — Filter statistics views. Ten filters can be defined and enabled by the user. Statfilter settings: Name: A text string defining the filter... - Page 116 VB2xx GigE User’s Manual version 5.4...
-
Page 117: Traffic - Microbitrate
6.7.5 Traffic — Microbitrate The Microbitrate feature allows sampling of bitrate at various sampling intervals. When enabling this feature, each Ethernet frame is timestamped in hardware on probe ingress. This timestamp is used to calculate exact bitrates at various sampling intervals. The Interval is the sampling interval of each bitrate calculation. -
Page 118: Ethernet
For multicast type traffic the traffic pattern will look more like the graph above. Here the bitrate is much more steady even for short intervals. The network never experiences near line-speed bursting since each stream is bitrate controlled by the sender. 6.8 Ethernet 6.8.1 Ethernet —... -
Page 119: Ethernet - Fsm - Monitor
6.8.1.1 Ethernet — FSM — Monitor The following parameters are continuously monitored for each service: Status: Red = active alarm, Green = no alarm Name: User defined service name Protocol: Type of protocol. HTTP or Ping IP address: IP address. Must be numeric, host name is not accepted Total number of valid checks Fail: Total number of invalid checks... -
Page 120: Ethernet - Fsm - Setup
6.8.1.2 Ethernet — FSM — Setup Each of the 10 FSM services may be defined or edited by clicking on the corresponding Edit button in the left hand table. The probe supports ping and generic HTTP-Get protocols for online status verification of arbitrary targets. After completing configuration of the selected service Apply changes must be pressed to save and apply the changes. - Page 121 These fields are common for both the ping and the HTTP-Get protocols: Enable: Enable by checking toggle button. Name: User-defined name of service Protocol: Select between ping and HTTP. Device: Ethernet interface to use for this service. Probe cycle: Time interval in seconds to wait between each activation. A value below 30 is not recommended.
-
Page 122: Ethernet - Fsm - Syslog
6.8.1.3 Ethernet — FSM — Syslog The VB220 has a built-in syslog server which captures all incoming messages (UDP, port 514). Messages are displayed in a pageable grid with the following columns: Facility, Severity, Timestamp, Hostname, Agent and Message. Currently displayed page can be exported as an XML-document. Since the syslog server typically stores about 100 pages of messages there is a group of buttons for a fast navigation: Newest... -
Page 123: Ethernet - Igmp
6.8.2 Ethernet — IGMP The IGMP view shows all IGMP (version 2 or 3) messages detected by the probe. This includes IGMP query messages sent by routers, IGMP reply messages sent by the probe itself and IGMP reply messages sent by other probes and devices on the same subnet. The live IGMP page can be paused by clicking the View list offline button. -
Page 124: Ethernet - Pcap
6.8.3 Ethernet — PCAP The VB220 can make PCAP recordings on the data interface of up to approximately 1 Gbyte (depending on the amount of free disk) based on simple user configurable filters. The PCAP format supports microsecond timing accuracy. Incoming traffic is recorded if it matches one or more of the enabled filters while outgoing traffic is always recorded. -
Page 125: Etr 290 (Option)
Disk free: Remaining disk size. Capture: The recorded capture. May be invalid if recording is still in progress. Start recording: Click to start a new recording. This will clear the current rec.pcap file. Stop recording: Click to stop the current recording. Sort recorded frames At high bitrates, some Ethernet frames may be recorded out of order as on packet time:... -
Page 126: Etr 290 - Etr Overview
6.9.1 ETR 290 — ETR Overview The ETR 290 — ETR Overview view will show ETR 290 status for ETR 290 monitored streams. ETR 290 monitoring may be enabled for Ethernet streams in the Multicasts — Streams — Edit view. The ASI input is always ETR 290 monitored unless the input is disabled, and streams received by the various RF cards are also ETR 290 monitored. -
Page 127: Etr 290 - Etr Details
The ETR 290 parameters are grouped into five different categories. The first three groups are defined in the ETSI TR 101 290 guidelines. The fourth category contains checks defined by Sencore allowing CA system checks, custom PID and service checks, content checks (checking the video for freeze-frames etc) and the Gold TS reference checks. - Page 128 If the Clear status button is clicked the error counts are reset and the ETR 290 analysis restarts. The details of the individual ETR 290 measurements are described in a separate document called Sencore VideoBRIDGE ETR 290 Details — Extended ETSI TR 101 290 Testing. Clicking the Show alarm graph button opens the Alarm graph pop-up view.
-
Page 129: Etr 290 - Pids
color representation. Periods of time when the stream has not been ETR monitored due to round-robin operation are represented by grey. By using the arrow buttons it is possible to view alarm occurrences up to 24 hours back in time even if the highest graph time resolution is selected. If alarms have occurred during the selected time period, the status timeline will not be all green. - Page 130 The name of the current stream is displayed in addition to the two round-robin indicator icons when relevant: the time cycle icon and the lock icon. By clicking the lock icon the round-robin cycling is stopped or resumed. A DVB or ATSC icon indicates the analysis mode. The analysis mode is defined as part of the ETR thresholds.
-
Page 131: Etr 290 - Services
6.9.4 ETR 290 — Services The ETR290 — Services view lists the services and service components of the current stream of the selected input. The name of the current stream is displayed in addition to the two round-robin indicator icons when relevant: the time cycle icon and the lock icon. - Page 132 PID: Service component PID value Type: Service and component encoding format Bitrate: Individual current bitrate of services and components When clicking a service, details about the service and service components will be displayed. If a PID is scrambled this is indicated in the service tree by the color green or blue (for even and odd scrambling respectively).
- Page 133 PCR PID: The service’s PCR PID ECM PIDs: The service’s ECM PID(s) and name of CA system(s). This information will only be displayed if ECM PIDs are signaled in the PMT table, usually only done when one or more service components are scrambled. Components: A list of the component PIDs and reference types.
- Page 134 Minimum bitrate: The minimum bitrate measurement for this component since the start of the monitoring period. (I.e. when the probe tuned to the frequency or when the monitoring of this frequency was restarted by the user clicking on ‘Clear status’ in the ‘ETR Overview’.) Maximum bitrate: The maximum bitrate measurement for this component since the start of the monitoring period.
-
Page 135: Etr 290 - Bitrates
6.9.5 ETR 290 — Bitrates This view shows a graphical representation of service and PID bitrates. The current bitrate is shown as the length of the light blue bar whereas the dark blue bar represents bitrate variation, spanning from minimum to maximum measured bitrate. The name of the current stream is displayed in addition to the two round-robin indicator icons when relevant: the time cycle icon and the lock icon. - Page 136 This view lists the PSI and SI or ATSC tables and table contents of the currently active stream of the selected input. The name of the current stream is displayed in addition to the two round-robin indicator icons when relevant: the time cycle icon and the lock icon. By clicking the lock icon the round-robin cycling is stopped or resumed.
- Page 137 The selected table entry is highlighted in the table dump. Note that values shown in the table list may not correspond directly to the highlighted hex dump byte(s), because some of the table entries do not add up to whole bytes. By hovering the cursor over the items in the tree a tooltip is displayed showing the start position of the data in the hexadecimal dump and the length of data.
-
Page 138: Etr 290 - Pcr
6.9.7 ETR 290 — PCR The PCR jitter histogram displays PCR jitter as measured by the probe. A list of detected PCR PIDs in the selected stream is shown together with their current and maximum PCR jitter values. A PCR PID is selected for histogram presentation by clicking the associated table entry. - Page 139 The name of the current stream is displayed in addition to the two round-robin indicator icons when relevant: the time cycle icon and the lock icon. By clicking the lock icon the round-robin cycling is stopped or resumed. The pushbuttons Zoom in and Zoom out enables rescaling of the graph. This makes it possible to view PCR jitter values that are outside the range defined by the auto-scaling.
-
Page 140: Etr 290 - T2Mi (Requires T2Mi-Opt)
6.9.8 ETR 290 — T2MI (requires T2MI-OPT) T2MI monitoring is a licensing option available for transport streams over ASI and Ethernet. T2MI is enabled on a per stream basis, most of the information is found in this GUI extracted from the L1 current packets in the T2MI streams. - Page 141 Crc Errors whole packet: The number of CRC errors calculated over the whole T2MI packet since the monitoring of the stream started. L1 information: T2 version: The version of the T2 spec used. Up to version 1.3.1 is supported including T2 lite.
- Page 142 Start RF idx: The starting RF index. Frame idx: The frame index. Sub slice interval: The interval between sub slices. Type 2 start: The value of the type 2 start parameter. Regen flag: The value of the regen flag. PLP (Physical Layer Pipes) information: Current PLP: The PLP currently being received.
- Page 143 Detailed PLP information: PLP: The ID of the signaled PLP. Type: The signaled type of the PLP. Data PLP Type 1 is the most common, some signals can have a common PLP as well as well as other PLP types. Payload: Payload type of this PLP.
-
Page 144: Etr 290 - Scte 35 (Requires Scte35-Opt)
Static padding: Says whether the padding is static or can change between each BB frame. PLP start: The start value for the PLP in the stream. PLP num blocks: The number of blocks used for this PLP. 6.9.9 ETR 290 — SCTE 35 (requires SCTE35-OPT) SCTE 35 is a specification which allows equipment to splice in local content at specific times, SCTE 35 is basically just the signaling mechanism the equipment uses to know when to switch from the master transmission to insert local content. - Page 145 Time since last event: The time since last SCTE 35 event specified in seconds, minutes, hours or days. If an ETR engine is monitoring a transport stream containing SCTE 35 information, the current stream will be added to the list in the SCTE 35 menu. By pressing the blue information button a new pop-up will show up, the pop-up will give specific information about events in the specified transport stream.
-
Page 146: Etr 290 - Status
6.9.10 ETR 290 — Status The ETR 290 — Status view shows a stream content overview linked to current alarms, making it easy to view what services and PIDs are currently affected by errors. By clicking any of the ‘view’, service or PID nodes, more information will be displayed on the right hand side of the table. -
Page 147: Etr 290 - Compare
6.9.11 ETR 290 — Compare The Compare view is based on analysis performed by the ETSI TR 101 290 engine and will only be visible if the probe is licensed with the ETR 290 option. The Compare view allows comparison of services or transport streams across different probe interfaces. Clicking Show streams results in a list of selectable transport streams and services, and clicking Show services results in a list of selectable services. - Page 148 column for each service/stream, and it is easy to recognize differences in signal contents or alarm status. The number of streams that can be compared depends on screen size. The compare column consists of several sub-views: Stream overview Stream overview shows a number of key parameters for the selected stream/service. Stream overview TS ID: The transport stream ID of the selected stream or the stream containing the selected...
- Page 149 Max. eff. bitr: The maximum effective bitrate (null packets removed) measured for the selected stream or the stream containing the selected service Min. tot. bitr: The minimum total bitrate (including null packets) measured for the selected stream or the stream containing the selected service Max.
- Page 150 If a service is selected for comparison this subview simply shows the selected service and any active alarms affecting the service. Services If a transport stream is selected for comparison the Services subview displays a list of services present in the stream. Clicking the plus icon at a service will expand the service tree, displaying the service’s individual components.
-
Page 151: Etr 290 - Etr Threshold
The ETR details subview shows the same alarm overview as the ETR 290 — ETR Details view. Clicking a check will open a pop-up view displaying alarm details. Please refer to the ETR 290 — ETR Details section of this user’s manual for a comprehensive description of this view. 6.9.12 ETR 290 —... - Page 152 • CMTS downlink • Analog carrier These predefined thresholds may be used when defining a monitoring configuration, but it is a good idea to create editable copies of these threshold templates and use these copies rather than the originals. Doing so will allow fine-tuning of parameters later on. There are two different ways of creating user-defined thresholds.
- Page 153 The ETR threshold template has the following settings: ETR Thresholds — Parameters: Name: A text field with the name of the ETR threshold template Description: Text field that should contain a meaningful description of the threshold Analysing Mode: The mode of table analysis. DVB or ATSC may be selected. Error timeout (s): The number of seconds an alarm stays active before it is cleared, if no new alarms are generated.
- Page 154 Tuning duration (s): The time (in seconds) the probe will stay tuned to a frequency/multicast during the round-robin loop. For setting the tuning duration, use the following expression: max_table_rep*2 + 10 Use the maximum table repetition, multiply it by 2 and then add 10 seconds. E.g.
- Page 155 PAT – Minimum The minimum number of services that must be present in the PAT. Set to number of services: 0 to disable this check. Default: 0 PAT – Allowed When this field is left blank all TS IDs are considered valid. If one or more Transport Stream IDs: TS IDs are specified (separated by commas or as a range) only these IDs are considered valid, and any other TS ID will trigger an alarm.
- Page 156 PCR Accuracy – Maximum The maximum allowed PCR jitter for PCR_AC measurements. Default: PCR_AC jitter (ns): 500 ns PCR Accuracy – Maximum The maximum allowed PCR jitter for PCR_OJ measurements. PCR_OJ jitter (ns): PCR_OJ measurement does not apply to IP streams. Default: 500 ns PTS: Enable or disable alarming of Presentation Time Stamp errors PTS –...
- Page 157 NIT – Satellite If set to ‘Required’ an alarm will be generated if a DVB-S Satellite descriptor (DVB-S): descriptor is not present in the NIT for the monitored frequency. Similarly if set to ‘Not allowed’, an alarm will be generated if the DVB-S Satellite descriptor is present.
- Page 158 SDT – Require If enabled an alarm will be generated if BAT is not present in the stream. BAT Presence: Default: Disabled EIT: Enable or disable alarming of Event Information Table errors. Only relevant when DVB mode is selected. EIT – Maximum The maximum allowed section repetition interval for the EIT Actual table.
- Page 159 MGT – Maximum The maximum allowed section repetition interval for the MGT table. interval (ms): Default: 150ms VCT: Enable or disable alarming of Virtual Channel Table errors. Only relevant when ATSC mode is selected. Require TVCT: Require presence of the Terrestrial Virtual Channel Table. Require CVCT: Require presence of the Cable Virtual Channel Table.
- Page 160 ETT: Enable or disable alarming of Extended Text Table errors. Only relevant when ATSC mode is selected. ETT – Maximum The maximum allowed section repetition interval for the ATSC ETT–0 interval ETT–0 (ms): table. Default: 2000ms ETT – Maximum The maximum allowed section repetition interval for the ATSC ETT–1 to interval ETT–1 to ETT–3 tables.
- Page 161 PID checks: Enable or disable alarming of PID presence errors, scrambling/clear requirements and PID type checks. The checks are set in the PID threshold template. Service minimum Enable or disable alarming of service minimum bitrate errors. Require- bitrate checks: ments are specified in the service threshold template associated with the stream.
- Page 162 Gold TS check – Do verification of the SDT actual table against the stored reference SDT Verify SDT actual table: actual table. Gold TS check – Do verification of the SDT other tables against the stored reference SDT Verify SDT other tables: other tables.
- Page 163 Signal to noise ratio check: If enabled an alarm will be raised provided that the SNR measured is below the threshold value associated with the stream. Only relevant for RF signals. Signal strength check: If enabled an alarm will be raised provided that the signal level measured is below the minimum signal strength threshold value or above the maximum signal strength threshold value associated with the stream.
-
Page 164: Etr 290 - Pid Thresholds
LDPC iteration count check : Enable or disable alarming when the LDPC iteration count needed to recover the signal is higher than the threshold set in the RF template. Only relevant for DVB-T2 RF signals. Input overflow check: If enabled an alarm will be raised provided input overflow is de- tected. - Page 165 Deleting a PID threshold template is done by highlighting the threshold template that should be removed and clicking Delete highlighted. Note that if the deleted threshold template was assigned to a stream being monitored, the new threshold for that stream will default to the predefined Default threshold template.
-
Page 166: Etr 290 - Service Thresh
Ignore CC: Select a scheduling template different from ‘Never’ for the probe to ignore CC errors for the specified PID or PID type. Ignore missing: Select a scheduling template different from ‘Never’ for the probe to ignore that the specified PID or PID type is signaled in PSI but missing in the stream. Ignore PCR: Select a scheduling template different from ‘Never’... - Page 167 There are two different ways of creating user-defined thresholds. To create a new threshold template from scratch the operator should click the Add new threshold group button. A pop-up window will appear allowing the user to assign a name and value to the new threshold and define the alarm conditions. Another way of creating a user-defined threshold template is by highlighting one of the templates already defined and then click the Duplicate selected button.
- Page 168 Require presence: If this field is checked an alarm will be raised provided that the specified service is not present in the stream. This check only requires that the service is present in the PAT, the other ETR checks will give alarms if there are other problems with the service, such as missing PMT or missing components.
-
Page 169: Etr 290 - Gold Ts Thresholds
Schedule: The Schedule drop-down menu allows the user to associate a scheduling scheme to a service, in effect masking alarms during selected intervals. Scheduling templates are defined in the Setup — Scheduling view. The predefined scheduling templates ‘Never’ and ‘Always’ will always be selectable, and these will result in service alarms never and always being masked, respectively. - Page 170 • And lots of misconfigurations in multiplexers To use the Gold TS reference functionality, first store away tables for a stream or a set of streams. Go to ETR 290 — Gold TS thr.. Here you can see the reference thresholds currently stored on the probe and they can be renamed or edited.
- Page 171 The reference check needs to be set to alarm if the Gold TS reference checking are to be performed. The settings are as follows: Also check version By default the version number and the original CRC of the tables are not number and CRC checked.
- Page 172 Verify SDT actual table When enabled the SDT table for the current stream will be checked. This allows the operator to catch changes is service and operator names, service types and the various descriptors, both DVB defined and private descriptors Verify SDT other tables When enabled the SDT tables for the other streams will be checked.
- Page 173 All the different tables and sections monitored are listed here. If there have been any changes to the tables the check will turn red and alarms be sent. When the ETR engine is tuned to a stream it is possible to compare the tables for this stream with the stored reference tables by clicking on the entry in the list.
-
Page 174: Asi
If the tables are inspected and the change found to be OK the operator can then go back to ETR 290 — Gold TS thr. and update the stored table set to the new version. 6.10 ASI The ASI will have status information and configuration settings for the built in ASI port. More information about the stream being monitored is found in the ETR 290 —... -
Page 175: Asi - Status
6.10.1 ASI — Status The ASI view displays an overview of the ASI input signal contents, in addition to listing the threshold templates currently assigned to the ASI signal. Additional ASI measurements are found in Compare and ETR 290 views. If an optional VB242 ASI interface module is present in the chassis, the ASI tab will be labeled ASI1 for the built-in ASI input port on the probe as shown here. -
Page 176: Asi - Setup
ASI status - ASI config info: Name: The name of the ASI transport stream as defined in the ASI — Setup view ETR thresholds: The name of the ETR threshold template assigned to the ASI transport stream PID thresholds: The name of the PID threshold template assigned to the ASI transport stream Service thresholds: The name of the Service threshold template assigned to the ASI transport stream... -
Page 177: Asi (Vb242 Option For Vb220)
Extract thumbnails: When enabled, the probe will generate thumbnails for this tuning whenever tuned to it. If not, they can be generated manually by opening the thumbnail pop-up from the Main — Thumb overview and ETR 290 — Services views. In order to enable this option, extract thumbnails also has to be enabled in the Setup —... -
Page 178: Cofdm (Vb252 Option Module For Vb220)
VB220 VB220 ASI1 ASI1 ASI2 ASI2 ASI3 ASI3 ASI4 ASI4 ASI5 ASI5 VB242 VB242 ASI6 ASI6 ASI1 ASI1 ASI2 ASI2 ASI3 ASI3 ASI4 ASI4 ASI5 ASI5 VB242 VB242 ASI6 ASI6 The figure above illustrates signal routing for two VB242 modules in one chassis, for continuous monitoring mode and round-robin mode respectively. -
Page 179: Cofdm - Status
6.12.1 COFDM — Status (Constellation diagram requires The Advanced RF Option.) The COFDM — Status view gives an overview of the key input interface parameters. The COFDM status view displays the following information: DVB-T/T2 status - Stream info: Packet length: Indicates if the transport stream packets are 188 or 204 bytes Original network ID: The original network ID as specified in the NIT table... - Page 180 Level: This is a measure of the stream signal power. It is expressed according to the level mode selection made in the Setup — ETR view: dBm: in decibels relative to a reference value of 1mW. dB V: in decibels relative to a reference value of 1 V dBmV: in decibels relative to a reference value of 1mV Signal to noise ratio: The signal to noise ratio in dB...
- Page 181 DVB-T L1 Information Mode: The OFDM mode (DFT size). Possible OFDM modes are 2K and 8K The guard interval. The guard interval may be 1/4, 1/8, 1/16 or 1/32 Constellation: Modulation constellation. Constellation may be QPSK, 16-QAM or 64-QAM Hierarchy: DVB-T hierarchy can have the values ‘None’, 1, 2 or 4.
- Page 182 DVB-T2 L1 Pre Information T2 Version: DVB-T2 Version: 1.1.1 1.2.1 1.3.1 Post scrambling: Informs if L1-Post scrambling is enabled, supported from DVB-T2 v1.3.1 ‘True’ or ‘false’. DVB-T2 profile: Determines current profile of DVB-T2 Signal: Base Lite (supported form DVB-T2 v1.3.1) Base compatible with Lite: Indicates if the DVB-T2 Base Profile is compatible with DVB-T2 Lite profile.
- Page 183 S2 Signaling. P1 S2 0 – DVB-T2 2K mode with any guard. 2 – DVB-T2 8K mode with DVB-T guard. 4 – DVB-T2 4K mode with any guard. 6 – DVB-T2 1K mode with any guard. 8 – DVB-T2 16K mode with any guard. 10 –...
- Page 184 DVB-T2 L1 PLP Information: The PLP (Physical Layer Pipe) Id. Type: The type of the PLP. ‘Common type’, ‘Data 1’, ‘Data 2’. Group id: The group of PLPs that this PLP belongs to. Constellation: The constellation of the current PLP. ‘QPSK’, ‘16-QAM’, ‘64-QAM’, ‘256- QAM’.
-
Page 185: Cofdm - Tuning Setup
FEF interval: The number of T2-Frames between two FEF (Future Extension Frames) parts. 6.12.2 COFDM — Tuning setup In this view the operator can define frequencies that will be used by the RF demodulator for tuning. A name is associated with each tuning configuration, and this name will be used by the probe when referring to the stream. - Page 186 When one set of tuning parameters has been defined it is possible to click the button Import from NIT in order to have the other frequencies automatically added to the list, as defined in the Network Information Table(s) analyzed by the probe. Default values will be assigned to parameters that are not part of the NIT. The following parameters are defined for each tuning entry: DVB-T/T2 —...
- Page 187 Multi-edit functionality makes it possible to edit several threshold templates simultaneously. Highlight the tuning list entries that should be edited and click the Edit selected button. Note that all tunings will automatically be ETR 290 analyzed, and hence be part of the round-robin loop unless the ‘Enable tuning’...
-
Page 188: Cofdm - Cofdm Threshold
6.12.3 COFDM — COFDM threshold The probe will raise an alarm if one of the threshold settings associated with a tuning is violated. Note that this alarm may be disabled in the ETR 290 — ETR thr. — Edit view (Input interface checks). In the threshold template list the ‘Refs’... - Page 189 The DVB-T/T2 threshold parameters are: DVB-T/T2 threshold — Edit: Name: A text field describing the threshold template Maximum pre Viterbi/LDPC BER: Threshold level for bit error ratio before Viterbi or LDPC error correction Maximum pre RS/BCH BER: Threshold level for bit error ratio before Reed-Solomon or BCH error correction Maximum post BCH FER: Threshold level for bit error ratio after BCH error correction...
-
Page 190: Cofdm - Impulse Response (Requires Advanced Rf Option)
Time min: The minimum time an impulse should occur after the main impulse Time max: The maximum time an impulse should occur after the main impulse Power min: The minimum power of an impulse compared to the main impulse (in dB) Power max: The maximum power of an impulse compared to the main impulse (in dB) 6.12.4 COFDM —... -
Page 191: Cofdm - Rf Overview
become visible in the graph as highlighted boxes defining minimum and maximum values for impulse time and power for each enabled impulse. Threshold templates are defined in the COFDM — COFDM threshold view. A DVB-T/T2 threshold template is assigned to a DVB-T/T2 stream in the COFDM — Tuning setup view. -
Page 192: Isdbt (Vb256 Option Module For Vb220)
Max LDPC: The maximum Low-density parity-check (LDPC) iteration counter value (only for DVB-T2) 6.13 ISDBT (VB256 Option Module for VB220) The ISDBT tab will be present in the graphical user interface provided that the probe chassis is equipped with an optional ISDBT demodulator module. The VB256 has two RF inputs per module. Each ISDBT tab represents an independent RF input. - Page 193 Packet length: Indicates if the transport stream packets are 188 or 204 bytes Original network ID: The original network ID as specified in the NIT table Network ID: The network ID as specified in the NIT table Transport stream ID: The transport stream ID as specified in the PAT table Total bitrate: Total transport stream bitrate including null packets (PID 8191)
-
Page 194: Isdbt - Tuning Setup
Service thresholds: The name of the Service threshold template assigned to the current fre- quency VBC thresholds: The name of the VBC threshold template assigned to the current frequency Please note: If the signal power is stronger than -10 dBm there will be a warning shown by GUI. This is to warn a user to apply some attenuation on the input to protect the analog front end on the VB256. - Page 195 The following parameters are defined for each tuning entry: ISDB-T — Tuning setup — Edit: Name: A name should be assigned to each tuning configuration. Frequency: The channel center frequency in MHz. Channel spacing: The channel spacing in MHz ETR thresholds: Selection of the ETR threshold template that should be assigned to the current frequency PID thresholds:...
-
Page 196: Isdbt - Isdb-T Threshold
Enable tuning: If this box is checked the transport stream associated with the current fre- quency will be monitored It is also possible to add new frequencies manually by copying existing tuning list entries using the Duplicate highlighted button. Multi-edit functionality makes it possible to edit several threshold templates simultaneously. Highlight the tuning list entries that should be edited and click the Edit selected button. - Page 197 The ISDB-T threshold parameters are: ISDB-T threshold — Edit: Name: A text field describing the threshold template Maximum pre Viterbi/LDPC BER: Threshold level for bit error ratio before Viterbi or LDPC error correction Maximum pre RS/BCH BER: Threshold level for bit error ratio before Reed-Solomon or BCH error correction Maximum post BCH FER: Threshold level for bit error ratio after BCH error correction...
-
Page 198: Qam/Vsb/Rf (Vb262 Option For Vb220)
Maximum frequency offset: Threshold level for maximum center frequency offset Frequency offset zero adjust: Allows to define calibration adjustment for frequency offset Maximum LDPC iterations: Threshold level for Low-density parity-check iteration counter (only for DVB-T2) 6.14 QAM/VSB/RF (VB262 Option for VB220) For the VB220 the QAM, VSB or RF tab will only be present in the graphical user interface provided that the probe chassis is equipped with an optional QAM/VSB (VB262) demodulator module. - Page 199 QAM status - Stream info: Packet length: Indicates if the transport stream packets are 188 or 204 bytes Original network ID: The original network ID as specified in the NIT table Network ID: The network ID as specified in the NIT table Transport stream ID: The transport stream ID as specified in the PAT table Total bitrate:...
-
Page 200: Qam - Tuning Setup
PID thresholds: The name of the PID threshold template assigned to the current frequency Service thresholds: The name of the Service threshold template assigned to the current frequency VBC thresholds: The name of the VBC threshold template assigned to the current frequency Spectrum inversion: Indicates whether the spectrum is inverted or not The constellation diagram displays the received symbols with respect to phase and amplitude. - Page 201 When one set of tuning parameters has been defined it is possible to click the button Import from NIT in order to have the other frequencies automatically added to the list, as defined in the Network Information Table analyzed by the probe. Default values will be assigned to parameters that are not a part of the NIT. Please refer to the QAM —...
- Page 202 QAM - Tuning setup: Name: A name should be assigned to each frequency channel Frequency: The QAM tuning frequency in MHz Mode: The QAM modulation mode. Selectable modulation modes are DVB-C, QAM- B, 8VSB, 16VSB and ANALOG. Channel spacing: The QAM channel spacing. Selectable spacing values are 6MHz, 7MHz and 8MHz.
-
Page 203: Qam - Qam Threshold
6.14.3 QAM — QAM Threshold If a probe measurement is not in accordance with predefined threshold values, an alarm will be raised. Note that this alarm may be disabled in the ETR 290 — ETR thr. — Edit view (Input interface checks). In the RF threshold list the ‘Refs’... - Page 204 Name: A text field describing the threshold template Maximum pre FEC BER: Threshold level for bit error ratio before forward error correction Maximum post FEC BER: Threshold level for bit error ratio after forward error correction Maximum MER: Threshold level for modulation error ratio (dB) Minimum signal to noise ratio: Threshold level for signal to noise ratio (dB) Minimum signal strength:...
-
Page 205: Qam - Rf Overview
Using the ‘Create RF threshold’ drop-down menu select whether one common threshold template should be used for all streams, or if individual threshold templates should be created. Using the ‘Threshold policy’ drop-down menu select the acceptable deviation from reference measurements. When ‘Custom’ is selected the user specifies acceptable deviations for all parameters that constitute the QAM threshold template, except Pre and Post FEC BER, for which the thresholds are fixed values not related to measurements. -
Page 206: Sat (Vb272 Option For Vb220)
Modulation: The QAM modulation mode: 16, 32, 64, 128 or 256 QAM. Mode: The QAM transmission mode: DVB-C (Annex A), QAM-B (Annex B) or 8VSB TS sync: Transport stream sync: yes or no Min level: The minimum RF signal level Max level: The maximum RF signal level Min SNR:... -
Page 207: Sat - Status
6.15.1 SAT — Status The SAT — Status view gives an overview of the key input interface parameters. The SAT status view displays the following information: SAT status - Stream info: Stream type: Indicates transmission system: DVB-S or DVB-S2 Packet length: Indicates if the transport stream packets are 188 or 204 bytes Original network ID: The original network ID as specified in the NIT table... - Page 208 Front-end lock: A “bulb” indicating front end lock when green, red indicates no lock Level: This is a measure of the stream signal power. It is expressed according to the level mode selection made in the Setup — ETR view: dBm: in decibels relative to a reference value of 1mW dB V: in decibels relative to a reference value of 1 V dBmV: in decibels relative to a reference value of 1mV...
- Page 209 Pilot detection: Indicates if pilot detection is Enabled or Disabled – applies only to DVB-S2 Frame length: Indicates frame length – one of the following: “NORMAL FRAME – 64800 bits” or “SHORT FRAME – 16200 bits” – applies only to DVB-S2 SAT status - SAT requested tuning info: Setup name: A name should be assigned to each frequency channel...
-
Page 210: Sat - Tuning Setup
6.15.2 SAT — Tuning setup In this view the operator can define frequencies that will be used by the SAT demodulator for tuning. A name is associated with each frequency, and this name will be used by the probe when referring to the stream. - Page 211 When one set of tuning parameters has been defined it is possible to click the button Import from NIT in order to have the other frequencies automatically added to the list, as defined in the Network Information Table analyzed by the probe. Default values will be assigned to parameters that are not a part of the NIT. Clicking the Import from NIT button will open the NIT Import pop-up view.
- Page 212 PL scrambling code: The PL scrambling code: 0–262141 – applies only to DVB-S2 ETR thresholds: Selection of the ETR threshold template that should be assigned to the current frequency PID thresholds: Selection of the PID threshold template that should be assigned to the current frequency Service thresholds: Selection of the Service threshold template that should be assigned to...
-
Page 213: Sat - Frequency Scan
6.15.3 SAT — Frequency scan As opposed to a satellite scan, which scans according to pre-set transponder values it’s purpose is to find transponders on a particular satellite without any scanning rules. It “blindly” scans every possible horizontal and vertical satellite frequency and symbol rate. It means that the tuner will do an automatic scan of the incoming satellite signal in small steps for active symbol rates to determine if there are any live transponder signals. -
Page 214: Sat - Sat Threshold
DiSEqC: The satellite front-end module supports DiSEqC 1.2 signaling. The operator can enable a particular DiSEqC message to be transmitted towards the antenna for each frequency defined in the tuning setup typically used to control L-band switches. Specifically, the message sent has the format (0xE0 0x10 0x38 N), where N is a byte configurable by the user to be between 0x00 and 0x0f. - Page 215 The SAT threshold parameters are: SAT Threshold - Edit: Name: A text field describing the threshold template Pre Viterbi BER: Threshold level for bit error ratio before forward error correction (Viterbi) – only for DVB-S Post Viterbi/LDPC-BCH: Threshold level for bit error ratio after forward error correction Minimum SNR: Threshold level for minimum signal to noise ratio (dB) Minimum...
-
Page 216: Sat - Rf Overview
Maximum symbol rate offset: Threshold level for maximum symbol rate offset (sym/s) Symbol rate zero adjust: Allows to define calibration adjustment for symbol rate offset (sym/s) 6.15.5 SAT — RF overview The RF parameters and measurements list gives a status overview of all monitored SAT frequencies from the selected RF input. -
Page 217: Sat Tuning Setup
The redundancy switch needs two identical signals delivered over two different mediums, that will have to be connected into each IF input. Each IF input will have to be tuned into the same transponder for the redundancy switch to work properly. The 70 MHz IF signals on input #1 and input #2 are up-converted to L-Band at the fixed frequency 1094 MHz. -
Page 218: Threshold Setup
DiSEqC: The satellite front-end module supports DiSEqC 1.2 signaling. The oper- ator can enable a particular DiSEqC message to be transmitted towards the antenna for each frequency defined in the tuning setup typically used to control L-band switches. Specifically, the message sent has the format ( 0xE0 0x10 0x39 N ), where N is a byte configurable by the user to be between 0x00 and 0x0f. - Page 219 VB2xx GigE User’s Manual version 5.4...
-
Page 220: Redundancy Status And Overview
6.16.4 Redundancy status and overview The Redundancy tab GUI will provide a simple overview of the status on both input signals, which ETR alarms and redundancy options that is enabled, and which redundancy mode is enabled. 6.16.5 Redundancy modes The probe has three different redundancy modes giving the operator different levels of control. When a physical button is pushed the GUI will be overridden. -
Page 221: Status For Input
6.16.6 Status for input Each input may have different status, thresholds and redundancy rules defined. Both of the inputs will have a dedicated area in the Redundancy tab. ETR parameters is listed with colors and shapes depending on the status. Input status: A square with solid color means that the input signal has both alarming and redun- dancy enabled on a PID/service. -
Page 222: Setup
6.17 Setup 6.17.1 Setup — Params The Setup — Params view contains the following settings: Various Probe name: Each probe can be assigned a user defined name. The name is shown in the Main — Summary view, which is the probe default page, as well as in the browser’s title line. - Page 223 Treat Ethernet events as alarms: When enabled each event is treated as an alarm that is active for 5 seconds. This may be useful when reporting to external systems that do not support events but only active or cleared alarms. This setting affects the local alarm list and SNMP traps. Network settings Promiscuous network mode: The probe will only be able to detect additional multicasts if the...
-
Page 224: Setup
TOT time zone: The local time zone to be used when TOT is selected as clock reference source. This is a three letter country code that should match a country code present in the received TOT. Note that this parameter is case sensitive. If the TOT time zone field is left blank the first time zone specified in the TOT will be used, and this time zone will also be used if the probe is unable to find the specified country code in the TOT. -
Page 225: Setup - Colors (Requires Extract-Opt)
6.17.3 Setup — Colors (requires EXTRACT-OPT) The Setup — Colors view allows the user to define colors that should be recognized if a color-freeze condition should occur. A mono-colored freeze frame condition may in some cases indicate what equipment is failing, resulting in the color-freeze. A freeze color is defined by clicking the Add new color button and assigning an RGB value to a name. -
Page 226: Setup - Time
6.17.4 Setup — Time The time of the probe is used to timestamp events in the alarm list. The local time is always presented just below the alarm list. The probe time should not be set manually if the probe is synchronizing against a time server (refer to the Setup —... - Page 227 The 10/100/1000 BASE-T management port corresponding to eth1 is located at the front of the probe and is labeled Management. For the data/video port, the user can choose between eth0, which is the electrical 10/100/1000 BASE-T Ethernet port labeled 10/100/1000T, or eth2, which is the optical gigabit SFP port labeled SFP.
-
Page 228: Setup - Ethernet - Ipv6 Settings
Auto-negotiation Check the box to actively attach to the network. Uncheck auto-negotiation if the SFP port is used to attach passively to a fiber tap. Enable management: If enabled a web server will be started on eth2 next time the probe boots. IP settings –... - Page 229 IPv6 address: If IPv6 auto-configuration is not enabled, this field is used to define the IPv6 address of the probe. IPv6 prefix: If IPv6 auto-configuration is not enabled, this field is used to define the IPv6 prefix of the probe (corresponding to netmask for IPv4). IPv6 Gateway: Required to allow clients with an address outside the probe subnets to access the probe (HTTP, FTP, SSH, TELNET, SNMP).
-
Page 230: Example 1 - Separate Management Ipv4
IPv6 Gateway: Required to allow clients with an address outside the probe subnets to access the probe (HTTP, FTP, SSH, TELNET, SNMP). It is also required for the probe to access an NTP server or DNS server with IPv6 address outside the probe’s subnets. -
Page 231: Example 3 - Mixed Mode Ipv4
Enable Only run web server on the data/video inter- management face Gateway — 10.0.30.1 The default gateway is required for the probe to connect to devices that are not on the same subnet 6.17.5.4 Example 3 – Mixed Mode IPv4 This model is similar to the separate management model with the difference that a web server is also run on the data/video management. -
Page 232: Setup - Vbc
The VLAN interface can be used to monitor OTT traffic – also if it is associated with the management interface. Multicasts can be joined from any of the VLANs, as long as the VLAN belongs to one of the two physical data interfaces. The VLAN interfaces are not available for serving the web interfaces. Edit VLANs Enable: Once enabled the virtual interfaces are created and available. -
Page 233: Setup - Login
6.17.8 Setup — Login By default, there is no access control and all users have access to all features. Access control can be enabled for the VB220, restricting users to read-only access until they log in. Any user can enable access control, but only users who are logged in can disable it or change the password. -
Page 234: Access Control Lists
Note that when logged in from the VBC, the VBC user’s access rights apply. 6.17.8.1 Access Control Lists The probe user interface can be protected by a firewall. The firewall is manipulated from the Access Control List (ACL) page. This page is available by clicking the “Access control lists. . . ” button in the Setup —... -
Page 235: Setup - Etr
We recommend testing the effect of enabling the firewall by clicking the “Test ACL for 30 seconds” button first. Any surprises, such as unintentionally being blocked by the firewall and losing connection to the probe, are then detected before the setting becomes permanent. To disable the firewall using a serial port connection, log in as the admin user. - Page 236 The default value for private descriptors is ‘Disabled’. To change this value, select a new descriptor interpretation from the drop-down menu and click the Apply changes button. ETR 290 tuning control By default authorized users will be allowed to lock the ETR 290 analysis to one stream for an infinite length of time and unauthorized users will not be allowed to lock the analysis.
- Page 237 VB242 ASI mode The user may select whether two inputs of an ASI input module should be permanently monitored, or if up to six inputs should be monitored sequentially in round-robin mode. ETR details The user selects if service names should be displayed in the ETR 290 — ETR Details view. Note that a large screen size is required for proper service name displaying.
-
Page 238: Setup - Vbc Thresh
6.17.10 Setup — VBC thresh. The VBC error second thresholds are used by the VideoBRIDGE Controller to issue VBC specific alarms. The VBC will raise an alarm when the number of error seconds exceeds the error seconds threshold. The VBC thresholds are only relevant when a VideoBRIDGE Controller is part of the monitoring system. The reason for using error second thresholds is to avoid alarms that toggle on and off, which for a large monitoring system might otherwise lead to an unintelligible user interface. - Page 239 VBC thresholds Name: The name of the VBC threshold template No signal: Number of seconds with ‘No signal’ RTP error: Number of seconds with RTP packet drops. This measurement will be zero unless the stream is encapsulated in RTP headers MLR error: Number of seconds with packet drops in the TS layer (seconds when media loss rate is non-zero).
-
Page 240: Setup - Scheduling
ETR Pri 1 errors: Number of seconds with ETSI TR 101 290 Priority 1 alarms before a VBC alarm is generated ETR Pri 2 errors: Number of seconds with ETSI TR 101 290 Priority 2 alarms before a VBC alarm is generated ETR Pri 3 errors: Number of seconds with ETSI TR 101 290 Priority 3 alarms before a VBC alarm is generated... -
Page 241: Setup - Routing
specified for each day using comma separation. To edit an existing scheduling template, highlight it and click the Edit selected button. To delete a template, highlight it and click the Delete selected button. When a scheduling template has been modified, click the Apply changes button. Defined scheduling templates become available as selections in the ETR 290 —... -
Page 242: Setup - Security
Note: When monitoring both multicast (UDP) and OTT (TCP) traffic, we recommend using different network interfaces. Mixing the two traffic types on the same network can have unwanted impact on the monitored signals. Routing setup Default This setting determines the default interface, and is configured through the Setup —... - Page 243 outside the Ethernet interface’s subnet. For security reasons the login will expire two minutes after accessing this section. The default user name and password to enter this view is admin and elvis. The password is changed by entering a new password and clicking the Apply changes button. This password also applies for the admin user when logging in over USB or ssh as described in chapter 4.11.2, as well as for software upload using ftp as described in appendix E.
-
Page 244: Data
Please note that any modifications to the routing table that is made in this dialog will be lost when the probe is rebooted. 6.18 Data 6.18.1 Data — Configuration VB2xx GigE User’s Manual version 5.4... -
Page 245: Data - Software
Full and partial configuration of the Probe can be exported as XML documents. This is achieved by clicking one of the links inside the Export XML frame. A new browser window pops up containing the selected XML document. The browser will allow the contents of the page to be saved to file. Restoring the Probe configuration, multicast stream list or OTT channel list is just as simple. - Page 246 A more detailed description on the software update procedure can be found in E Appendix: Software Upload Upgrading to a new major release requires a valid software maintenance license, please refer to D Appendix: Software Maintenance for more details. If the current software maintenance license does not cover the uploaded software version, the upgrade will be aborted and the current version is kept.
-
Page 247: Data - Table Descriptors
Contact Sencore for more information about private descriptors. 6.18.4 Data — Eii The External integration interface (Eii) allows inclusion of Sencore VideoBRIDGE equipment into 3rd party NMS systems. In order to facilitate integration the Data — Eii view allows export of XML files containing the data typically being requested by an NMS system via the regular Eii interface. -
Page 248: Data - Storage (Flash Option)
6.18.5 Data — Storage (FLASH option) The FLASH option allows a 32GB flash card to be used for storing recordings offline. RDP recordings are automatically stored, and PCAP recordings can also be stored in flash. VB2xx GigE User’s Manual version 5.4... -
Page 249: About
6.19 About 6.19.1 About — Release info This view shows the software version, the software build date and the hardware type of the Probe. VB2xx GigE User’s Manual version 5.4... -
Page 250: About - License
6.19.2 About — License This view shows the available Probe options and current VB220 license and software maintenance details. By clicking the blue information icon associated with each option it is possible to view option details. It is also possible to export the license and software maintenance keys in XML format from this page. These keys can be imported using the Data —... -
Page 251: About - Technologies
6.19.3 About — Technologies The Technologies view lists some of the technologies available in the Sencore VideoBRIDGE product family. 6.19.4 About — Credits This view shows information about the software included with the Probe. VB2xx GigE User’s Manual version 5.4... -
Page 252: A Appendix: Vb220 Versus Vbc Alarms
A Appendix: VB220 Versus VBC Alarms The VB220 Probe alarms are independent of the VideoBRIDGE Controller alarms. The Probe has been designed to yield instantaneous alarms based on the current measurements. This typically results in lots of short-lived alarms that would be “too much” for the VBC to report, as the VBC may control a large number of Probes. -
Page 253: B Appendix: Monitoring Practices
B Appendix: Monitoring Practices This Appendix summarizes a few useful monitoring practices. B.1 RTP Monitoring When running video inside an RTP wrapper it is possible to exactly deduce the number of dropped IP frames due to network issues. This is possible as a result of the 16-bit sequence counter inside the RTP header. - Page 254 Imagine the following MPEG-2 Transport Stream being generated by an encoder. The TS contains two PIDs (50 and 51) and the Continuity Counter (CC) values are continuous for each PID since there are no packets missing. PID: 50 PID: 51 PID: 50 PID: 51 PID: 50...
-
Page 255: Strategy For Mediawindow Analysis
B.3 Strategy for MediaWindow Analysis This section provides further insight into MediaWindow analysis and suggests how the Ethernet threshold settings can be configured to maximize the usefulness of the MediaWindow graphs and alarms. The MLR value is always calculated using the continuity counter inside the transport stream packets. Since the continuity counter is expected to increase by one for each packet of the same PID it is possible to detect missing TS packets by noting gaps in the continuity counters. -
Page 256: Iat Before And After Router
B.3.1 IAT Before and After Router Packet-loss that occurs before or inside a router will usually not be visible since the queuing mechanism at the outgoing interface of the router will send out packets in an orderly fashion. If however the packet-loss did occur after the router (due to line noise for example) thus affect the timing between two neighboring packets –... -
Page 257: Identifying Udp Packet Loss
For VBR streams a similar packet-loss will not necessarily affect the IAT graph even if the time between two neighboring packets doubles. The pink line represents the IAT and MLR value measured for the missing packet. B.3.2 Identifying UDP Packet Loss This discussion does not apply to streams with TS/RTP mapping since in that case identifying UDP packet loss is straight forward. -
Page 258: Multicast Thresholds
As we have seen, there is no sure way to distinguish between UDP packet-loss and loss in the underlying TS packets. One way to deal with the situation is to have a probe doing zero readings close to the signal source before the network can introduce UDP packet loss. -
Page 259: Ott Bandwidth Requirements
B.7 OTT Bandwidth requirements The recommended available bandwidth for full coverage OTT monitoring is equal to the sum of the profile bitrates monitored plus an estimated overhead of 20 % for manifests and IP, TCP and HTTP headers. Note: The OTT engines will be using all available bandwidth on the interface in spikes while downloading the chunks, this is the main reason why it is not a good idea to mix multicasts on the same interface, as it can cause packet drops which multicasts cannot handle. -
Page 260: C Appendix: Ott Profile Health
C Appendix: OTT Profile Health C.1 OTT Profile Health Bar The profile health bar displayed at channel level shows an overview of current status for individual channel profiles. Different colors indicate status: • Green: OK • Yellow: Warning • Orange: Error •... -
Page 261: Ott Profile Health Timeline
C.2 OTT Profile Health Timeline The OTT profile health timeline shows information about channel bitrate and channel alarm status for the last two hours, with a time resolution of one minute. Green parts of the timeline indicate profile download time versus chunk length. The graph is scaled so that 100% indicates a chunk download time identical to chunk length (in seconds), chunk length being signaled in the profile manifest. -
Page 262: D Appendix: Software Maintenance
D Appendix: Software Maintenance Purchasing yearly software maintenance enables future feature protection and guarantees access to the latest software for the Probe. The software maintenance can be purchased for a two or four year period, typically purchased together with the system itself, during which new major releases can be installed. The current software maintenance period is displayed in the About —... -
Page 263: E Appendix: Software Upload
E Appendix: Software Upload The process of performing a software upload to the probe involves the following steps: 1. Obtain the software image. 2. Export and save the probe configuration. 3. Delete any existing probe stream recordings. 4. Transfer the image to the probe using the software upload functionality in the Data — Software view or by using ftp, and save the image to flash. -
Page 264: Delete Any Existing Probe Stream Recordings
E.3 Delete any existing probe stream recordings If any stream recordings is stored on the probe, this may prevent software upgrade, as there might not be enough internal disk space available for the software image upload to be possible. Therefore delete any recordings prior to software upload –... - Page 265 Note that the probe will reboot when the new software is successfully stored in flash, and the probe will be unresponsive until reboot has completed. Using ftp and telnet/ssh Step 1, alternative A: Using Windows Explorer Open a Windows Explorer window. Click the address field and type (replace ftp://10.0.20.101 10.0.20.101 with the probe’s IP address) and hit...
- Page 266 ftp> put vb330-5.2.0-10.tea ftp> Step 2: Initiate the save to flash using telnet or ssh The image, which is now stored on the probe’s RAM-disk, needs to be saved to flash. In a terminal window type these commands, replacing the IP address with the relevant one (note that the password will not be visible on the screen): telnet 10.0.20.101 gbprobe login:...
- Page 267 Probes that are unable to execute the user program (usually caused by interrupting the save-to-flash process described above) can still be upgraded. Contact Sencore for details. To verify that the probe is unable to start the user program, connect the USB cable as explained in section 4.11.2 and reboot the probe.
- Page 268 F Appendix: Restoring probe factory defaults It is possible to reset the probe to factory settings, erasing all information about the probe configuration and alarm history. Please note that after factory reset, the management port will be assigned a default IP address of 10.0.30.220, with a subnet mask of 255.255.255.0.
Need help?
Do you have a question about the VB2 Series and is the answer not in the manual?
Questions and answers