Table of Contents
Advertisement
Advertisement
Table of Contents

Related Manuals for Sensors & Software LMX200 Series


Summary of Contents for Sensors & Software LMX200 Series
- Page 1 2015-00158-09...
- Page 3 Product Registration Product Registration Return this card to register your product, streamline technical support inquiries and receive updates and notifications. You can mail it to Sensors & Software, fax it to +1-905-624-9365, or register your product online at www.sensoft.ca/product-registration. Name: Company Name: Address: City:...
- Page 4 Product Registration...
- Page 5 Warranty & Liability & S ENSORS OFTWARE RODUCT ICENSE OPYRIGHT IABILITY AND ARRANTY NFORMATION Important Please read this document carefully before using the or assembling the SOFTWARE PRODUCT HARDWARE . By using the storage media or assembling the hardware, you are agreeing to be bound by the PRODUCT terms of this agreement.
- Page 6 Warranty & Liability without notice by Sensors & Software, Inc. if you fail to comply with any terms or conditions of this agreement. Upon termination, you agree to return all copies of the to Sensors & SOFTWARE PRODUCT Software, Inc. Update Policy Sensors &...
- Page 7 Warranty & Liability If failure of any resulted from accident, abuse or misapplication, Sensors & Software, Inc. shall PRODUCT have no responsibility to replace the , refund the license fee, or replace or repair the SOFTWARE PRODUCT HARDWARE PRODUCT Do not tamper with any contains no user serviceable parts.
- Page 8 Warranty & Liability Sensors & Software Inc. 1040 Stacey Court Mississauga, Ontario Canada L4W 2X8 Tel:(905) 624-8909 Toll Free: 1-800-267-6013 Fax:(905) 624-9365 E-mail: customerservice@sensoft.ca Sensors & Software, Inc. trademarks are listed at: www.sensoft.ca/trademarks 1999-00236-04 viii...
- Page 9 Important Safety Information Use the Display Unit only as specified in these operating instructions or the protection provided by the unit may be impaired. The battery charger/AC adapter must only be connected to a power outlet which provides a protective earth (ground). Connect the AC power cord only to designated power sources as marked on the battery charger/AC adapter.
-
Page 11: Table Of Contents
Table of Contents Table of Contents Overview ......................15 Assembly ......................17 Out of the box External GPS (optional) Fully Assembled Getting Started ....................23 Powering Up Shutting Down Interacting with the Display Unit Swipe Down Menu Tools & Setup ..................... 27 Preferences 4.1.1 Language / Locale... - Page 12 Table of Contents 6.7.1 Zoom 6.7.2 Color 6.7.3 Filter 6.7.4 Gain 6.7.5 DynaT 6.7.6 Soil Cal 6.7.7 Interp 6.7.8 Pause button (only available in No Save Mode) 6.7.9 Drawing arrows (only available in No Save Mode) Grid Scan ....................... 71 Grid Parameters 7.1.1 Grid Number...
- Page 13 Table of Contents 12.2 System Communications 12.3 System Overheating 12.4 Display Unit Problem 12.5 Wobbly Wheels 12.6 Creating a Test Line for Data Quality 12.7 Contacting the Vendor for Service Care & Maintenance ..................109 13.1 Battery Care 13.2 Cable Care 13.3 Skid Pads 13.4...
-
Page 15: Overview
Overview Overview The manual references embedded software version V1 R9. To see which software version is installed on your system, see the Swipe Down menu in Section 3.4. The LMX200 is a complete Ground Penetrating Radar system, offering two modes for acquiring data: Line Scan and Grid Scan. - Page 16 Overview Criteria LMX200 LMX200 Enhanced How is data Screenshots (.JPG) Screenshots (.JPG) and .GPZ files saved? 9 Projects each with: • 10 grids • 10 grids How much data • 99 lines can be saved? • 99 lines • 999 screenshots •...
-
Page 17: Assembly
Assembly Assembly 2.1 Out of the box You will find the following components in your LMX200 box. Some of these may already be assembled. Attach the Cart Handle to Cart Base using the Handle Pins. Ensure the Display Unit Tray is facing the operator. - Page 18 Assembly Attach the GPR Sensor to the Cart using the Sensor Support Straps. Ensure the Sensor is oriented the correct way with the connections toward the back of the Cart. Using the Sensor Support Straps, adjust the height of the Sensor so it is 1-2 cm (½ – ¾ inch) above the ground. The best way to get a uniform Sensor height is to place a couple of sheets of thick cardboard, particle board, or Styrofoam under the sensor before securing the Sensor Support Straps.
- Page 19 Assembly Attach the Display Cable to the back of the Display Unit with the jackscrews. Connect the other end of the cable to the Sensor. Ensure the cable is routed as shown below. Attach the Odometer and Battery Cables. The Odometer Cable connects to the closest receptacle on the Sensor.
-
Page 20: External Gps (Optional)
Assembly 2.2 External GPS (optional) The instructions for connecting the GPS, mount and cable are below: GPS Mount – The GPS mount attaches to the crossbar frame above the battery, using a quick release pin. There is a pipe plug that needs to be removed first. Once that is done, ensure the right angle pole is pointed up, then insert the GPS mount into the opening where the plug was removed and secure with the quick release pin. - Page 21 Assembly If you choose to connect a 3 party GPS receiver, it must meet the following criteria: • Be able to communicate over RS232 with a standard 9-pin serial output cable • Output a NMEA GGA string in ASCII format, at a rate no faster than 20 Hz •...
-
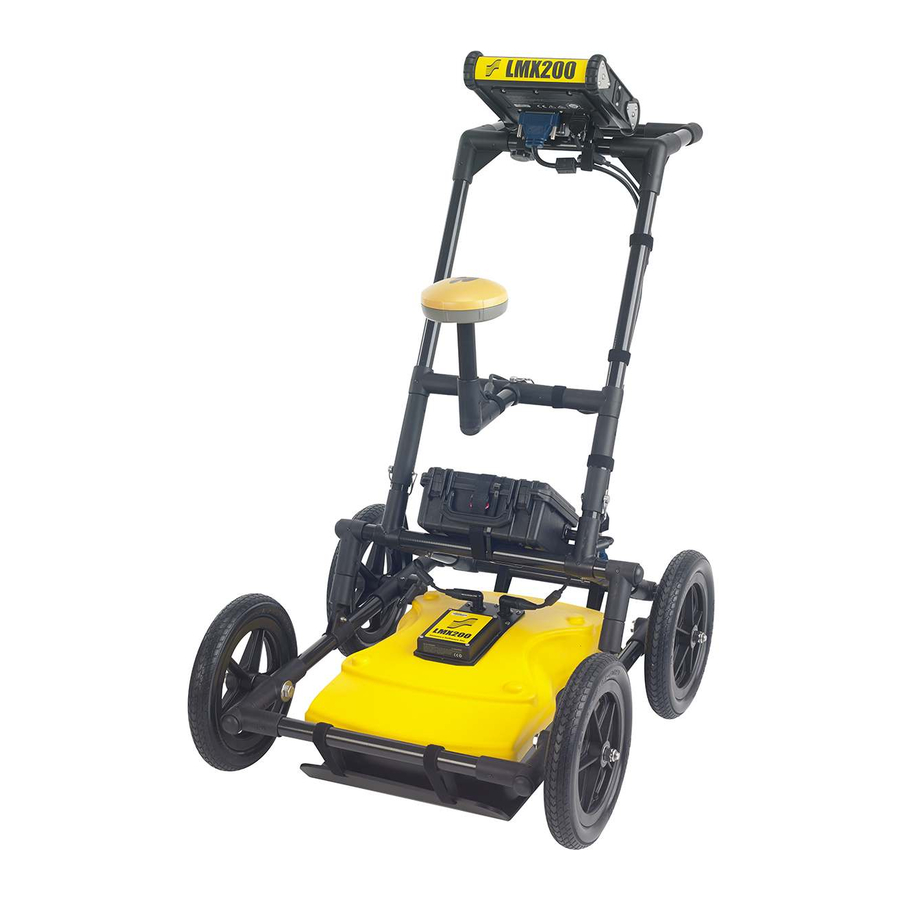
Page 22: Fully Assembled
Assembly 2.3 Fully Assembled The fully assembled LMX200 will look like the following. Simply reverse directions to disassemble for transport. -
Page 23: Getting Started
Getting Started Getting Started 3.1 Powering Up When the battery is first plugged in, the LED goes green for 5 seconds then disappears. To start the system, press the red power button on the display unit. The LED on the front panel will light up red. - Page 24 Getting Started Figure 3-2: Main Screen for LMX200 Figure 3-3: Main Screen for LMX200 Enhanced The differences between the two configurations are described in Section From the main menu of the Enhanced system, select the project number to work in. Projects that contain data are in red color, whereas those with no data are in green.
-
Page 25: Shutting Down
Getting Started 3.2 Shutting Down To power down, press the red power button on the display unit once. A confirmation message will appear, after which you can press Yes to proceed. In the rare event that the display unit is unresponsive, a hard shutdown can be done by pressing and holding the red power button until the unit shuts down. -
Page 26: Swipe Down Menu
Getting Started 3.4 Swipe Down Menu Figure 3-4: Swipe-Down menu When the Display Unit is powered on, you can “swipe” your finger from the top of the screen towards the bottom, to display a Swipe-Down menu (Figure 3-4) with the following items: Date and Time: The current date and time (12 hour clock). -
Page 27: Tools & Setup
Tools & Setup Tools & Setup From the main screen shown in Figure 3-2 or Figure 3-3, press Tools to enter this sub-menu. Here you can set preferences, adjust system settings, perform system tests and manage files. You will see the screen shown in Figure 4-1: Figure 4-1: Tools Menu 4.1 Preferences Selecting the preferences option will take you to the sub-menu shown in Figure 4-2. -
Page 28: Language / Locale
Tools & Setup There are several parameters that can be modified. Touch the screen and swipe up or down to scroll and view additional parameters. To change a value, press the value on the right side of the screen. Alternatively, use the up and down arrows on the 4-way keypad to highlight the desired parameter, then press Edit. -
Page 29: Brightness
Tools & Setup 4.1.5 Brightness Scroll bar for adjusting the brightness of the screen. Note that increasing the brightness consumes more battery power. This can also be changed by using the Swipe Down menu (Section 3.4) anytime the system is not collecting data. 4.1.6 Wi-Fi Network Connecting to a wireless network allows you to send a mini-report to someone by e-mail. -
Page 30: Email
Tools & Setup o Connect – Select the desired network and press Connect. If the connection is successful (this can take a minute or so) a screen appears asking for the password for that network. If the network name is yellow (from a previous connection to this network), it will not ask for a password because it is a remembered network. - Page 31 Tools & Setup Figure 4-5: Using GMAIL as e-mail provider • Press Username to display a keyboard where you can enter your GMAIL user name only; you do not need to enter @gmail.com. Then press OK when done (Figure 4-6a) •...
- Page 32 Tools & Setup To use another e-mail provider, press the + and – buttons under Provider until it says Custom. This will display the screen shown in Figure 4-7 allowing you to setup and configure a different e-mail provider: Figure 4-7: Entering e-mail address and password for another e-mail provider •...
- Page 33 Tools & Setup Below is the chart for some common e-mail providers: Server Enable Provider Host name Port Yahoo smtp.mail.yahoo.com Hotmail/Outlook smtp.live.com iCloud smtp.mail.me.com 163.com smtp.163.com Yandex smtp.yandex.com If there are no warning messages, the e-mail address is setup properly and you are ready to e- mail mini-reports from the field.
-
Page 34: Screen Saver
Tools & Setup 4.1.8 Screen Saver A screen saver can be setup to turn off the Display Unit screen after a period of inactivity to save power. The Screen Saver can be set to turn the screen off after 1 minute, 5 minutes or never (OFF setting). -
Page 35: Reset To Defaults
Tools & Setup Figure 4-8: GPR Line Plot Options • Auto-Hide Buttons - If this is set to ON, then in Line Scan mode, the buttons at the bottom of the screen disappear shortly after data collection begins, effectively enlarging the area for data display. -
Page 36: System Test
Tools & Setup 4.2 System Test The System Test sub-menu (Figure 4-10) allows the user to perform certain tests to ensure proper operation of the system. Select the component to test then press Start. After completing a test there is an indication of whether the system passed or failed the test. Each test is described below in more detail. -
Page 37: Keypad Test
Tools & Setup Figure 4-11: System Information • Anonymous Usage Statistics - When this is set to ON and the user is connected to a wireless network, any system malfunctions will trigger an automatic notification to Sensors & Software. This is to help with gathering information about any system irregularities. -
Page 38: Audio
Tools & Setup Once that is complete, a short LED test will ensue, which checks the proper operation of the LED. 4.2.3 Audio This test ensures that the speaking is operating properly. After starting the test, you should hear a sound with an increasing pitch. Figure 4-13: Audio Test 4.2.4 Touch Screen The test checks proper operation of the touch screen (Figure 4-14). -
Page 39: Sensor Test
Tools & Setup 4.2.5 Sensor Test This test checks proper operation of the GPR sensor, including the amplitude of the pulse. Once the cart is tipped backwards and start is pressed, it will conduct the test (Figure 4-15). If there are any irregularities, the test will indicate failure. Figure 4-15: Sensor Test... -
Page 40: Odometer Calibration
Tools & Setup 4.2.6 Odometer Calibration This test ensures that the odometer is measuring distance accurately. Even though the odometer is calibrated in the factory, you must calibrate it periodically to ensure accuracy. This is particularly important as the calibration can change with different surface materials. When selecting this option, you will see the screen in Figure 4-16. - Page 41 Tools & Setup Figure 4-17: Doing an odometer test Figure 4-18: Odometer Test passed on left, failed on the right • Odometer Calibration - This option actually calibrates the odometer (Figure 4-19). Choose a set distance from the screen, or select Custom. Then press Start and move the system that exact distance, using a measuring tape or other known distance indicator.
-
Page 42: Gps
Tools & Setup Figure 4-19: Odometer Calibration – select a distance and then press Start Upon completion, it displays the screen in Figure 4-20 (left image). You can either accept the new value by pressing Accept, or revert back to the previous value by pressing Reject. If the new value is significantly out of range, the test will fail Figure 4-20 (right image). - Page 43 Tools & Setup Figure 4-21: GPS Test The basic position and time information is displayed on the screen. On the screen, the Fix Type notes if there are any corrections being applied, such as DGPS. Pressing Strings will display the raw data strings that are outputted by the GPS (Figure 4-22) as they scroll down the screen.
- Page 44 Tools & Setup Figure 4-23: GPS Setup screen The following buttons are explained below: o GPS Mode –you can select whether to use the internal GPS, external GPS or no GPS at all (Off) o Format – GPS units can be either UTM (Universal Transverse Mercator) or Latitude/Longitude coordinates o GPS Test –...
-
Page 45: File Management
Tools & Setup Figure 4-24: Warning message about enabling power to the serial port 4.3 File Management Press File Management to enter this sub-menu. From here, the user can view screenshots, export data and delete all data. If you have the regular LMX200, you will see the image in Figure 4-25a. - Page 46 Tools & Setup there are more than four screenshots, swipe the screen from right to left to view the rest. Alternatively, you can also use the Left and Right arrow keys on the 4-way directional keypad Figure 4-26: Tile View in Screenshot Gallery From the Tile View, the user has the following options: •...
-
Page 47: Delete All Data
Tools & Setup 4.3.2 Delete All Data Pressing this will delete all data saved on the system. There is a confirmation window asking if you are sure; press Yes to continue deleting, press No to cancel. 4.3.3 Delete Project (Enhanced system) Pressing this will delete the currently selected project. - Page 48 Tools & Setup...
-
Page 49: Gpr Concepts
GPR Concepts 5 GPR Concepts 5.1 Theory Ground penetrating radar (GPR) technology uses radio waves to image objects in the subsurface. The subsurface may consist of soil, rock, asphalt and other materials. GPR systems emit high frequency radio wave pulses and detect the echoes that return from objects within the subsurface. -
Page 50: Calculating Depth
GPR Concepts Apex of hyperbola is where objects is located 5.3 Calculating Depth Ground penetrating radar records the time it takes a radio wave to travel to a target and back; it does not measure the depth to that target directly. Depth to target is calculated based on the velocity with which the wave travels to the target and back. -
Page 51: Air Waves
GPR Concepts Material Soil Cal Dry Soil Dry Rock Soil Wet Rock Concrete Pavement Wet Soil Water 5.5 Air Waves Some hyperbolas are caused by air wave reflections from objects above ground, such as posts, fences, overhead wires, and trees. The following image displays how air wave reflections affect data: An important part of understanding the data image is learning to recognize these unwanted "air"... - Page 52 GPR Concepts...
-
Page 53: Line Scan
Line Scan 6 Line Scan Line Scan mode allows the operator to acquire data along a straight line and examine it as a cross-section image. The operator can locate a feature and easily back-up and mark the location of that object on the ground. Line Scan mode can be used to identify the alignment of subsurface features, check for linearity and acquire accurate depth measurements. - Page 54 Line Scan If the line number is white (Figure 6-1), Press Start to enter data acquisition. All data collected will be saved under this line number. If the line number is shown in red (Figure 6-2), you will see the data preview on the right side of the screen.
-
Page 55: Acquiring Data
Line Scan 6.2 Acquiring Data Press the Start button to begin collecting data. The screen will change to the data acquisition screen. As the system is pushed along a straight line, the collected GPR data scrolls onto the screen from the right and moves to the left (Figure 6-4). The depth scale along the side of the GPR Line image and the position scale along the top of the image are set to Metric or US Standard units based on the setting in the Preferences menu (Section... -
Page 56: Back-Up Indicator
Line Scan As the Line Scan data scrolls on the screen, the DynaQ Index Bar is displayed along the bottom of the screen (Figure 6-4). The color of the bar indicates the quality of the data at that point along the line: White = No Data (too fast!) Yellow... -
Page 57: Flags
Line Scan surface and continue data collection. Once you reach the point where you initially started backing- up, the system will continue acquiring new data. You can also obtain depth and position information anywhere on the Line Scan by touching the screen, holding for a second, then releasing. -
Page 58: Splitview
Line Scan Figure 6-7: Inserting Flags 6.6 SplitView When the external GPS is connected, the user is able to split the screen to show Line Scan data being acquired, as well as a real time MapView display. Press the SplitView button to see this view (Figure 6-8). - Page 59 Line Scan orange section corresponds to the data shown on the left side. Pressing the left and right arrows on the 4-way directional keypad will display different sections of the data collected; this will also update which section you are viewing on the MapView display (Figure 6-9). Figure 6-9: Collecting data in SplitView mode In the LMX200, MapView will display all lines (collected with an external GPS) and grids (collected with internal or external GPS) on the system.
-
Page 60: View Settings
Line Scan Figure 6-10: Warning message that some data is outside the MapView display range Pressing the LineView Settings button will change the bottom menu options (Figure 6-9), while remaining in the SplitView display. Pressing the MapView Settings button will display options for controlling the MapView display. This is explained in Section If you are collecting data in real-time you can press the LineView button to return to full screen... -
Page 61: Zoom
Line Scan Figure 6-11: Menu at bottom of screen, after pressing View Settings 6.7.1 Zoom This button controls the horizontal and vertical scaling of the displayed GPR data. Pressing the Zoom button changes the buttons on the bottom menu, which are explained below: •... - Page 62 Line Scan Figure 6-12: Varying displayed depth Figure 6-13: Varying position, or horizontal scaling...
-
Page 63: Color
Line Scan 6.7.2 Color Pressing this changes the color palette for the GPR Lines. There are 9 different color palette options. Pressing this button increments the color number and re-displays the image; once you reach 9 it cycles back to 1. A few sample color palettes are shown in Figure 6-14. Figure 6-14: Changing Color palettes 6.7.3 Filter The Filter is a background subtraction filter used for removing flat-lying responses in the data. -
Page 64: Gain
Line Scan Figure 6-15: Showing variable filter lengths, and Filter Off 6.7.4 Gain Since the material being scanned absorbs the GPR signal, deeper targets return weaker signals. Gain acts like an audio volume control, amplifying signals and making deeper targets appear stronger in the image. -
Page 65: Dynat
Line Scan Figure 6-16: Varying the Gain 6.7.5 DynaT DynaT is a feature that can selectively enhance small, medium or large size targets for easier viewing and detection (Figure 6-17). Pressing DynaT cycles between options: All, Small, Medium and Large. Each option allows the user to enhance part of the ultra-wide band (UWB) spectrum to focus on those desired features. -
Page 66: Soil Cal
Line Scan 6.7.6 Soil Cal The Soil Cal (also known as velocity) is a parameter used to ensure that measured depths are accurate. The best way to ensure this is by using the hyperbola-fitting method, since it is based on data collected in the area. Crossing linear targets like pipes or cables at a 90 degree angle produces a hyperbola suitable for soil calibration. - Page 67 Line Scan Figure 6-18: Adjusting Soil Cal while in backup mode On the other hand, if you press Soil Cal while you are collecting data or have pressed Stop, you will see a red hyperbola in the middle of the screen. Drag the hyperbola such that it lies over a real hyperbola from the ground (Figure 6-19).
-
Page 68: Interp
Line Scan Figure 6-19: Adjusting Soil Cal, without backing up For either scenario above, once the red hyperbola is properly positioned, you can now use the + and – buttons on the Soil Cal button to widen or tighten the shape. Once the shape is matched (Figure 6-18 and bottom image of Figure 6-19), you now have the correct Soil Cal and the measured depths will be most accurate. -
Page 69: Pause Button (Only Available In No Save Mode)
Line Scan Figure 6-20: Available colors for Interps 6.7.8 Pause button (only available in No Save Mode) The Pause button allows you to temporarily stop data collection and resume again, without clearing the data from the screen. This might be useful if you want to collect a series of parallel lines over a target and show all the passes on the screen for comparison. -
Page 70: Drawing Arrows (Only Available In No Save Mode)
Line Scan Figure 6-21: Pressing Pause and resuming data collection. 6.7.9 Drawing arrows (only available in No Save Mode) There is no option for Interps in this mode, as the data is not being saved. However, you do have the ability to draw arrows on the screen (Figure 6-22). Figure 6-22: Drawing arrows on the screen to highlight targets and features Touch the screen where you want the head of the arrow to appear, and then swipe away in the direction of the shaft. -
Page 71: Grid Parameters
Grid Scan 7 Grid Scan Grid scans are conducted to generate depth slices over a given area. This is useful for locating all known and unknown objects, as well as their orientation, in a graphical manner that is easy to interpret. From the main menu (either in Figure 3-2 or Figure 3-3), press the Grid Scan button to enter the Grid setup menu. -
Page 72: Grid Size
Grid Scan You can press Start to enter a previously collected grid, either to view data or recollect a line. Figure 7-2: When the button showing the grid number is pressed, this screen allows the user to directly input the grid they wish to go to 7.1.2 Grid Size... -
Page 73: Starting Data Collection
Grid Scan 7.1.4 Starting data collection Press Start when all the parameters are setup and data collection is ready to begin. 7.2 Laying out the grid Positional accuracy of each line is vital to locating targets of interest once data has been processed. - Page 74 Grid Scan Figure 7-4: Forming a right-angle triangle Step 3 – Mark the Line Start Positions – with the tape measure still on the ground, mark the line start positions based on the line spacings (Figure 7-5). Usually flags or paint work for grass, and chalk or paint on concrete.
- Page 75 Grid Scan Figure 7-6: Marking ending positions For linear targets such as pipes and utilities, the best GPR responses occur when the GPR survey line crosses the target at right angles. Keep this in mind when laying out the grid and the orientation.
-
Page 76: Data Collection
Grid Scan 7.3 Data Collection 7.3.1 Physical Data collection It is critical that the starting position is consistent on every line. Line up the middle of the unit with the starting line, and then push the system straight towards the end of the line. It is helpful to have a marker at the end so you have something to aim for. -
Page 77: Obstacles In Your Path
Grid Scan Figure 7-9: Display after the first grid line is collected Move back to the start of the next line and repeat the process. Once all the lines are done in one direction, it will automatically prompt you to collect lines in the other direction. Not all lines have to be collected. -
Page 78: Flags
Grid Scan Figure 7-10: Collecting a reverse line around an obstacle A completed grid with an obstacle in the middle, might look like the image in Figure 7-11. Figure 7-11: Completed grid with obstacle 7.3.4 Flags Flags are often inserted to mark noteworthy surface features, such as poles, sidewalks, changes in terrain etc. -
Page 79: Recollecting & Skipping Lines
Grid Scan Filter, Gain and Soil Cal values. It is also possible to display other collected grid lines using the keypad arrow buttons. To exit from the LineView screen and return to Grid View, press the Back button. The Grid View screen respects any display settings changed while in LineView. -
Page 80: Processing Data
Grid Scan Figure 7-13: Overwriting a line 7.3.7 Processing data Once you have finished collecting all the data, press SliceView at the bottom of the screen. Before the data is processed and depth slices created, you must ensure the Soil Cal is accurate;... -
Page 81: Sliceview
SliceView 8 SliceView SliceView displays data collected in a grid as a series of depth slices moving deeper into the subsurface. Objects and features appear in plan view, which can be an easier way of visualizing the data. Upon entering SliceView, the screen will be displayed as shown in Figure 8-1. Depth slice range Soil Cal... -
Page 82: Lineview
SliceView 8.2 LineView Pressing this button displays the currently selected GPR line as a full screen image. All the functionality of Line Scan (such as Depth, Color, Filter, Gain, DynaT, Soil Cal, Interps) are available here (Figure 8-2). Use the 4-way directional keypad to change to a different line. Figure 8-2: Changing LineView settings from within SliceView. - Page 83 SliceView Figure 8-3: Varying the sensitivity, from top to bottom: Low, Medium and High settings. High shows more subtle targets but may sometimes appear cluttered while the Low setting only displays the strongest targets so be cautious when using it.
-
Page 84: Options
SliceView 8.4 Options 8.4.1 Grid Lines Pressing this button overlays grid lines on the depth slice image, and cycles between ON, PARTIAL or OFF. When set to ON, all the collected lines are displayed. When set to PARTIAL, only some of the grid lines are displayed. This may be necessary for some larger grids as having all the grid lines ON tends to obscure the image beneath (Figure 8-4). -
Page 85: Flags
SliceView 8.4.2 Flags Pressing this button toggles on and off between displaying flags on the line scan data and the depth slice. 8.4.3 Interps Pressing this button toggles on and off between displaying Interps on the line scan data and the depth slice. - Page 86 SliceView...
-
Page 87: Accessing Mapview
MapView 9 MapView MapView is a unique feature that allows the user to graphically view the path travelled by the system, and any flags or interpretations made. This is helpful in determining the linearity and consistency of buried objects. It will also display depth slices from a grid collection. A common use of this feature is to snake back and forth over a given area. -
Page 88: Mapview Screen
MapView Figure 9-2: Accessing MapView from the SplitView screen in Line Scan 9.2 MapView screen Regardless of how you enter MapView, you will see an image similar to the one in Figure 9-3. The available options are described below: Figure 9-3: MapView screen •... -
Page 89: Options (Layer Views)
MapView • Pressing the +/- buttons under Zoom will zoom the image accordingly. Alternatively, you can also press the +/- buttons in the top right of the screen. To reposition the image in the middle of the screen, simply swipe the screen until the image is positioned properly. •... - Page 90 MapView • Lines – turning this off will remove all collected lines from the display (white lines in Figure 9-4) • Grids – turning this off will remove all grids (red grid in Figure 9-4) • Grid/Line Names – the name of each line and grid is shown beside it. Turning this off will remove this name display •...
- Page 91 MapView Figure 9-6: With the Lock Location enabled, the MapView display is locked. It shows an icon (in the red circle) when the user’s current position is outside of the display. When the Measure button is pressed, it is highlighted in blue. During this time, you can touch the screen and drag your finger a certain distance to get a measurement value for that distance.
- Page 92 MapView Where there are multiple lines and grids, the MapView could look like the example in Figure 9-8. Figure 9-8: MapView showing multiple grids and lines However, if lines/grids in a project (or any lines/grids in an LMX200) are collected far apart, MapView will only display them if they are collected within a 2.5km radius of the currently selected line.
-
Page 93: Capturing Screens & E-Mailing Mini-Reports
Capturing Screens & E-mailing Mini-Reports Capturing Screens & E-mailing Mini-Reports 10.1 Capturing Screens If you would like to save an image of the current screen in Line Scan, Grid Scan, SliceView or MapView, press the Camera button on the Display Unit. This saves the screen as a Screenshot image (.JPG), which can be viewed in any third-party viewing software. -
Page 94: Using The Hotspot On Your Smartphone
Capturing Screens & E-mailing Mini-Reports Figure 10-2: Message after pressing the Camera button on the Display Unit to capture the screen with Wi-Fi enabled and a connection to a wireless network. The user can enter an email address to send the mini-report to. 10.2 Using the Hotspot on your Smartphone If a Wi-Fi signal in unavailable, you may be able to use your Smartphone as a Wi-Fi access point, by creating a Personal Hotspot. -
Page 95: Mini-Reports
Capturing Screens & E-mailing Mini-Reports Note that when setting up a Personal Hotspot, you may be disconnected from any Wi-Fi networks. Vice-versa, if you have a Personal Hotspot setup, attempting to connect to a Wi-Fi network may disconnect your personal hotspot. 10.3 Mini-Reports When a screenshot is e-mailed, it is sent as part of a mini-report. - Page 96 Capturing Screens & E-mailing Mini-Reports Figure 10-3: Example of a Mini-Report...
-
Page 97: Transferring Data To A Pc
Transferring Data to a PC Transferring Data to a PC Data can be exported to a PC by inserting a USB drive into the USB port (Figure 11-1). USB-memory stick Figure 11-1: Insert a USB memory stick into the USB port on the Display Unit to export data. Once the USB drive is recognized, a message will appear telling you that a drive has been inserted and if you wish to export your data to it (Figure 11-2). -
Page 98: Formatting Usb Sticks
Transferring Data to a PC Figure 11-3: Insert a USB memory stick into the USB port on the Display Unit to export data. Alternatively, if you want to export data from a specific Project (LMX200 Enhanced only), you can select No for the time being. Later on, when you are ready to export your data, from the main menu select Setup >... -
Page 99: Directory Structure
Transferring Data to a PC 11.2 Directory Structure The directory structure on the USB drive can be viewed on your PC, and will look as follows: • GPR Data • LMX200 Export01 ▪ Project1 • Screen Shots All Screenshots as .JPG files •... -
Page 100: Field Interpretations File
Transferring Data to a PC 11.3 Field Interpretations file If any interpretations are made a Field Interp Report file is created. This file is a CSV (Comma separated values) format, most commonly opened with Microsoft Excel. The file will list any Interps and Flags added to data in the field. The position, depth and colour of each Interp is listed, along with GPS positions (if a GPS was connected). - Page 101 Transferring Data to a PC Figure 11-6: Path travelled with Interpretations, collected using an External GPS Opening the data in EKKO_Project (Section 11.6) and creating depth slices, will allow you to export those slices to Google Earth (Figure 11-7). Figure 11-7: Depth slice displayed in Google Earth...
-
Page 102: System Summary Report
Transferring Data to a PC 11.5 System Summary Report The System Summary report is a PDF file, which lists system usage information, serial numbers and when system tests were done and their pass/fail status. An example file is shown below: System Usage Summary April 18 2019 Usage Statistics... -
Page 103: Ekko_Project
Transferring Data to a PC 11.6 EKKO_Project If you have an LMX200 Enhanced system, any line and grid data collected in a project are saved as a single .GPZ file (e.g. Project1.GPZ). This file can be opened with the EKKO_Project PC software. - Page 104 Transferring Data to a PC...
-
Page 105: Troubleshooting
Troubleshooting Troubleshooting The LMX200 system is designed to minimize user problems; however, all electronic devices are subject to possible failure. The following are troubleshooting hints which can be referred to if your system fails to operate. 12.1 Power Supply The most common problem that can occur while trying to run the system is insufficient power. The battery may be dead, have a low voltage or the fuse may be blown. -
Page 106: System Overheating
Troubleshooting If the Battery, Battery Cable and Display Cable are OK, the problem is either a failure of the Display Unit or the GPR sensor. These units have no user-serviceable parts so they will have to be returned to the vendor for inspection and repair. 12.3 System Overheating The GPR system is designed to operate to a maximum internal temperature of 70 C or 158... -
Page 107: Contacting The Vendor For Service
Troubleshooting 12.7 Contacting the Vendor for Service When returning the system to the Vendor, have the following information available: GPR sensor Serial Number displayed at the top of the System Settings Screen. A brief description of when the error is happening and the operating conditions (temperature, humidity, sunshine, system settings, etc.). - Page 108 Troubleshooting...
-
Page 109: Care & Maintenance
Care & Maintenance Care & Maintenance 13.1 Battery Care The LMX200 uses a 9-Amp-hour, 12-Volt sealed lead acid battery. It is fused with a 10 Amp fuse to protect it from short circuit damage. The battery unit should run the LMX200 continuously for 6 hours before recharging is necessary. If long days of data surveying are typical, a second battery unit may be useful. -
Page 110: Cable Care
Care & Maintenance 13.2 Cable Care With the use of this product in rough, dusty and outdoor environments, users can minimize potential downtime if they care for cables and treat connectors with respect. The cable connectors as well as the connectors on the GPR Sensor and Display Unit need to stay clean and free of dust and moisture. - Page 111 Care & Maintenance...
- Page 112 Care & Maintenance...
-
Page 113: Parts List & Accessories
Parts List & Accessories Parts List & Accessories 14.1 Spare Parts The following is a list of spare parts available for purchase, with labelled diagram below that: 122-10-2377 Cart Wheel 100-55-0023 Battery with Case 100-53-0098 Display Unit Tray 100-52-0108 Display Cable 126-77-1450 Skid Plate 126-77-2010... - Page 114 Parts List & Accessories...
-
Page 115: Accessories
Parts List & Accessories 14.2 Accessories The following accessories are available for purchase... - Page 116 Parts List & Accessories...
-
Page 117: Technical Specifications
Technical Specifications Technical Specifications Specifications Values GPR Sensor size 630 x 410 x 230 mm (25 x 16 x 9 in) GPR Sensor weight 5 kg (11 lbs) Display Unit weight 2.83 kg (6.24 lbs) 8.0" high-visibility, sunlight-readable diagonal LCD display with touch screen Display Unit screen Adjustable backlighting... - Page 118 Technical Specifications...
-
Page 119: Appendix A: Health & Safety Certification
Appendix A: Health & Safety Certification Appendix A: Health & Safety Certification Radio frequency electromagnetic fields may pose a health hazard when the fields are intense. Normal fields have been studied extensively over the past 30 years with no conclusive epidemiology relating electromagnetic fields to health problems. - Page 120 Appendix A: Health & Safety Certification...
-
Page 121: Appendix B: Gpr Emissions, Interference And Regulations
Appendix B: GPR Emissions, Interference and Regulations Appendix B: GPR Emissions, Interference and Regulations All governments have regulations on the level of electromagnetic emissions that an electronic apparatus can emit. The objective is to assure that one apparatus or device does not interfere with any other apparatus or device in such a way as to make the other apparatus non- functional. - Page 122 Appendix B: GPR Emissions, Interference and Regulations FCC Interpretation of Operation Restrictions issued July 12, 2002 (FCC Order DA02-1658, paragraph 9) The regulations contain restrictions on the parties that are eligible to operate imaging systems (See 47 C.F.R. 5.509(b), 15.511(b), and 15.513(b)). Under the new regulations, GPRs and wall imaging systems may be used only by law enforcement, fire and emergency rescue organizations, by scientific research institutes, by commercial mining companies, and by construction companies.
- Page 123 Appendix B: GPR Emissions, Interference and Regulations Federal Communications Commission 445 12 Street, SW, Washington, D.C. 20554 Attn: UWB Coordination (Sensors & Software Inc. Note: The form given on the following page is a suggested format for performing the coordination.) (c) The manufacturers, or their authorized sales agents, must inform purchasers and users of their systems of the requirement to undertake detailed coordination of operational areas with the FCC prior to the equipment being operated.
- Page 124 Appendix B: GPR Emissions, Interference and Regulations FCC GROUND PENETRATING RADAR COORDINATION NOTICE NAME: ADDRESS: CONTACT INFORMATION [ CONTACT NAME AND PHONE NUMBER AREA OF OPERATION [ COUNTIES STATES OR LARGER AREAS FCC ID: QJQ-NG250 EQUIPMENT NOMENCLATURE: NG250 Send the information to: Frequency Coordination Branch., OET Federal Communications Commission 445 12...
- Page 125 Appendix B: GPR Emissions, Interference and Regulations B-2 ETSI Regulations for the EC (European Community) In the European Community (EC), GPR instruments must conform to ETSI (European Technical Standards Institute) standard EN 302 066-1 v1.2.1. Details on individual country requirements for licensing are coordinated with this standard.
- Page 126 Appendix B: GPR Emissions, Interference and Regulations B-3a Industry Canada Regulations - English Industry Canada published it regulations for ground penetrating radar (GPR) on Mar 29 2009 as part of the RSS-220 titled 'Devices Using Ultra-Wideband (UWB) Technology'. Industry Canada has made a unique exception for GPR by not requiring user licensing. The user does have to comply with the following directives: This Ground Penetrating Radar Device shall be operated only when in contact with or within 1 m of the ground.
- Page 127 Appendix B: GPR Emissions, Interference and Regulations B-3b Règlement d'Industrie Canada - Français Industrie Canada a publié des règlements pour les appareils géoradar (GPR) le 29 mars 2009, dans le cadre du RSS-220 intitulé "Dispositifs utilisant la bande ultra-large (UWB)". Industrie Canada a faite une exception unique pour GPR en n'exigeant pas de licence par utilisateur.
- Page 128 Appendix B: GPR Emissions, Interference and Regulations...
-
Page 129: Appendix C: Instrument Interference
Appendix C: Instrument Interference Appendix C: Instrument Interference Immunity regulations place the onus on instrument/apparatus/device manufacturers to assure that extraneous interference will not unduly cause an instrument/apparatus/device to stop functioning or to function in a faulty manner. Based on independent testing house measurements, Sensors & Software Inc. systems comply with such regulations in Canada, USA, European Community and most other jurisdictions. - Page 130 Appendix C: Instrument Interference...
-
Page 131: Appendix D: Safety Around Explosive Devices
Appendix D: Safety around Explosive Devices Appendix D: Safety around Explosive Devices Concerns are expressed from time to time on the hazard of GPR products being used near blasting caps and unexploded ordnance (UXO). Experience with blasting caps indicates that the power of Sensors &... - Page 132 Appendix D: Safety around Explosive Devices...
-
Page 133: Appendix E: Wi-Fi Module
Appendix E: Wi-Fi Module Appendix E: Wi-Fi Module FCC Notice: NOTE: This equipment has been tested and found to comply with the limits for a Class A digital device, pursuant to part 15 of the FCC Rules. These limits are designed to provide reasonable protection against harmful interference when the equipment is operated in a commercial environment.
Need help?
Do you have a question about the LMX200 Series and is the answer not in the manual?
Questions and answers