Hioki MR8880-20 Instruction Manual
Memory hicorder
Hide thumbs
Also See for MR8880-20:
- Measurement manual (3 pages) ,
- Quick start manual (8 pages) ,
- Quick start manual (9 pages)
Table of Contents
Advertisement
Quick Links
MR8880-20
MEMORY HiCORDER
Be sure to read this manual before
using the instrument
When using the instrument for the
first time
Names and Functions of
Measurement Preparations
July 2018 Revised edition 7
MR8880B980-07 18-07H
Parts p.22
p.31
Instruction Manual
Video
Scan this code to watch an
instructional video.
Carrier charges may apply.
Safety information
Troubleshooting
Troubleshooting
Error Messages and Remedial
Actions
p.5
p.249
p.A1
EN
Advertisement
Table of Contents

Related Manuals for Hioki MR8880-20


Summary of Contents for Hioki MR8880-20
- Page 1 MR8880-20 Instruction Manual MEMORY HiCORDER Video Scan this code to watch an instructional video. Carrier charges may apply. Be sure to read this manual before p.5 Safety information using the instrument When using the instrument for the Troubleshooting first time Parts ...
-
Page 3: Table Of Contents
Contents Contents Procedure...................1 Introduction.................3 Confirming Package Contents............4 Safety Information ..............5 Operating Precautions..............8 Chapter 1 Overview ____________________________________21 Product Overview and Features ......21 Names and Functions of Parts .......22 Screen Configuration and Display ......24 Chapter 2 Measurement Preparations _________________31 Using the Alkaline Battery Box (Accessory) or Battery Pack (Option) ..........32 Installing the Alkaline Battery Box and Replacing the Batteries ...33 Install the Battery Pack .............34... - Page 4 Contents USB Flash Drive Insertion & Removal ........47 Formatting a CF Card/USB Flash Drive ........48 Compensating for Input Circuit Offset (Zero Adjustment) ........... 49 Chapter 3 Basic Operating Procedures _______________ 51 Pre-Operation Inspection........51 Measurement Flow ..........52 Basic Operation ............
- Page 5 Contents Using Real-time Function (Fluctuation Recording) .78 Selecting the Function (Real-time Function) ......78 Setting the Interval for the Data to Record (Recording Interval) ...79 Setting the Recording Time ............81 Setting the Repeat Operation (Repeat Measurement or Single Measurement) .....83 Retaining Records of Maximum and Minimum Values (Envelope) ................84 Setting the Input Conditions ........86 Setting the Input Channel (Instantaneous Value/Effective...
- Page 6 Contents Detecting Instantaneous Power Failure of Commercial Power Supply (Voltage Drop Trigger) (High-speed Function only) ... 120 Monitoring Commercial Power Supply (Waveform Judgment Trigger) (High-speed Function only) ... 121 Applying Trigger with Logic Input Signal (Logic Trigger) ..124 Applying Trigger at Fixed Time Interval (Interval Trigger) ..126 Applying Trigger with External Input Signal (External Trigger) 127 4.10 Entering Comments and Titles ......
- Page 7 Contents Preparations and Settings for Power Outages during Long-term Measurements ............149 Saving Data ............150 Selecting & Saving Data with the SAVE Key [Select&Save] ..152 Saving immediately with the SAVE Key [Quick Save] ....154 Saving Setting Configuration Data .........156 Loading Data on the HiCorder ......157 Loading a Setting Configuration ..........157 Loading Waveform Data and Screen Images ......159 Data Management ..........160...
- Page 8 Contents Calculating Automatically (Auto Calculation) ..........179 Calculating at Specified Interval (Interval Calculation) ..181 Calculating after Measurement (Manual Calculation) ..........182 Performing Calculation for All Data ........182 Apply Calculations to a Specific Time Span ......183 Numerical Value Calculation Expressions ..184 Chapter 9 Scheduling Measurement _________________ 187 Starting &...
- Page 9 12.5 Using External Outputs (ALM/OUT) .....225 12.6 Synchronous Measurements with Multiple Instruments ............226 Chapter 13 Specifications_____________________________ 227 13.1 MR8880-20 Specifications ........227 13.2 High-speed Function ..........235 13.3 Real-time Function ..........236 13.4 Other Functions .............239 13.5 Monitor Functions ..........243 13.6 Setting Wizard Function (PRESETS) ....243...
- Page 10 viii Contents Chapter 14 Maintenance and Service _________________ 245 14.1 Inspection, Repair, and Cleaning ......245 14.2 Troubleshooting ........... 249 14.3 Disposing of the Instrument ........ 251 ______________ A1 Appendix Appendix 1 Error Messages and Remedial Actions ..A1 Appendix 2 List of Default Settings .........A7 Appendix 3 File Naming ..........A12 Appendix 4 Text File (CSV File) Internal Format...A13 Appendix 5 Waveform File Size........A15...
-
Page 11: Contents
Procedure Procedure Preparation (p. 31) Inspection (p. 51) Setup (p. 63) You can customize the settings as necessary (p. 67). Start of Measurement You can configure the settings easily with Setting Wizard. View Input State (p. 55) End of Measurement Analyze with Instrument (p. - Page 12 Procedure...
-
Page 13: Introduction
Introduction Introduction Thank you for purchasing the HIOKI Model MR8880-20 Memory HiCorder. To obtain maximum performance from the instrument, please read this manual first, and keep it handy for future reference. The inputs of the instrument are specifically for voltage input. -
Page 14: Confirming Package Contents
The latest version can be down- loaded from our web site. Alkaline Battery Box......1 (p. 32) Use the original packing materials when transporting the instrument, if possible. For information about options: (p. A26) Contact your dealer or Hioki representative for details. -
Page 15: Safety Information
Safety Information Safety Information This instrument is designed to comply with IEC 61010 Safety Stan- dards, and has been thoroughly tested for safety prior to ship- ment. However, mishandling during use could result in injury or death, as well as damage to the instrument. Using the instrument in a way not described in this manual may negate the provided safety features. - Page 16 Safety Information The following symbols in this manual indicate the relative importance of cautions and warnings. Indicates that incorrect operation presents an extreme hazard that could result in serious injury or death to the user. Indicates that incorrect operation presents a significant hazard that could result in serious injury or death to the user.
- Page 17 Safety Information Accuracy We define measurement tolerances in terms of f.s. (full scale), rdg. (reading) and dgt. (digit) values, with the following meanings: f.s. (maximum display value or scale length) The maximum displayable value or scale length. In this instrument, the maximum displayable value is the range (V/div) times the number of divi- sions (10) on the vertical axis.
-
Page 18: Operating Precautions
Using the instrument in such conditions could cause an electric shock, so contact your dealer or Hioki representative for replacements. Instrument Installation Operating temperature and humidity Temperature: -10°C to 50°C (14 to 122°F),... - Page 19 Operating Precautions Avoid the following locations that could cause an accident or damage to the instrument. Exposed to direct sunlight In the presence of corro- Exposed to high temperature sive or explosive gases Exposed to water, oil, other Exposed to strong electro- chemicals, or solvents magnetic fields Exposed to high humidity or...
- Page 20 Operating Precautions • The operating temperature range of the instrument is -10°C to 50°C. Do not use the instrument in an environment that is out of this range. • To avoid damage to the instrument, protect it from physical shock when transporting and handling.
- Page 21 Operating Precautions • Use only the specified connection cables. Using a non-specified cable may result in incorrect measurements due to poor connection or other reasons. • Before using a clamp sensor or logic probe, read the instruction man- ual supplied with it. Alkaline Battery Box (Accessory) and Battery Pack (Option) About installation procedure: "2.1 Using the Alkaline Battery Box (Accessory) or Battery Pack (Option)"...
- Page 22 Operating Precautions About alkaline dry cell batteries • Do not mix old and new batteries, or different types of batteries. Also, be careful to observe battery polarity during installation. Otherwise, poor performance or damage from battery leakage could result. • Do not use LR6 alkaline batteries together with commercially avail- able nickel hydride batteries or other types of batteries.
- Page 23 Operating Precautions • The battery pack is a consumable. If the battery capacity remains very low after correct recharging, the useful battery life is at an end. • When a battery pack that has not been used for a long time is used, charging may end before the battery pack is fully charged.
- Page 24 Operating Precautions Using the AC Adapter • Use only the supplied Model Z1002 AC Adapter. AC adapter input voltage range is 100 to 240 V AC (with ±10% stability) at 50/ 60 Hz. To avoid electrical hazards and damage to the instrument, do not apply voltage outside of this range.
- Page 25 Operating Precautions Connecting to the Terminals Connecting to the Analog Input Terminals • Note the following maximum input voltage and maximum rated voltage to earth. 600 V AC/DC (CAT III, II), 300 V AC/DC (CAT IV) If their voltages are exceeded, this device will be damaged and personal injury will result.
- Page 26 Operating Precautions Connect the clamp-on sensors or connection cords to the instru- ment first, and then to the active lines to be measured. Observe the following to avoid electric shock and short circuits. • To avoid short circuits and potentially life-threatening hazards, never attach the clamp to a circuit that operates at more than the maximum rated voltage to earth, or over bare conductors.
- Page 27 Operating Precautions Connecting to the logic terminals To avoid electric shock and short circuit accidents or damage to the instrument, pay attention to the following: • Maximum logic probe input voltages are as follows. Do not measure if the maximum voltage would be exceeded, as damage the instrument or personal injury may result.
- Page 28 Operating Precautions When connecting to external control terminals To avoid electric shock or damage to the equipment, always observe the following precautions when connecting to external control terminals. • Always turn off the power to the instrument and to any devices to be connected before making connections.
- Page 29 Operating Precautions About the Printer • The printer head and metal parts nearby become very hot. Be careful not to touch them because doing so may result in a burn. • Be careful not to cut a finger with the paper cutter. •...
- Page 30 Never use abrasives or sol- vent cleaners. • Hioki shall not be held liable for any problems with a computer system that arises from the use of this CD, or for any problem related to the...
-
Page 31: Chapter 1 Overview
1.1 Product Overview and Features Chapter 1 Overview 1.1 Product Overview and Features This instrument is a waveform recorder that is easy to operate. It can be powered by batteries, making it quick to employ in the field in the event of trouble. The measure- ment data can be observed on the screen, calculated, and printed with a printer. -
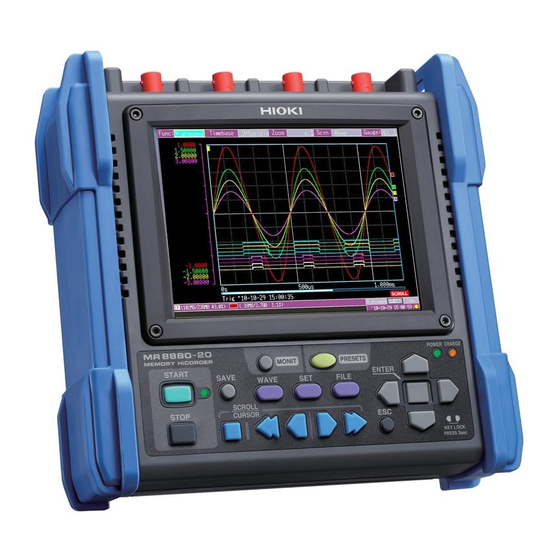
Page 32: Names And Functions Of Parts
1.2 Names and Functions of Parts 1.2 Names and Functions of Parts Front Panel Rear Panel Analog input terminals (BNC Jack) Manufacturer's Serial Number Connect optional measurement cables or clamp sensors (p. 38). Shows the serial number. Do not remove this label, as it is required for product support. - Page 33 1.2 Names and Functions of Parts Operating Keys and LED Start and stop measurement (p. 58) START POWER Start measurement. The LED at the right lights Lights when the power is turned on (p. 45). green while measuring. CHARGE STOP Lights when the Z1000 Battery Pack is Stop measurement.
-
Page 34: Screen Configuration And Display
1.3 Screen Configuration and Display 1.3 Screen Configuration and Display Monitor Screen You can check the in- put state (p. 55). PRESETS Screen (Setting Wizard) Allows you to configure the settings by follow- instructions dis- played on the screen (p. 63). - Page 35 1.3 Screen Configuration and Display Waveform Screens Wave+Set Wave+Trg The screen switches each Wave time you press the key Check the display name of the currently Wave+Calc (Five types) (p. 131). displayed screen. Use the cursor keys to switch the display. Wave+Crsr [Wave+Set] Display [Wave+Trg] Display...
- Page 36 1.3 Screen Configuration and Display Operational information is displayed along the bottom of the screen. [Wave+Crsr] Display Check the waveform and cursor value. (p. 138) Settings Screens Setting ALL CH The screen switches each time you press the key. Trig (Seven types) Comment Press the left/right cursor keys to...
- Page 37 1.3 Screen Configuration and Display [ALL CH] Screen [Trig] Screen Make settings while viewing all channel set- Set the recording conditions (trigger func- tings. tion) for each input channel (p. 110). [Comment] Screen [System] Screen Enter channel comments (p. 128). Configure the system environment (p.
- Page 38 1.3 Screen Configuration and Display File Screen File Screen View and manage files on the CF card/USB flash drive (p. 147). Drive name A:/ CF Card B:/ USB flash drive...
- Page 39 1.3 Screen Configuration and Display About the Icons Scroll Bar Clock "Setting the Date and Time"(p. 204) CF card, USB flash drive Displayed when a CF card/USB flash Power source indicator drive is inserted. The icon appears red when accessing the CF card/USB flash Indicates the Memory HiCorder’s power source drive.
- Page 40 1.3 Screen Configuration and Display...
-
Page 41: Measurement Preparations
Measurement Preparations Chapter 2 In the case of the alkaline Install the alkaline bat- battery box tery box (accessory) or In the case of the battery pack (option) if battery pack necessary (p. 32). When using a printer (option) (p. 41) Connect the printer. -
Page 42: Using The Alkaline Battery Box (Accessory) Or Battery Pack (Option)
2.1 Using the Alkaline Battery Box (Accessory) or Battery Pack (Option) 2.1 Using the Alkaline Battery Box (Acces- sory) or Battery Pack (Option) When power cannot be supplied from a commercial power supply by connecting the AC adapter, the instrument can be powered by just the supplied alkaline battery box or optional Z1000 Battery Pack. -
Page 43: Installing The Alkaline Battery Box And Replacing The Batteries
2.1 Using the Alkaline Battery Box (Accessory) or Battery Pack (Option) Installing the Alkaline Battery Box and Replacing the Batteries To be required: One Phillips screwdriver (No.2), eight LR6 alkaline batteries Screw Turn off the instrument. Disconnect the AC adapter and cables if they are connected. -
Page 44: Install The Battery Pack
2.1 Using the Alkaline Battery Box (Accessory) or Battery Pack (Option) Install the Battery Pack To be required: One Phillips screwdriver (No.2), Z1000 Battery Pack Screw Turn off the instrument. Disconnect the AC adapter and cables if they are connected. Remove the screw from the back of the Battery compartment cover instrument, and then remove the battery... - Page 45 2.1 Using the Alkaline Battery Box (Accessory) or Battery Pack (Option) Approximate continuous battery-only operating time When used at ambient temperature of 23°C after a full charge (when using battery pack) and when the LCD backlight power saving mode is OFF (initial setting) See: "Enabling and Disabling the Backlight Saver"...
-
Page 46: Charge The Battery Pack
2.1 Using the Alkaline Battery Box (Accessory) or Battery Pack (Option) Charge the Battery Pack Regardless of whether the Memory HiCorder is on or off, the battery pack recharges whenever the Z1002 AC Adapter is plugged in to a power source. Therefore, charg- ing is provided by merely keeping the battery pack installed in the Memory HiCorder. -
Page 47: Connecting The Ac Adapter
2.2 Connecting the AC Adapter 2.2 Connecting the AC Adapter Connect the power cord and the instrument to the supplied Model Z1002 AC Adapter, then plug the power cord into an outlet. When used with the battery pack installed, the battery serves as an operating backup supply in case of power failure, and the AC adapter otherwise has priority. -
Page 48: Connecting Measurement Cables To The Memory Hicorder
(p. 15). Connecting Connection Cords (to record voltage waveforms) Connect an optional Hioki Connection Cord to the analog input terminals. Use the Hioki 9322 Differential Probe if the voltage of the measurement object may exceed the Memory HiCorder’s maximum input voltage (p. 15). -
Page 49: Connecting A Clamp Sensor (To Record Current Waveforms)
2.3 Connecting Measurement Cables to the Memory HiCorder Connecting a Clamp Sensor (to record current waveforms) Connect an optional Hioki clamp sensor to the analog input terminals. Refer to the instructions provided with the clamp sensor for usage instructions. Top of instrument The scaling function needs to be set according to the clamp sensor model being used. -
Page 50: Connecting The Logic Probe (To Record Logic Signals)
2.3 Connecting Measurement Cables to the Memory HiCorder Connecting the Logic Probe (to record logic signals) Connect the optional logic probe to the LOGIC Connector. Refer to the instructions provided with the probe. Right Side Take care to ensure the con- nector is oriented correctly. -
Page 51: Connecting Printer And Loading Recording Paper (Options)
2.4 Connecting Printer and Loading Recording Paper (Options) Connect the optional MR9000 Printer Unit to the instrument. Usable recording paper: Hioki’s optional 9234 Recording Paper (112 mm wide, 18 m roll) See: "Loading the Recording Paper" (p. 42) Operating Precaution Before use, be sure to read "About the Printer"... -
Page 52: Loading The Recording Paper
2.4 Connecting Printer and Loading Recording Paper (Options) Loading the Recording Paper Load the recording paper so that the print surface is on the underside. Press the [LOCK] mark in the cen- ter of the cover until you hear a Insert the rod so that it is protrud- clicking sound. - Page 53 2.4 Connecting Printer and Loading Recording Paper (Options) Handling and Storing Recording Paper The recording paper is thermally and chemically sensitized. Observe the following precautions to avoid paper discoloration and fading. Avoid exposure to volatile Avoid exposure to organic solvents like alco- direct sunlight.
-
Page 54: Attaching The Carrying Strap
2.5 Attaching the Carrying Strap Attaching the Carrying Strap Use the strap to avoid dropping the instrument while carrying, or when you need to hang it on a hook. Attach the strap securely to the strap holes in two places on the protec- tor. -
Page 55: Turning The Power On And Off
2.6 Turning the Power On and Off 2.6 Turning the Power On and Off Before turning on the power, be sure to read "Operating Precautions" (p. 8). Verify that the instrument and peripheral devices are Turning Power On correctly connected. Turn the power switch on ( ). -
Page 56: Using Cf Card Or Usb Flash Drive (For Saving Data)
"Using a CF Card/ USB Flash Drive" (p. 19). Important Use only CF cards and USB flash drive sold by Hioki. Compatibility and performance are not guaranteed for CF cards and USB flash drive made by other manufacturers. You may be unable to read from or save data to such cards. -
Page 57: Cf Card Insertion & Removal
2.7 Using CF Card or USB Flash Drive (for Saving Data) CF Card Insertion & Removal Inserting a CF card Right side of Cover Open the CF card slot cover. instrument Press the Eject button in if it is in the released position. -
Page 58: Formatting A Cf Card/Usb Flash Drive
2.7 Using CF Card or USB Flash Drive (for Saving Data) Formatting a CF Card/USB Flash Drive This section describes how to format a CF card or USB flash drive with the instru- ment. Format a new CF card of USB flash drive before use. Select the File Screen. -
Page 59: Compensating For Input Circuit Offset (Zero Adjustment)
2.8 Compensating for Input Circuit Offset (Zero Adjustment) 2.8 Compensating for Input Circuit Offset (Zero Adjustment) Zero adjustment corrects for voltage offset at the input circuits, so that Memory HiCorder measurements are relative to zero volts. Execute zero adjustment again after a sudden change in the ambient temperature. •... - Page 60 2.8 Compensating for Input Circuit Offset (Zero Adjustment) About zero position offset of analog input circuits With this instrument, the zero position may be off- Error (%f.s.) set in a high sensitivity range (10-mV/div range, etc.). Furthermore, the accuracy of the instrument is guaranteed under the condition that the instru- ment has been warmed up for at least 30 minutes.
-
Page 61: Basic Operating Procedures
Pre-Operation Inspection Before using the instrument the first time, verify that it operates normally to ensure that no damage occurred during storage or shipping. If you find any damage, contact your dealer or Hioki representative. Peripheral Device Inspection Metal Exposed... -
Page 62: Measurement Flow
3.2 Measurement Flow 3.2 Measurement Flow 1. Preparations for Measurement (p. 31) Before beginning the preparations, be sure to read "Operating Precau- tions" (p. 8) and "3.1 Pre-Operation Inspection" (p. 51). Install the batteries or Connect the AC adapter (p. 37) battery Pack (p. - Page 63 3.2 Measurement Flow 2. Viewing Input State (Monitor) (p. 55) The current input state can be confirmed as a waveform and numerical values. 3. Settings(p. 67) Configure the settings using the setting procedure that matches the purpose of mea- surement. Configuring settings Configuring settings Loading setting...
- Page 64 3.2 Measurement Flow 4. Starting and Stopping Measurement (p. 58) Press the START key. Start Record once, and stop. (default setting) Stop Measurement [Repeat: Single] Measure- ment Record repeatedly. [Repeat: Repeat] Press the STOP key. The start and stop operations differ depending on the set conditions. See: "About Measuring Operation"...
-
Page 65: Basic Operation
3.3 Basic Operation 3.3 Basic Operation Checking Input State (Monitor) The current input state and display range can be checked on the Monitor screen regardless of whether or not measurement has started. How- ever, the data will not be acquired to the internal buffer memory of the instrument if measurement has not started. - Page 66 3.3 Basic Operation The input signal is displayed as follows when it exceeds the possible measurement range of the set measurement range. • Measurement waveform: The data that exceeds the possible mea- surement range is displayed in white when the screen background is black, and in black when the screen background is white.
-
Page 67: Configuring Settings (Changing Settings)
3.3 Basic Operation Configuring Settings (Changing Settings) The settings items can be changed. Changing screen contents Select the item to change. Show available setting options. Setting Screen Select the desired setting. Apply the new setting, or cancel it. Waveform Screen There are three procedures available for configuring the settings depending on the purpose of use. -
Page 68: Starting And Stopping Measurement
3.3 Basic Operation Starting and Stopping Measurement Start measurement so that the data is acquired to the internal buffer memory. Start Measurement Press the START key. (The green LED lights.) is displayed on the screen during measurement. [Storing...] When measuring using the trigger function, the timing for starting measurement and starting recording (starting acquiring of data to in- ternal buffer memory) differs. - Page 69 3.3 Basic Operation About Measuring Operation The operation differs depending on the measurement function (high speed or real time) and setting conditions. Press START key or wait until scheduled start time Press STOP key or wait until scheduled end time Continuous Repeat Recording [Repeat]...
-
Page 70: Viewing Measurement Results (Scrolling Waveforms & Displaying Measurement Values)
3.3 Basic Operation Viewing Measurement Results (Scrolling Waveforms & Display- ing Measurement Values) Scrolling a waveform Switch to [Scroll] display. Scroll Scroll forward. backward. See: "Scrolling Waveforms" (p. 132) Reading values at cursors Switch to [Cursor] display. Move the A/B cursors. Values at cursor positions can be read numerically. -
Page 71: Saving Data
3.3 Basic Operation Saving Data Measurement data, settings, screen images and numerical calculation results can be saved. For details of the saving methods, see "Chapter 6 Managing Data" (p. 147). (Default settings) Saving Method: [Select & Save] (Press the key to select and save data.) SAVE Select the items to be saved, and Press the... -
Page 72: Printing Data
3.3 Basic Operation Printing Data The measurement data can be printed with an optional printer. See: About connecting the printer and loading the recording paper "2.4 Connecting Printer and Loading Recording Paper (Options)" (p. 41) Various Printing Methods: "Chapter 7 Printing" (p. 165) (When default settings) The measurement data is Press the... -
Page 73: Measurement Using Setting Wizard (Presets Key)
3.4 Measurement Using Setting Wizard (PRESETS key) 3.4 Measurement Using Setting Wizard (PRESETS key) You can configure settings and perform measurement by following instructions dis- played on the screen. Basic Guide Measurement Guide Loading Settings Configuring settings by Select application and Load setting following instructions configure settings... -
Page 74: Selecting Application And Configure Settings (Measurement Guide)
3.4 Measurement Using Setting Wizard (PRESETS key) High-speed Function Real-time function Set the start trigger. Set the trigger. Set the stop trigger. Set the pre-trigger and repeat measurement. Start measurement Selecting Application and Configure Settings (Measurement Guide) Select Apply Select the purpose of use. Configure the settings to match the setting items on the screen. -
Page 75: Loading Setting Configuration Data
3.4 Measurement Using Setting Wizard (PRESETS key) Examples of other settings screens [Measurement Guide] Loading Setting Configuration Data Select Apply Select the load destination. Select the data to load from the list. Load the data • With PRESETS, all settings are applied by performing a series of opera- tions to the end. - Page 76 3.4 Measurement Using Setting Wizard (PRESETS key)
-
Page 77: Setting The Measurement Conditions
4.1 Flow of Configuring Settings Individually Setting the Measurement Conditions (When you want to Chapter 4 customize the settings) 4.1 Flow of Configuring Settings Individually Configuring settings individually Load the setting configuration data (p. 157) Setting configuration data that has been saved in advance to the instrument or a CF card/USB flash drive can be loaded. -
Page 78: Recording Methods (Measurement Functions)
This measurement function is equivalent to This measurement function is equivalent to the Memory Recorder function of previous the Recorder function of previous Hioki Mem- Hioki Memory HiCorder models. ory HiCorder models. (*). Printing may not be possible at the same time de- pending on the setting for the horizontal axis. - Page 79 4.2 Recording Methods (Measurement Functions) Differences in operation by function High-speed Function Real-time Function Differences in internal operation Sampling is performed at low speed so Sampling is performed at high speed so the waveform is displayed and the data the data is first stored in the internal buf- is saved to the storage media and print- fer memory.
-
Page 80: Using High-Speed Function (Instantaneous Recording)
4.3 Using High-speed Function (Instantaneous Recording) 4.3 Using High-speed Function (Instantaneous Recording) This function is suitable for recording, for example, instantaneous waveforms of a power supply and the starting current of a motor. Set the recording conditions on the [Setting] screen. -
Page 81: Setting The Horizontal Axis (Time Base Range)
4.3 Using High-speed Function (Instantaneous Recording) Setting the Horizontal Axis (Time Base Range) Two setting procedures are available: setting the time Time per division per division of the horizontal axis and setting the data acquisition interval. • When setting the time per division of the horizontal axis The data of 100 samples is included in 1 division. - Page 82 4.3 Using High-speed Function (Instantaneous Recording) Set the data acquisition interval Select the [Setting] screen. Press the ENTER key at the [Time- base] position. Select from the setting options of [Interval]. Select from the setting options of [Interval]. (Open/confirm the setting information.) The setting can also be ∗...
- Page 83 4.3 Using High-speed Function (Instantaneous Recording) Recording Interval and Selection Range : Selectable, X: Not selectable Interval Horizontal μ axis (/div) 100 200 500 μ μ μ μ μ μ 100 ms 200 ms 500 ms...
-
Page 84: Setting Recording Length (No. Of Divisions)
4.3 Using High-speed Function (Instantaneous Recording) Setting Recording Length (no. of divisions) Set the recording length in units of display divisions. Recording length Recording time = timebase (s/div) x recording length (div) An arbitrary value up to 10,000 can be set. 15 divisions Select the [Setting]... -
Page 85: Set The Recording Length For Repeated Or One-Time Recording
4.3 Using High-speed Function (Instantaneous Recording) Set the Recording Length for Repeated or One-time Recording Set recording to be performed once or repeatedly for Repeated recording the set recording length portion. If you want to record only when the desired condi- tions are met, the trigger settings also need to be Recording only once configured. -
Page 86: Configuring Settings Automatically (Auto Range)
4.3 Using High-speed Function (Instantaneous Recording) Configuring Settings Automatically (Auto Range) Auto Range can only be set when the High-speed Function is used. When you do not know how to determine the range for the input signal, you can set the range automatically (Auto Range) on the Waveform screen or [CH] screen or in... - Page 87 4.3 Using High-speed Function (Instantaneous Recording) Auto Range Settings Setting Item Settings [Timebase](*) Timebase Auto setting value Automatically displays 1 to 2.5 cy- cles on the Waveform screen. [Zoom] Zoom (magnification) Settings for CH1 to CH4 [Mode] Instantaneous value [Range] Voltage-axis range Auto setup value [0 Pos]...
-
Page 88: Using Real-Time Function (Fluctuation Recording)
4.4 Using Real-time Function (Fluctuation Recording) 4.4 Using Real-time Function (Fluctuation Recording) This function is suitable for monitoring the control voltage, recording fluctuations in the effective value of a power line, etc. over a long period of time. Set the recording conditions on the [Setting] screen. -
Page 89: Setting The Interval For The Data To Record (Recording Interval)
4.4 Using Real-time Function (Fluctuation Recording) Setting the Interval for the Data to Record (Recording Interval) Set the interval for acquiring data Select the data acquisition interval to suit your mea- surement objectives. If a short recording interval is selected, the recording : Measurement data time for which data can be stored in the internal buffer memory will be short. - Page 90 4.4 Using Real-time Function (Fluctuation Recording) Recording Interval and Selection Range Selectable, X: Not selectable Δ Only selectable when envelope is Off, : Display is not possible during measurement Interval μs Time/div 100 200 500 1 5 10 20 50 100 200 500 1 5 10 20 30 Δ...
-
Page 91: Setting The Recording Time
4.4 Using Real-time Function (Fluctuation Recording) Setting the Recording Time Specify how you want recording to start and stop. Start Stop The following methods are available. Measurement Measurement Continuous Recording • Recording continuously: Record continuously from when recording is started until when the STOP key is pressed or the stop condition is met. - Page 92 4.4 Using Real-time Function (Fluctuation Recording) Recording for Specified Recording Time Select the [Setting] screen. [Cont] [Off]. (Open/confirm the setting information.) Specify the duration of one recording length (time span). ∗ Setting options ( . default setting) Change 1’s digit d (days) h (hours) 694),...
-
Page 93: Setting The Repeat Operation (Repeat Measurement Or Single Measurement)
4.4 Using Real-time Function (Fluctuation Recording) Setting the Repeat Operation (Repeat Measurement or Single Measurement) Set whether to resume recording after recording for the Repeated recording set recording time or when the condition for stopping recording using the trigger function is met (stop trigger condition is met). -
Page 94: Retaining Records Of Maximum And Minimum Values (Envelope)
4.4 Using Real-time Function (Fluctuation Recording) Retaining Records of Maximum and Minimum Values (Envelope) The maximum and minimum values within the recording interval are calculated from data oversam- pled at maximum sampling speed (1 MS/s), and recorded for each recording interval. Therefore, recording without missing the peak of fluctuation will be possible even if a long recording interval is set. - Page 95 4.4 Using Real-time Function (Fluctuation Recording) Envelope Values Recording One sampling data for during interval [Envelope] recording consists of two data items, the maximum Maximum value value and minimum value, of the measurement values ob- Minimum tained as a result of performing value oversampling during the set re- cording interval.
-
Page 96: Setting The Input Conditions
4.5 Setting the Input Conditions 4.5 Setting the Input Conditions Configure the input channel settings on the [CH] screen. You can configure various settings while viewing the monitor display on the Setting screen. Configure the settings as Set the input channel necessary Set the low-pass filter (p. - Page 97 4.5 Setting the Input Conditions Select the [CH] screen. Select the channel to set from [Channel]. (Open/confirm the setting information.) In the following steps, use the same operation to con- figure settings. Select the type of value to record from [Mode].
-
Page 98: Selecting A Low-Pass Filter (L
4.5 Setting the Input Conditions Selecting a Low-Pass Filter (L.P.F.) When you want to eliminate excess high-frequency components such as frequencies higher than the waveform you want to measure, select a cut-off frequency. Normal Display Cut-Off Frequen- (Off) cy Selected Select the [CH] screen. -
Page 99: Setting The Screen Display
4.6 Setting the Screen Display 4.6 Setting the Screen Display The screen display of recording data can be changed. The screen display can also be changed for a recorded waveform before measurement. Expanding and Compressing in the Horizontal Axis (Time Axis) Direction The waveform display can be expanded and com- pressed in the horizontal axis direction. - Page 100 4.6 Setting the Screen Display When High-speed Function (Interval Setting) and Real-time Function Change the time per division of the horizontal axis Select the [Setting] screen. Select from the setting options of [Time/div]. (Open/confirm the setting information.) ∗ Setting options ( .
-
Page 101: Setting Display Range In Vertical Axis Direction
4.6 Setting the Screen Display Setting Display Range in Vertical Axis Direction You can change the display range in the vertical axis direction of each waveform. There are two ways to change the display range. • Setting the display magnification and the display position of 0 V (zero position) of the waveform (p. - Page 102 4.6 Setting the Screen Display Setting the Display Range of the Waveform with the Magnification and 0 V Position Select the [CH] screen. Select [Pos (Position)] from [Type] of the display range. (Open/confirm the setting information.) In the following steps, use the same operation to con- figure settings.
- Page 103 4.6 Setting the Screen Display Setting the Display Range of the Waveform with the Upper and Lower Limit Values Select the [CH] screen. Select [Up/Lwr] from [Type] of the display range (Disp Span). (Open/confirm the setting information.) In the following steps, use the same operation to con- figure settings.
-
Page 104: Setting The Display Format (Screen Splitting/Synthesis/Graph Assignment)
4.6 Setting the Screen Display Setting the Display Format (Screen Splitting/Synthesis/Graph Assignment) You can split the screen into multiple graphs, and then assign the waveform to display in each graph. This set- ting can also be changed after the waveform has been Dual Single acquired. - Page 105 4.6 Setting the Screen Display When [Dual] [Quad] is selected in [Format] Select the [CH] screen. Select from the setting options of [Graph]. (Open/confirm the setting information.) You can also select the [All Setting options screen. Gr1, Gr2, Gr3, Gr4 The default setting varies depending on the display format and channel.
-
Page 106: Setting Waveform Display Colors & Turning On/Off Display
4.6 Setting the Screen Display When Real-time Function: Screen Splitting Select the [Setting] screen. Select from the setting options of [Format]. (Open/confirm the setting information.) ∗ Setting options ( . default setting) ∗ Single , Dual, Quad Select the [CH] screen. -
Page 107: Converting Measurement Values (Scaling Function)
4.6 Setting the Screen Display Converting Measurement Values (Scaling Function) Input voltage values can be converted to physical units for display, such as by converting voltage to current. Preset scaling settings are provided for cur- Scaling Enabled Normal rent measurement with the optional clamp sensor Display (Off) models. - Page 108 4.6 Setting the Screen Display [Ratio] Units (eu) Convert by specifying the ratio of physical units per volt of input sig- nal (conversion ratio), offset, and the name of the units. Slope (Conversion ratio: eu/v) (The unit can be set with up to 7 Offset single-byte characters.) [2-Point]...
- Page 109 4.6 Setting the Screen Display [Rate] Select the output rate (conversion ratio) of the clamp sensor or the voltage divider ratio of the voltage divid- er probe. Setting options Clamp 1V ->10mA Clamp 1V -> 50A Clamp 1V -> 1000A Clamp 1V ->100mA Clamp 1V ->...
-
Page 110: Setting Logic Channel Display Colors
4.6 Setting the Screen Display Setting Logic Channel Display Colors You can select a display color for each logic channel waveform. Select the [All CH] screen. Select from the setting options of waveform display colors. (Open/confirm the setting information.) The setting can also be changed on the Waveform screen Setting options ([Wave+Set] display) and [CH]... -
Page 111: Setting The Recording Width Of Logic Waveforms
4.6 Setting the Screen Display Setting the Recording Width of Logic Waveforms You can change the display width in the vertical axis direction of logic waveforms. When there are, for example, many waveforms, mak- ing the display width narrow makes them easier to see. Select the [All CH] screen. -
Page 112: Setting Automatic Saving
4.7 Setting Automatic Saving 4.7 Setting Automatic Saving Data can be automatically saved to external storage media (CF card or USB flash drive). The save operation differs depending on the function. High-speed Function Real-time Function (Automatic saving) (Real-time saving) Sampling is performed at high speed so Sampling is performed at low speed so the data is first stored in the internal buffer the data is saved automatically to the... - Page 113 4.7 Setting Automatic Saving 1. Waveform data File Function Selection Option Description Extension After the specified recording length portion is acquired to Waveform (after .MEM the internal buffer, the waveform data is saved in binary meas.) *1 format. Highspeed After the specified recording length portion is acquired to CSV (after meas.) the internal buffer, the waveform data is saved in CSV .CSV...
- Page 114 If deletion is not possible, saving stops. A file other than a waveform file is not applicable for deletion. (Numerical calculation file, setting configuration file, file created with other than MR8880-20, etc.)
- Page 115 4.7 Setting Automatic Saving With [Split Save] set to [On] Select whether to save data into multiple files (Set [Split Save]) (Real-time Function only). Select single (per measurement) or multiple (timed) file creation. ∗ Setting options ( . default setting) Also set the [Split Len (length)].
-
Page 116: Replacing Cf Card Or Usb Flash Drive During Saving ([Realtime] Only)
4.7 Setting Automatic Saving Replacing CF Card or USB Flash Drive during Saving ([Realtime] only) When the Real-time Function is used, a CF card or USB flash drive can be replaced during real-time saving without stopping measurement. This section describes how to replace a CF card. - Page 117 4.7 Setting Automatic Saving • Data equivalent to half the internal buffer memory will be stored after "Yes" is selected in the "Do you want to remove the CF card/USB memory? message. Replace the CF card or USB flash memory within the time required to complete this action.
-
Page 118: Setting Automatic Printing
4.8 Setting Automatic Printing 4.8 Setting Automatic Printing Data can be printed automatically when you use the optional printer (auto print). The operation differs depending on the function (high speed/real time). See: "Recording Methods (Measurement Functions)" (p. 68) High-speed Function Real-time Function (Auto print) (Real-time print) - Page 119 4.8 Setting Automatic Printing Select the [Print] screen. This is displayed only when the printer is connected. The item name differs depending on the function. Select the print items from [Auto print] [Realtime print]. (default setting: Off) (Open/confirm the setting information.) When High-speed Function [Auto print] ∗...
-
Page 120: Recording Using Specific Conditions (Trigger Function)
4.9 Recording Using Specific Conditions (Trigger Function) 4.9 Recording Using Specific Conditions (Trigger Function) You can apply specific conditions to start and stop measurement. In the case of [Highspeed], only the condition for starting measurement can be applied. When these specific conditions are applied for measurement, the trigger function is used. -
Page 121: Enabling The Trigger Function
4.9 Recording Using Specific Conditions (Trigger Function) Enabling the Trigger Function The trigger function is disabled (Off) when the instrument is shipped from the factory or the settings are restored to the default settings. Before setting trigger conditions, enable the trigger function (On). The trigger can be enabled in the [Wave+Trg] display,... - Page 122 4.9 Recording Using Specific Conditions (Trigger Function) Types of trigger for which [Timing] can be set ● : Selectable, X: Not selectable Timing Start Stop ● ● Analog input signal CH1 to CH4 ● ● Logic input signal LA1 to LA4, LB1 to LB4 ●...
-
Page 123: Setting And/Or Trigger Application Conditions
4.9 Recording Using Specific Conditions (Trigger Function) Setting AND/OR Trigger Application Conditions The relation between each trigger source can be set. This is only valid for channels for which triggers have been set. This can be set on the [Trig] screen and [Wave+Trg] display. Select the [Trig] screen. - Page 124 4.9 Recording Using Specific Conditions (Trigger Function) Block Diagrams of Trigger Application Conditions (AND/OR) When the [OR] trigger application condition is selected, the change point (edge) when each trigger source changes from unmet to met is detected. START/ STOP In accordance with the logic trig- External trigger ger application condition.
-
Page 125: Recording Data Before Trigger Applied (Pre-Trigger)
4.9 Recording Using Specific Conditions (Trigger Function) Recording Data Before Trigger Applied (Pre-trigger) It is possible to record not only the waveform after the trigger is applied but also the waveform before the trigger is applied. The options that can be set differ depending on the function. -
Page 126: Setting The Trigger Type For Analog Input Signals
4.9 Recording Using Specific Conditions (Trigger Function) Setting the Trigger Type for Analog Input Signals Set the trigger type and conditions. The options that can be set differ depending on the trigger type. This can be set on the [Trig] screen, [CH] screen, and [Wave+Trg] display. Select the [Trig] screen. -
Page 127: Applying A Trigger At A Specified Value (Level Trigger)
4.9 Recording Using Specific Conditions (Trigger Function) Applying a Trigger at a Specified Value (Level Trigger) You can specify the desired signal level (level) and Level the direction (slope) of change of the input signal in order to apply a trigger. The options that can be set differ depending on the function. - Page 128 4.9 Recording Using Specific Conditions (Trigger Function) [Filt (filter)]. A trigger is applied when the application condi- tion of the trigger is met in the period of the set [Filt]. This is effective for preventing incorrect opera- tion caused by noise. The options that can be set differ depending on the function.
-
Page 129: Applying A Trigger Using Range Specified By Upper & Lower Limit Values (Window Trigger)
4.9 Recording Using Specific Conditions (Trigger Function) Applying a Trigger Using Range Specified by Upper & Lower Limit Values (Window Trigger) Measurement starts or stops when the input signal enters (IN) or exits (OUT) a range defined by upper and lower limit values. You can check the upper and lower limit values on the [CH] screen. -
Page 130: Detecting Instantaneous Power Failure Of Commercial Power Supply (Voltage Drop Trigger) (High-Speed Function Only)
4.9 Recording Using Specific Conditions (Trigger Function) Detecting Instantaneous Power Failure of Commercial Power Supply (Voltage Drop Trigger) (High-speed Function only) Detect an instantaneous voltage drop for the mea- 1/2 Period surement target of a commercial power supply (50/ 60 Hz). A trigger is applied when the voltage peak is below the set level for 1/2 a cycle or more. -
Page 131: Monitoring Commercial Power Supply (Waveform Judgment Trigger) (High-Speed Function Only)
4.9 Recording Using Specific Conditions (Trigger Function) Monitoring Commercial Power Supply (Waveform Judgment Trigger) (High-speed Function only) Apply a trigger when the measurement data Control range goes out of the set judgment range for a mea- surement target that is a commercial power sup- ply (50/60 Hz) (Waveform Judgment Trigger). - Page 132 4.9 Recording Using Specific Conditions (Trigger Function) Select the waveform to be the judgment reference in [Ref]. ∗ Setting options ( . default setting) Sine* Uses the ideal waveform based on the set frequency and reference voltage as [Prev. (Previous waveform)] the reference.
- Page 133 4.9 Recording Using Specific Conditions (Trigger Function) The waveform judgment trigger is specialized for the application of monitoring commercial power supplies. The comparison with the reference waveform begins from the point at which 0 V is crossed. Therefore, trigger judgment cannot be made correctly if, for exam- ple, a waveform for which 0 V is not crossed or a noise waveform is input.
-
Page 134: Applying Trigger With Logic Input Signal (Logic Trigger)
4.9 Recording Using Specific Conditions (Trigger Function) Applying Trigger with Logic Input Signal (Logic Trigger) Specify a signal level (pattern) of the logic input signal in order to apply a trigger. The options that can be set differ depending on the function. This can be set on the [Trig] screen, [CH] screen, and [Wave+Trg] display. - Page 135 4.9 Recording Using Specific Conditions (Trigger Function) [Filt (filter)]. A trigger is applied when the application condition of the trigger is met within the period of the set [Filter]. This is effective for preventing incorrect operation caused by noise. The options that can be set differ depending on the function.
-
Page 136: Applying Trigger At Fixed Time Interval (Interval Trigger)
4.9 Recording Using Specific Conditions (Trigger Function) Applying Trigger at Fixed Time Interval (Interval Trigger) You can apply a trigger at a fixed time interval. This can be set on the [Trig] screen. Select the [Trig] screen. [Intvl. (interval)] to [On]. (Open/confirm the setting information.) Change 1’s digit In the following steps, use the same operation to configure... -
Page 137: Applying Trigger With External Input Signal (External Trigger)
4.9 Recording Using Specific Conditions (Trigger Function) Applying Trigger with External Input Signal (External Trigger) You can apply a trigger by inputting a signal from an external source. This also enables the synchronous operation of multiple instruments by parallel triggering (p. 226). -
Page 138: Entering Comments And Titles
4.10 Entering Comments and Titles Entering Comments and Titles 4.10 Comments of up to 40 characters can be entered as a title for the measure- ment data, and as a label for each input waveform. Titles and comments are displayed on the waveform screen. They are also printed when the data is printed with an optional printer (p. - Page 139 4.10 Entering Comments and Titles You can also select from the pick list Move to the pick list (List) Select from the pick list. Apply The control panel supports operation key in- ([OK]) put. The input field is confirmed, and the previous setting screen reappears. Operating Panel The operating panel depicts the functions of Memory HiCorder's operating keys.: List...
-
Page 140: Printing The Title And Comments
4.10 Entering Comments and Titles Printing the Title and Comments You can print the set title and comments at the same time as the measurement waveform. Select the [Comment] screen. Select the items you want to print in [Print items]. (Open/confirm the set- ting information.) ∗... -
Page 141: Chapter 5 Waveform Analysis
5.1 Observing Waveforms Waveform Analysis Chapter 5 5.1 Observing Waveforms View data during and after measuring on the Waveform Screen. Displaying Waveforms (Display Descriptions) Press the WAVE key to display the Waveform screen. Repeated key presses cycle the screen through seven types. The settings can be changed. -
Page 142: Scrolling Waveforms
5.1 Observing Waveforms Scrolling Waveforms When measuring or displaying an existing waveform, use the SCROLL/CURSOR keys to scroll. Later Earlier Screen Display [Highspeed] During Roll Mode display,* manually scrolling a waveform terminates the Roll Mode, so you can freely view any part of the measured waveform. To return to Roll Mode, move the cursor to [Trace] near the bottom right corner of the display, and press the ENTER... -
Page 143: Verifying Waveform Display Position
5.1 Observing Waveforms Verifying Waveform Display Position From the scroll bar you can verify the relative position and Whole Waveform size of the displayed portion of a waveform within the over- all measured waveform. Furthermore, the trigger time, trigger position, and posi- tions of cursors A and B (when using the vertical cursors Screen Display Range and trace cursors) are also displayed. -
Page 144: Displaying Gauges
5.1 Observing Waveforms Displaying Gauges A gauge corresponding to the measurement range of each channel can be displayed at the left side of the screen, for confirming measurement values. The color of the gauge matches the waveform display color of its input channel. Gauge Select from the set- ting options of... -
Page 145: Magnifying And Compressing Horizontally
5.1 Observing Waveforms Magnifying and Compressing Horizontally Data details can be observed by magnifying the waveform along the time axis. Also, by compressing the time axis, overall waveform fluctuations can be readily seen. When the A/B cursors are displayed in [Cursor] display, magnification can be set according to cursor position (but... - Page 146 5.1 Observing Waveforms High-speed Function (when [Interval] setting) Real-time Function Change the time per division of the horizontal axis Select from the setting options of [Time/div]. (Open/confirm the setting information.) ∗ Setting options ( . default setting) ∗ [Highspeed] 10μs, 20μs, 50μs, 100μs , 200μs, 500μs, 10ms, 20ms, 50ms, 100ms, 200ms, 500ms, 1s, 2s, 5s, 10s, 30s,...
-
Page 147: Viewing Any Waveform Location (Jump Function)
5.1 Observing Waveforms Viewing Any Waveform Location (Jump Function) When the recording length of a waveform is long, you can specify the portion to be displayed immediately. This is only enabled when measurement is stopped. [Jump] changes to [Trace] during measurement (p. 132). -
Page 148: Displaying Cursor Values
5.1 Observing Waveforms Displaying Cursor Values Time difference and potential difference (and when scaling is enabled, scaling values) can be read as numerical values using the A/B cursors. Switch to [Cursor] display. Cursor Values (To hide the cursor items again, press the SCROLL/ CURSOR key.) - Page 149 5.1 Observing Waveforms About Cursor Values Cursor Type Example Cursor Value Displays the time and measurement values at the A/B cur- sors, or the time and measurement differences between the A/B cursors. Trace Displays the intersections (trace points) of cursors and wave- Cursors forms.
-
Page 150: Specifying A Waveform Time Span
5.1 Observing Waveforms Specifying a Waveform Time Span Specify a waveform time span when saving a partial wave- form or applying numerical calculations (Trace cursors or Vertical cursors). Switch to [Cursor] display. Select the cursor you want to [Move] move from [Move]. -
Page 151: Marking Waveforms And Searching Marks (Search Function)
5.2 Marking Waveforms and Searching Marks (Search Function) 5.2 Marking Waveforms and Searching Marks (Search Function) You can insert up to 100 event marks at any point while measur- ing, to help find them later. See: "Searching Event Marks" (p. 143) Event marks can be applied by the following methods. -
Page 152: Inserting Event Marks Using External Input Signals
5.2 Marking Waveforms and Searching Marks (Search Function) Inserting Event Marks Using External Input Signals Event marks can be inserted by applying external input signals. Make this setting before starting measurements. Select the [System] screen. Select [Event] from the selection options of [External Trig In]. -
Page 153: Searching Event Marks
5.2 Marking Waveforms and Searching Marks (Search Function) Searching Event Marks Any event mark can be found by searching. Select the [Wave+Set] display. For the [MoveNo.] setting, select the number of the event you want to find. (Open/confirm the setting information.) Select [Move]. -
Page 154: Viewing Events In Text Format (Csv)
5.2 Marking Waveforms and Searching Marks (Search Function) Viewing Events in Text Format (CSV) If you save measurement data in text format, event numbers are inserted beside the measurement data. This enables you to extract only the data with marks when per- forming analysis on a computer. -
Page 155: Synthesizing Waveforms (X-Y Synthesis)
5.3 Synthesizing Waveforms (X-Y Synthesis) 5.3 Synthesizing Waveforms (X-Y Synthesis) Up to four measured waveform data can be synthe- sized in any channel combination ([Highspeed] only). You can also specify a waveform range and then per- form synthesis (partial synthesis). When you want to perform synthesis during measure- ment, configure the settings on the setting screen before measurement (p. -
Page 156: Synthesizing Part Of The Data
5.3 Synthesizing Waveforms (X-Y Synthesis) Synthesizing Part of the Data Select the [Setting] screen. Select [Single], [Dual], or [Quad] from the setting options of [Format]. Apply Select the [Wave] display. Switch to [Cursor] display. Select the range with cursors A and B (p. 140). (Specify the range with the trace or vertical cursors.) Specify the positions of the cursors in other than the XY screen. -
Page 157: Chapter 6 Managing Data
6.1 Saving & Loading Data Chapter 6 Managing Data The instrument measurement data can be saved to an optional CF card or USB flash drive. See: "2.7 Using CF Card or USB Flash Drive (for Saving Data)" (p. 46) Furthermore, the data saved to a CF card or USB flash drive can be loaded into the instrument. -
Page 158: About File Types & Saving/Loading
6.1 Saving & Loading Data About File Types & Saving/Loading : Available/ X: Not Available Save Load File Name*5 File File Type Folder Name (Auto-numbered Format from 1) Setting Binary CONFIG CONF0001.SET Conditions (Setting list) Binary LIST0001.BDL CONFIG (Schedule Binary LIST0001.RSV CONFIG Settings) -
Page 159: Preparations And Settings For Power Outages During Long-Term Measurements
• If storage media that is not a genuine Hioki CF card or damaged stor- age media is used, files may fail to close within the allotted time, and data may be lost. -
Page 160: Saving Data
6.2 Saving Data 6.2 Saving Data Basically, three methods are available for saving. To save immediately To save automatically To save selected upon pressing the SAVE while measuring contents Auto Save (p. 102) Quick Save (p. 154) Select & Save (p. 152) Before saving, select the (default setting) Set this before starting mea-... - Page 161 6.2 Saving Data When [Quick Save] and [Select & Save] (Real-time Function) • [Quick Save] [Select & Save] can save the data remaining in the internal buffer memory (up to the last 1 Mword). If you want to save data that exceeds 1 Mword, [Cont (Continuous Recording)]...
-
Page 162: Selecting & Saving Data With The Save Key [Select&Save]
6.2 Saving Data Selecting & Saving Data with the SAVE Key [Select&Save] If you press the SAVE key, you can select save options and then save the data. This is enabled when the SAVE key setting is set to [Select & Save]. - Page 163 6.2 Saving Data Select [Waveform], and press the Select [Screen Image] [Calc ENTER key. Results], and press the ENTER key. Select the save format and Select [Yes] in the confirmation dia- range, select [Save], and press log, and press ENTER. ENTER key.
-
Page 164: Saving Immediately With The Save Key [Quick Save]
6.2 Saving Data Saving immediately with the SAVE Key [Quick Save] If you set the save options in advance, you will be able to save data quickly accord- ing to the preset save options when you press the SAVE key. This is enabled when SAVE key setting is set to [Quick... - Page 165 6.2 Saving Data (When [Waveform] is selected for [Save Type]) Select the waveform range to save from [Span]. ∗ Setting options ( . default setting) ∗ Save all measured waveform data. Save waveform data between A/B cursors. (This is only enabled when cursors A and B are displayed on the screen.) Before saving a partial waveform, specify the span to be saved (p.
-
Page 166: Saving Setting Configuration Data
6.2 Saving Data Saving Setting Configuration Data Setting configurations can be saved as data files and later reloaded into the HiCorder when you need to make more measurements with the same settings. Up to ten setting configurations can be saved to internal memory, and more can be stored on the removal storage device. -
Page 167: Loading Data On The Hicorder
6.3 Loading Data on the HiCorder 6.3 Loading Data on the HiCorder Previously stored binary waveform data, captured screen images and saved setting configurations can be reloaded into the HiCorder (p. 147). Loading a Setting Configuration Setting configurations saved in the HiCorder's memory or on a removable storage can be reloaded. - Page 168 6.3 Loading Data on the HiCorder To load the setting configuration data automatically: Method 1. Loading from instrument memory Open the screen for loading the setting configuration. (Up to step 3 on the previous page) Specify the number of the setting configuration want to load automatically...
-
Page 169: Loading Waveform Data And Screen Images
6.3 Loading Data on the HiCorder Loading Waveform Data and Screen Images Saved binary waveform data and screen images can be reloaded in the HiCorder. Select the File screen. The contents of the removable storage are displayed. Select a file to load. After selecting a folder by pressing ENTER, Displays the child folder. -
Page 170: Data Management
6.4 Data Management 6.4 Data Management You can manage data stored on a removable storage in the HiCorder • Format removable storage (p. 48) • Load a file (when the file is selected) (p. 157) • Move displayed folders (when the folder is selected) (p. 160) •... -
Page 171: Deleting Data
6.4 Data Management Deleting Data You can delete the files and folders on a CF card and USB flash drive. When the file you want to delete is not displayed on the screen See: "Switching Removable Storage" Select the File screen. ( p. -
Page 172: Renaming Files And Folders
6.4 Data Management Renaming Files and Folders Folders and files on a removable storage can be renamed. File names may consist of up to 26 regular characters. When the file you want to rename is not displayed on the screen Select the File screen. -
Page 173: Sorting Files
6.4 Data Management Sorting Files Files can be sorted in ascending or descending order according to a selected sort key. Select the File screen. Apply The control dialog box appears. Select [Sort]. Apply Select the key on which to sort. Apply Execute the sort. - Page 174 6.4 Data Management...
-
Page 175: Chapter 7 Printing
Chapter 7 Printing You can use the optional printer to print measurement data and display screens. Manual print (after measurement) Auto print ( p. 108) ( p. 166) Print the waveform during measure- Partial print. ( p. 167) ment. (The initial setting of auto print Specify the range to print. -
Page 176: Printing Waveform After Measurement (Manual Print)
7.1 Printing Waveform after Measurement (Manual Print) 7.1 Printing Waveform after Measurement (Manual Print) Press the PRINT key while the waveform screen is displayed, select the print range and type, and then print the waveform. Printable Waveforms • Waveforms saved to the internal buffer memory after measurement •... -
Page 177: Specifying The Range To Print (Partial Print)
7.1 Printing Waveform after Measurement (Manual Print) Specifying the Range to Print (Partial Print) You can specify the range of the waveform to print with cursors A and B. Press the WAVE key to display the waveform of the part you want to print waveform display... -
Page 178: Printing The Screen Display (Screen Hardcopy)
7.2 Printing the Screen Display (Screen Hardcopy) 7.2 Printing the Screen Display (Screen Hardcopy) You can print the information displayed on the screen. Display the information you want to print on the screen. (Waveform screen, settings screen, file screen, monitor screen, PRESETS screen) -
Page 179: Printing The Setting Information (List Print)
7.3 Printing the Setting Information (List Print) 7.3 Printing the Setting Information (List Print) You can print a list of the settings for the measurement data read to the internal buffer memory after measure- ment. Display a screen other than the waveform screen or file screen. -
Page 180: Print Examples
7.4 Print Examples 7.4 Print Examples Trigger date and time Function name Timebase Gauge Indicates the timing at which the dis- play settings were changed during Time value Channel information measurement. Event mark... -
Page 181: Various Print Settings
7.5 Various Print Settings 7.5 Various Print Settings You can add a grid to a waveform and print the channel number or a comment and other information. The [Print] tab is added to the settings screen when you connect a printer. The information printed for the horizontal axis is the same as that of the screen dis- play ( p. -
Page 182: Setting The Grid Type
7.5 Various Print Settings Setting the Grid Type You can set the type of grid to print on the recording paper. Select the [Print] screen. Select from the setting options of [Grid type]. (Open/confirm the setting information.) ∗ Setting options ( . -
Page 183: Setting The Print Density
7.5 Various Print Settings Setting the Print Density You can set the density for printing to recording paper to one of three levels. Setting the print density to a low level will reduce power consumption and increase the length of time that the batteries can be used. Select the [Print] screen. -
Page 184: Specifying The Range To Print (Print Range)
7.5 Various Print Settings Specifying the Range to Print (Print Range) You can set the print range. (High-speed Function only) Select the [Print] screen. Select from the setting options of [Print range]. (Open/confirm the setting information.) ∗ Setting options ( . -
Page 185: Feeding
7.6 Feeding 7.6 Feeding You can feed blank recording paper. Press the FEED key on the printer. Blank recording paper is fed, and then feeding stops automatically. 7.7 Performing a Printer Check You can check the print operation of the printer. A checkered pattern, vertical straight lines, horizontal straight lines, diagonal straight lines, and text are printed in order. - Page 186 7.7 Performing a Printer Check...
-
Page 187: Numerical Calculations
8.1 Calculation Methods Numerical Chapter 8 Calculations Calculation Methods Calculations can be applied to measured data. The operation differs depending on the function ([Highspeed]/[Realtime]). Up to four calculations can be performed at one time. Types of calculations High- Types Realtime speed Average value of waveform data Average value... - Page 188 8.1 Calculation Methods Calculation Methods Two methods are available for applying calculations, as follows. When a calculation is applied automatically, the operation differs depending on the function. Default setting: [Numerical Calc.: Off] Calculating Automatically Calculating after Measurement Starts after Measurement Ends (Auto Calculation) (Manual Calculation) Configure numerical calculations before...
-
Page 189: Calculating Automatically (Auto Calculation)
8.2 Calculating Automatically (Auto Calculation) 8.2 Calculating Automatically (Auto Calculation) Perform calculation automatically after measurement starts. The operation differs depending on the function. • Highspeed: Calculates automatically after reading for specified recording length. • Realtime: Calculates in real time during measurement. In the case of the Real-time Function, the calculation value can also be saved in text (CSV) format at a specified interval (p. - Page 190 8.2 Calculating Automatically (Auto Calculation) Set automatic saving to automatically save calculation results. Select the type of automatic saving (p. 102). Select any of the following. • [Calc(after meas.)] • [Waveform + Calc] • [CSV + Calc] You can save the calculation values at the specified interval (p.
-
Page 191: Calculating At Specified Interval (Interval Calculation)
8.2 Calculating Automatically (Auto Calculation) Calculating at Specified Interval (Interval Calculation) You can save the calculation value at a specified interval. The setting procedure is the same as for auto calculation when other than interval calculation is set (p. 179). (Real-time Function only) Set how to split the calculation values in [Split... -
Page 192: Calculating After Measurement (Manual Calculation)
8.3 Calculating after Measurement (Manual Calculation) 8.3 Calculating after Measurement (Manual Calculation) You can set the calculation and perform the numeric value calculation after mea- surement. You can perform the calculation for all of the waveform data, or specify the range for which to perform the calculation (p. 183). Performing Calculation for All Data Start and finish measuring. -
Page 193: Apply Calculations To A Specific Time Span
8.3 Calculating after Measurement (Manual Calculation) Apply Calculations to a Specific Time Span Start and finish measuring. Select the [Setting] screen. [Numerical Calc.] to [On]. (Open/confirm the setting information.) In the following steps, use the cursor keys in the same way to configure settings. -
Page 194: Numerical Value Calculation Expressions
8.4 Numerical Value Calculation Expressions Numerical Value Calculation Expressions Average value Obtains the average value of waveform data. AVE : Average value ∑ -- - n : Data count di : Data on channel number i Peak-to-Peak Obtains the value of the difference (peak-to- Maximum peak value) between maximum and minimum (P-P) Value... - Page 195 8.4 Numerical Value Calculation Expressions Area Obtains the area value (V•s) enclosed by the Area of zero position (point of zero potential) and the shaded signal waveform. When calculation of the portions range specified by the A/B cursors is selected, the calculated area is constrained to the wave- form between the cursors.
- Page 196 8.4 Numerical Value Calculation Expressions...
-
Page 197: Scheduling Measurement
9.1 Starting & Stopping Measurement on a Specified Day Scheduling Chapter 9 Measurement You can schedule measurement to start and stop at specific times. Before you configure these settings, confirm that the instrument clock is set to the correct time. If it is not, set the clock again on the System screen. (p. 204) 9.1 Starting &... - Page 198 9.1 Starting & Stopping Measurement on a Specified Day Select Apply Select [Conditn. (Condition) ]. ∗ Setting options ( . default setting) Current Perform measurement using the About error display instrument setting conditions con- Red indication: Indicates the error figured at the time of scheduling. item.
-
Page 199: Starting & Stopping Measurement Periodically
9.2 Starting & Stopping Measurement Periodically 9.2 Starting & Stopping Measurement Periodically You can perform measurement periodically. Select the [Setting] screen. Select [Reservation]. Apply Select [ ] (turn on) the check When you want to set the current box of the number (No.) for time: which you want to configure the Select the clock mark (... - Page 200 9.2 Starting & Stopping Measurement Periodically Select Apply Select [Conditn. (Condition)]. ∗ Setting options ( . default setting) Current Perform measurement using the About error display instrument setting conditions con- Red indication: Indicates the error figured at the time of scheduling. item.
-
Page 201: Canceling A Schedule
9.3 Canceling a Schedule 9.3 Canceling a Schedule To cancel a schedule or change the settings of a schedule, [Reserved] (schedule standby state) needs to be cancelled first. Select the [Setting] screen. Select [Reservation]. Apply The schedule cancellation dialog box appears. Select [OK]. - Page 202 9.3 Canceling a Schedule About operation restrictions while [Reserved] is displayed (standby state) • Keys related to starting, stopping, files, saving, and printing do not work. • To change a setting, first cancel the schedule. If you change a setting in the standby state, a dialog box to confirm canceling the schedule oper- ation will appear.
-
Page 203: About Schedule Function Operation
9.4 About Schedule Function Operation 9.4 About Schedule Function Operation The measurement operation differs depending on the trigger, measurement sched- ule settings, repeat recording setting, and recording time setting. When the stop time is set after the recording time Enable schedule Start time or stop time Recording time Measuring... - Page 204 9.4 About Schedule Function Operation The stop time setting is within the recording length Enable schedule Start time or stop time Recording time Measuring Trigger criteria match Deadtime Trig- [Repeat: Single] / [Cont: On] [Repeat: Repeat] Recording time Recording time Measuring Measuring Stop time...
-
Page 205: Setting Examples
9.5 Setting Examples About Dead Time After measurement is performed for the recording time Deadtime portion, time is needed for internal processing before measurement can be resumed (dead time). Measure- ment is not performed during this dead time. When you want to perform measurement without any loss of data, perform measurement with [Cont] set to... - Page 206 9.5 Setting Examples...
-
Page 207: System Environment Settings
System Environment Chapter 10 Settings Settings affecting the clock, SAVE key operation and self testing are made from the [System] screen. Setting Procedure Select the [System] screen. Move to a setting item. Open the setting options for the item to be set. Select from the listed options. -
Page 208: Operation Settings
10.1 Operation Settings 10.1 Operation Settings Using the Auto-Resume Function (Resume After Power Restora- tion) If a power outage or other power loss causes an interruption in recording (while the LED on the left side of START is lit), you can automatically resume recording when the power is restored. -
Page 209: Screen Key Operation Settings
10.2 Screen Key Operation Settings 10.2 Screen Key Operation Settings Enabling and Disabling the Backlight Saver A backlight saver can be activated after a specified number of minutes during which no operation key is pressed. The backlight saver turns off the backlight of the LCD, prolonging the lifetime of the backlight by turning it off when not needed. -
Page 210: Selecting Black Or White Screen Background
10.2 Screen Key Operation Settings Selecting Black or White Screen Background The screen background can be set to black or white. White Black Background Background Select from the setting options of [Display Color]. ∗ Setting options ( . default setting) ∗... -
Page 211: Selecting The Horizontal (Time) Axis Display
10.2 Screen Key Operation Settings Selecting the Horizontal (Time) Axis Display Select the display method for the horizontal axis at the bottom of the screen. This setting also deter- mines the time display for data saved in CSV format. 1d2h3m4s 08-07-10 12:10:30 (Time) (Date/Time) -
Page 212: Setting The Save Key Action
10.2 Screen Key Operation Settings Setting the SAVE Key Action Set the action for when the SAVE key is pressed. Select from the setting options of [SAVE Key Operation]. ∗ Setting options ( . default setting) Select & Pressing the SAVE key displays the set- ∗... -
Page 213: Csv File Saving Settings
10.3 CSV File Saving Settings 10.3 CSV File Saving Settings CSV File Data Decimal and Separator Characters Select decimal point and separator characters for CSV file data. Select from the setting options of [Decimal Mark]. ∗ Setting options ( . default setting) ∗... -
Page 214: Making System Settings
10.4 Making System Settings 10.4 Making System Settings Setting the Date and Time The HiCorder is equipped with an auto-calendar, automatic leap year detection, and a 24-hour clock. If the clock is not set to the correct time, measurement start time (start trigger time) and file date information will be incorrect. -
Page 215: Self-Test
10.4 Making System Settings Self-Test The following self tests are available. Results are displayed on the screen. If any faults are found, have the HiCorder repaired. Contact your dealer or Hioki rep- resentative. Select the [System] screen. Select the self test to perform. - Page 216 10.4 Making System Settings...
-
Page 217: Chapter 11 Connection To A Pc
11.1 USB Settings and Connections Connection to a Chapter 11 11.1 USB Settings and Connections Connecting the instrument to a computer via a USB cable allows you to import the data on a CF card or USB flash drive to the computer (p. 208), and perform com- mand communication (p. -
Page 218: Importing Data To A Computer
11.2 Importing Data to a Computer 11.2 Importing Data to a Computer The supplied USB cable can be used to import the data saved on a CF card or USB flash drive to a computer. Before connecting the USB cable to the instrument, set USB Drive Mode on the [System] settings screen. -
Page 219: Connecting The Instrument And Computer
11.2 Importing Data to a Computer Connecting the Instrument and Computer Computer Requirements : A personal computer running Windows 7, Windows 8, Windows 10. • Do not eject the CF card or pull out the USB cable during data trans- fer. -
Page 220: Communication Using Commands
11.3 Communication Using Commands 11.3 Communication Using Commands If you use the supplied USB cable to connect the instrument to the computer, you can perform command communication using communication commands. The first time you perform communication between the instrument and computer, install the USB driver (p. -
Page 221: Installing The Usb Driver
11.3 Communication Using Commands Installing the USB Driver Before connecting the instrument by USB, perform the following procedure to install the USB driver. Perform the installation with administrator privileges. Installing the Driver Run [HiokiUsbCdcDriver.msi] in the CD-R X:\Driver folder. ([X] indicates the CD-ROM drive. The letter will differ depending on the computer.) Depending on the environment, the dialog box may take some time to appear so please wait till it does so. - Page 222 11.3 Communication Using Commands Click [Next] to start install- ing. Click Installing...
- Page 223 Sometimes another dialog box requesting your permission to in- stall the software may appear. 1 Click 2 Click When it does, check [Always trust software from "HIOKI E.E. and click [In- CORPORATION”] stall] to continue. When installation is completed and the dialog box appears,...
-
Page 224: Connecting The Instrument And Computer
11.3 Communication Using Commands Connecting the Instrument and Computer Computer Requirements : A personal computer running Windows 7, Windows 8, Windows 10. • To prevent a malfunction, do not disconnect the USB cable during communication. • The Memory HiCorder and computer should be connected to the same earth ground. -
Page 225: Uninstalling The Usb Driver
3 Click 1 Click [Uninstall or change a program] screen appears. When Windows 10 is used, click the Start button and select [Setting] [System] [Apps and Features]. From the list of installed programs, select [HIOKI USB CDC Driver], and remove it. - Page 226 11.3 Communication Using Commands...
-
Page 227: Chapter 12 External Control
12.1 Connecting to the External Control Terminals External Control Chapter 12 The external control terminals on the Memory HiCorder support trigger signal input and output. 1 START/IN1 Input signals for controlling the operation of the Input instrument. (Start, stop, abort, print) 2 STOP/IN2 3 GND (common with instrument ground) - Page 228 12.1 Connecting to the External Control Terminals To prevent electric shock accidents and damage to the equipment, always observe the following precautions when making connec- tions to external terminal blocks and external connectors. • Before making connections, turn off the power on the instrument and the equipment to connect.
-
Page 229: External Signal Input (External Trigger Input)
12.2 External Signal Input (External Trigger Input) 12.2 External Signal Input (External Trigger Input) Triggering can be controlled by applying a signal from an external trigger source (p. 127). Furthermore, an event mark can be added by an input signal (p. 142). This allows synchronous operation of multiple Memory HiCorders by parallel trigger- ing (p. - Page 230 12.2 External Signal Input (External Trigger Input) Signal Input Procedure See p. 217 for the connection Connect the cables for the corresponding method. external input signals to the EXT.TRIG and GND terminals. Press the key to open the [System] screen. Select an item from [External Trig In] external control.
-
Page 231: External Signal Output (Trigger Output)
12.3 External Signal Output (Trigger Output) 12.3 External Signal Output (Trigger Output) You can output a signal when a trigger event occurs. This allows synchronous oper- ation of multiple Memory HiCorders by parallel triggering (p. 226). TRIG.OUT Pulse wave is output. Trigger event occurs Trigger Output Signals Output signal... - Page 232 12.3 External Signal Output (Trigger Output) Signal Output Procedure See p. 217 for the connection Connect the cables for the output signals to method. TRIG.OUT and GND terminals. Press the key to open the [System] screen. Select an item from [External Trig Out] external control.
-
Page 233: Controlling Instrument Using External Inputs (Start/In1 And Stop/In2)
12.4 Controlling Instrument Using External Inputs (START/IN1 and STOP/IN2) 12.4 Controlling Instrument Using External Inputs (START/IN1 and STOP/IN2) You can start and end measurement and print and save data by inputting signals from an external source. External signal input START/IN1 Trigger event occurs. - Page 234 12.4 Controlling Instrument Using External Inputs (START/IN1 and STOP/IN2) Signal Input Procedure See p. 217 for the connection Connect each of the START terminal or method. STOP terminal and GND terminal to the external signal input destination with electri- cal wires. Press the key to open the [System]...
-
Page 235: Using External Outputs (Alm/Out)
12.5 Using External Outputs (ALM/OUT) 12.5 Using External Outputs (ALM/OUT) Signals can be output that indicate the instrument's judgment state. ALM/OUT Output a low level signal Saving, printing, error Output Signals Output signal Open drain output (with voltage output, active LOW Output voltage range HIGH level: 4.0 to 5.0 V, LOW level: 0 to 0.5 V Maximum switch rating... -
Page 236: Synchronous Measurements With Multiple Instruments
12.6 Synchronous Measurements with Multiple Instruments 12.6 Synchronous Measurements with Multiple Instruments • This is for using an external trigger to synchronize the start time for measurements with multiple instruments, not for synchronizing sam- pling itself. When measurements are performed for a long time, differ- ences in data acquisition times occur because of variations in the sampling clocks of individual instruments. -
Page 237: Chapter 13 Specifications
13.1 MR8880-20 Specifications Chapter 13 Specifications 13.1 MR8880-20 Specifications (1) Basic Specifications Product warranty 3 years AC adapter: 1 year period Connector, cable, etc.: Not covered by the warranty • High-speed recording (previous Memory Recorder function) Measurement • Real-time recording (equivalent to Memory HiLogger and... - Page 238 Temperature: 23±5°C (73±9°F), humidity range for guaranteed humidity 80% RH or less (non-condensating) accuracy • Model MR8880-20, MR9000 Temperature: -20°C to 60°C (-4 to 140°F), Humidity: -20°C to 40°C (-4 to 104°F) 80% RH or less (non-condensating) Storage temperature 40°C to 45°C (104 to 113°F) 60% RH or less (non-condensating) and humidity 45°C to 60°C (113 to 140°F) 50% RH or less (non-condensating)
- Page 239 The backlight turns off when no key is pressed (Off, or 1 to 5 min- saver function utes) Backlight brightness Selectable from four levels (100%, 70%, 40%, 25%) Waveform display colors Screen color Black or white selectable Screen surface Hard coat treatment (3) Printer Interface Connectable printer MR9000 Printer Unit (for Model MR8880-20)
- Page 240 ±3% (25°C, 50%RH) sions accuracy (4) External Storage CF card PC card slot One CompactFlash compliant slot Supported cards HIOKI 9727 (256MB), 9728 (512MB), 9729 (1GB), 9830 (2GB) Data formats FAT, FAT32 USB flash drive Connector Series A receptacle (5) Communications Functions...
- Page 241 13.1 MR8880-20 Specifications Temperature charac- ±0.1% f.s./°C (after zero adjustment) teristic Frequency character- DC to 100kHz ±3dB istic Common mode -90dB minimum (sensitivity range, at 50/60Hz and with signal rejection ratio source resistance 100Ω maximum) Low-pass filter Off, 5Hz, 50Hz, 500Hz, 5kHz, 50kHz ±50%(Hz) -3dB Noise 2mVp-p typ.
- Page 242 Accessories sold separately • Model Z1002 AC Adapter (12 V DC, 5.25 A) • Model MR9000 Printer Unit (for Model MR8880-20) • Model Z1000 Battery Pack (NiMH, 7.2 V, 4500 mAh) • Model C1003 Carrying Case (with space for storing options) •...
- Page 243 13.1 MR8880-20 Specifications (8) Trigger Function Trigger method Digital comparison Repeat recording Single, Repeat • High-speed function: Start Trigger timing • Real-time function: Start, stop, start&stop (conditions can be set for each of start and stop) Trigger criteria AND or OR possible between all trigger sources...
- Page 244 13.1 MR8880-20 Specifications Rising and falling selectable • Rising A trigger is applied when rise from low (0 to 0.8 V) to high (2.5 to 5 V). • Falling A trigger is applied when fall from high (2.5 to 5 V) to low (0 to 0.8 V), or terminal short.
-
Page 245: High-Speed Function
13.2 High-speed Function 13.2 High-speed Function Basic Specifications 100, 200, 500 μs/div Timebase 1, 2, 5, 10, 20, 50, 100 ms/div Time axis resolution 100 points/div (80 points/div when printing with printer/div) Sampling period 1/100th of timebase 5 to 10000div Settable in 5-division steps Recording length (Also stores one previous measurement after measurement starts) Data types... -
Page 246: Real-Time Function
13.3 Real-time Function Selectable Off or On • On: When there is not much space left on the storage media, the oldest waveform file with the same extension is deleted and a Overwriting save new file is created. • Off: Data is saved until the storage media is full and then mea- surement ends. - Page 247 13.3 Real-time Function Screen settings Single, Dual, Quad Horizontal axis (time axis): 10ms, 20ms, 50ms, 100ms, 200ms, 500ms, 1s, 2s, 5s, 10s, 30s/ div, 1min, 2min, 5min, 10min, 30min, 1h, 2h, 5h, 10h, 12h, 1day/div Vertical axis (voltage axis): Differs depending on display method setting.
- Page 248 13.3 Real-time Function The storage media can be removed during real-time saving. (When replacing external storage media, replace it within 20 sec- onds when the recording interval is set to 100 µs.) (Removal procedure) Remove external Press the storage media eject button on the screen. media A message appears when the storage media becomes able to be ejected.
-
Page 249: Other Functions
13.4 Other Functions 13.4 Other Functions The effect of temperature drift of the analog circuit of the input sec- tion can be cancelled. Zero adjustment Possible with zero adjustment item on the Settings screen function (Also possible by pressing the up and down cursor keys simulta- neously for at least 1 second) The display width in the vertical axis direction of logic waveforms can be set. - Page 250 13.4 Other Functions Event mark function Event input under the following conditions is possible (max. 100 marks). Event mark 1. When pressing START while measuring insertion 2. When pressing the on-screen [Make Mark] button. 3. When a signal is applied to the external trigger input terminal (External Trigger and Exclusive settings on the System screen) Displays the waveform before and after a specified event mark.
- Page 251 13.4 Other Functions Data can be saved by pressing the SAVE key while measurement is stopped. Save types: Setting conditions, waveform data (binary format), Manual saving waveform data (CSV format), numerical calculation results, and screen data (compressed bitmap format) Able to set the desired file name.
- Page 252 13.4 Other Functions External trigger ter- The external trigger terminal function is selectable from trigger and minal functions event. External trigger filter Selectable from On and Off. Any of the following functions can be set for each of terminal 1 and External input termi- terminal 2.
-
Page 253: Monitor Functions
13.5 Monitor Functions Up to 10 measurement start and stop conditions can be set. 1. Specified day • The start time and stop time (year/month/day/hour/minute) can be set. • The setting conditions for performing a scheduled operation can be set. Schedule function 2. - Page 254 13.6 Setting Wizard Function (PRESETS)
-
Page 255: Maintenance And Service
14.1 Inspection, Repair, and Cleaning Maintenance Chapter 14 and Service 14.1 Inspection, Repair, and Cleaning Do not attempt to modify, disassemble or repair the instrument; as fire, electric shock and injury could result. Transporting • Use the original packing materials when transporting the instrument, if possible. •... - Page 256 The fuse is housed in the power unit of the instrument. If the power does not turn on, the fuse may be blown. If this occurs, a replacement or repair cannot be per- formed by customers. Please contact your dealer or Hioki representative.
- Page 257 14.1 Inspection, Repair, and Cleaning Cleaning Instrument and printer (option) • To clean the instrument, wipe it gently with a soft cloth moistened with water or mild detergent. Never use solvents such as benzene, alcohol, acetone, ether, ketones, thinners or gasoline, as they can deform and discolor the case. •...
- Page 258 14.1 Inspection, Repair, and Cleaning • During cleaning, do not apply excessive force to the thermal head or bang the head surface with a hard object. • Do not use sandpaper or the like because doing so may result in dam- age to the heating elements.
-
Page 259: Troubleshooting
(A message appears when a key is pressed while key-lock is active.) three seconds) Power does not turn • Is the AC adapter disconnected? Contact your dealer or Hioki rep- resentative for service. • A power protection component may Customers should not attempt to be damaged. - Page 260 14.2 Troubleshooting Printing problems Symptom Check Items Solution Nothing prints on • Is the paper reversed (back to front)? Verify that the recording paper is the paper. loaded correctly. • Is the printer connected correctly? Printout is too light. • Is the specified recording paper Try changing the print density being used? setting (p.
-
Page 261: Disposing Of The Instrument
14.3 Disposing of the Instrument 14.3 Disposing of the Instrument The instrument contains a lithium battery for memory backup. When disposing of this instrument, remove the lithium battery and dispose of battery and instrument in accordance with local regulations. Removing the Lithium Battery To avoid electric shock, turn off the power switch and disconnect the power cord and measurement cables before removing the lith- ium battery. - Page 262 14.3 Disposing of the Instrument Remove the screws (2) securing the circuit board and the hexagonal standoffs (5). Remove the circuit board to which the lithium battery (back surface) is attached. Lift up the lithium battery on the circuit board, and then cut both the + and - leads with a pair Lithium Battery of wire cutters.
-
Page 263: Appendix
Appendix 1 Error Messages and Remedial Actions Appendix Appendix 1 Error Messages and Remedial Actions Error messages consist of either "Error" or "Warning" displays. A screen message appears whenever an error occurs. In either case, take the reme- dial action indicated. Error Messages To clear an error message, press the ENTER... - Page 264 Appendix 1 Error Messages and Remedial Actions Message Remedial Action The possible zero-adjustment range There is a problem with the input section. If the er- has been exceeded. ror message appears after turning the power off INSTNT error: ..and then back on, the instrument needs to be re- RMS error: ..
- Page 265 Appendix 1 Error Messages and Remedial Actions Message Remedial Action Voltage sag triggering is disabled when the timebase is outside of the range 100 µs to 50 ms/div. Change Voltage drop trigger will be dis- the timebase so that it is with this range. abled.
- Page 266 3 minutes after turning on the device. Check or perform the following: 1. Verify that the CF card is specified by Hioki (p. 46) 2. Reformat the CF card (p. 48) This file may be corrupted. If the message persists after performing the above, either the CF card or Memory HiCorder may be dam- aged.
- Page 267 If this error occurs while using a good removable storage, the HiCorder may be damaged, in which case contact your dealer or Hioki representative. File system error (incorrect de- Turn the HiCorder off and back on. If the fault per- vice).
- Page 268 Appendix 1 Error Messages and Remedial Actions Message Remedial Action Processing could not be performed because files are in use by another executing process. Wait for the File system error (system busy). current process to finish. If there is no other execut- ing process, turn the HiCorder off and back on.
-
Page 269: Appendix 2 List Of Default Settings
Appendix 2 List of Default Settings Appendix 2 List of Default Settings When shipped from the factory or initialized to factory defaults, the settings are as follows. (*1). High-speed Function, (*2). Real-time Function Setting Screen (Status) Setting Screen (Numerical calculation) : Setting available, X: Setting not available : Setting available, X: Setting not available Setting Items... - Page 270 Appendix 2 List of Default Settings (*1). High-speed Function, (*2). Real-time Function Setting Screen (Scheduling) Setting Screen (Graph) : Setting available, X: Setting not available : Setting available, X: Setting not available Settings Items Initial settings (*1) (*2) Setting Initial settings (*1) (*2) Items On/Off...
- Page 271 Appendix 2 List of Default Settings (*1). High-speed Function, (*2). Real-time Function CH/ All CH Screen (Upper/lower limit) Waveform Screen : Setting available, X: Setting not available : Setting available, X: Setting not available Initial Setting Items Initial settings (*1) (*2) Setting Items (*1) (*2) settings...
- Page 272 Appendix 2 List of Default Settings (*1). High-speed Function, (*2). Real-time Function Trig Screen (Trigger) : Setting available, X: Setting not available : Setting available, X: Setting not available Initial Initial Setting Items (*1) (*2) Setting Items (*1) (*2) settings settings Trig Func Logic (Start)
- Page 273 Appendix 2 List of Default Settings (*1). High-speed Function, (*2). Real-time Function Print Screen System Screen : Setting available, X: Setting not available : Setting available, X: Setting not available Initial Initial Setting Items (*1) (*2) Setting Items (*1) (*2) settings settings Auto print...
-
Page 274: Appendix 3 File Naming
(to 60,000 rows in Excel 97 – 2003, and to one million rows in Excel 2007). Larger CSV files can be split by the following methods: • Use a CSV file-splitting program (downloadable for free from Hioki's website). • Before saving, select the [Split Save] saving method in the HiCorder. -
Page 275: Appendix 4 Text File (Csv File) Internal Format
Appendix 4 Text File (CSV File) Internal Format Appendix 4 Text File (CSV File) Internal Format Text files consist of header and data portions. The header includes the following information related to measurement data. (1) File name and version (7) Comment (2) Title comment (8) Scaling setting (3) Start trigger time... - Page 276 Appendix 4 Text File (CSV File) Internal Format When Real-time Function (with envelope set to On) "File name","WAVE0002.CSV","V1.00" …(1) "Title comment","" …(2) "Start trigger time","'10-06-30 16:08:21" …(3) "CH","CH1"(Max),"CH1"(Min),"CH2"(Max),"CH2"(Min),"CH3"(Max),"CH3"(Min),"CH4"(Max),"C H4"(Min),"LA1"(Or),"LA2"(Or),"LA3"(Or),"LA4"(Or),"LA1"(And),"LA2"(And),"LA3"(And),"LA4"(A nd),"LB1"(Or),"LB2"(Or),"LB3"(Or),"LB4"(Or),"LB1"(And),"LB2"(And),"LB3"(And),"LB4"(And), …(4) "Mode","DC",,"DC",,"DC",,"DC",,"LOGIC","LOGIC","LOGIC","LOGIC",,,,,"LOGIC","LOG- IC","LOGIC","LOGIC",,,,, …(5) "Range","500mV",,"2V",,"-",,"50V",,"-","-","-","-",,,,,"-","-","-","-",,,,, …(6) "Comment","",,"",,"",,"",,"","","","",,,,,"","","","",,,,, …(7) "Scaling","Off",,"Off",,"Off",,"Off",,"-","-","-","-",,,,,"-","-","-","-",,,,, …(8) "Ratio","...
-
Page 277: Appendix 5 Waveform File Size
Appendix 5 Waveform File Size Appendix 5 Waveform File Size The file size can be obtained with the following formula. File size = text header size + binary header size + data size Each of these sizes differs depending on the function and envelope setting. High-speed Function •... -
Page 278: Appendix 6 Maximum Recordable Time
Appendix 6 Maximum Recordable Time Appendix 6 Maximum Recordable Time High-speed Function The maximum available recording time depends on the selected timebase. The maximum recording time can be obtained by the following formula. Recordable Time = Timebase x Recording Length The possible recording time is displayed for the recording time indication on the Set- ting screen. - Page 279 Appendix 6 Maximum Recordable Time Real-time Function The maximum recording time when saving waveform files to a CF card is as follows. The recording times when all channels (4 Analog channels and 8 Logic channels) are recorded are shown. (The following table does not include a number of days that is 365 or more.) The maximum recording time increases as the number of channels to be recorded is reduced.
- Page 280 Appendix 6 Maximum Recordable Time The recordable times when 4 Analog channels and 8 Logic channels are used ■ day, h: hours, min: minutes, s: seconds, : 1 year or longer Storage capacity HiCorder's Interval internal Model 9726 Model 9727 Model 9728 Model 9729 Model 9830...
-
Page 281: Appendix 7 Supplemental Technical Information
Appendix 7 Supplemental Technical Information Appendix 7 Supplemental Technical Information Selecting a Timebase (Horizontal Axis) The input signal acquisition rate corresponds to time Timebase: with 1 div = 5 ms per division on the horizontal axis. Determining the timebase: Calculate from the fre- quency and period. - Page 282 Appendix 7 Supplemental Technical Information Aliasing If the signal to be measured changes too fast relative Actual Input Sampling Points Signal to the sampling period, beginning at a certain fre- quency, non-existent slow signal fluctuations are re- corded. This phenomena is aliasing. With the Memory function, the sampling period can be significantly affected by the timebase setting, so care Sampling Period...
-
Page 283: Appendix 8 Frequently Asked Questions
Appendix 8 Frequently Asked Questions Appendix 8 Frequently Asked Questions Here are some common questions and answers about the HiCorder. Installation and Settings Question Remedial Action Reference page Can the HiCorder be installed This is possible if you place a special order for a fixed stand. - Page 284 Appendix 8 Frequently Asked Questions Question Remedial Action Reference page How do I acquire data only This is only possible with the Real- "Applying Trigger with External Input Signal time Function. when the external signal is in (External Trigger)" (p. Input an external signal to the the HIGH period? 127)
- Page 285 Saving Data)" (p. 46) Hioki-specified CF card and USB flash drive option for data protection. Operation can only be guaranteed for Hioki CF card and USB flash drive options. Also, USB flash drive security features such as fingerprint authentication are not supported.
- Page 286 Appendix 8 Frequently Asked Questions Question Remedial Action Reference page How can I create files every Set the start time of the measure- "Setting Automatic Sav- ing" (p. 102) ment schedule to 0:00 (ideal split hour, from 0:00 (ideal split time).
- Page 287 Appendix 8 Frequently Asked Questions Question Remedial Action Reference page After starting measurement As long as storage media is inserted "Replacing CF Card or USB Flash Drive during before internal buffer memory over- with real-time auto saving, can Saving ([Realtime] only)" flows, data from the start of mea- I still acquire data if I neglected (p.
-
Page 288: Appendix 9 Options
Appendix 9 Options Options Appendix 9 For the details, contact your supplier or Hioki representative for details. Model 9197 Model L9197 Model L9198 Input cables Connection Cord Connection Cord Connection Cord for voltage measure- ment Maximum input voltage Maximum input voltage... - Page 289 Appendix 9 Options Model 9018-50 Model 9132-50 Clamp-On Probes 10 to 500 A AC, 10 to 500 A AC, 40 Hz to 3 kHz 40 Hz to 1 kHz Outputs 0.2 V AC waveform of commercial power line current. For users of the following legacy products: Model 9018 or 9132 Clamp-On Probe Usable with this instrument by connecting the Model 9199 Conversion Adapter.
-
Page 290: Appendix 10 Installing Waveform Viewer
Appendix 10 Installing Waveform Viewer Appendix 10 Installing Waveform Viewer About Waveform Viewer (Wv) The viewer has a CSV conversion function. Converted files may be read by a spreadsheet program. This section only describes how to install, uninstall, start, and end Waveform Viewer. For details on how to use the software, read the explanation (Read,me.txt) on the The latest version can be downloaded from our web site. - Page 291 When Windows 10 is used, click the Start button and select [Setting] [System] [Apps and Features]. Select and remove [HIOKI Waveform Viewer (Wv)]. When updating Wave viewer to the latest version, uninstall the earlier version before installing the latest version.
- Page 292 Appendix 10 Installing Waveform Viewer...
-
Page 293: Index
Index Index Index Communication commands ......210 Communication Setting ........ 210 A/B cursors ............138 Connecting a Clamp Sensor ......39 Aliasing ............A20 Connecting Measurement Cables ....38 Alkaline Battery Box .........32 Connecting the Logic Probe ......40 Analog input terminals ........22 Connecting the Printer ........ - Page 294 Index Index Feeding Key problems ............175 ..........249 File KEY/LED ............205 File Name ........104, 148, A12 File Protection ..........198 File Size ............A15 L.P.F ..............88 File Type ............. 148 Language ............202 Hierarchy ............ 147 ............
- Page 295 Index Index ROM/RAM ............205 Offset ..............99 Operation problems ........249 Safety Information ..........5 Options ............A26 Sampling ........... 69, A19 ..............113 Save Oversampling ............84 Calc Results ..........153 Screen Image ..........153 Waveform data .......... 152 Parallel synchronization ........226 SAVE Key Action ...........
- Page 296 Index Index Synthesizing Part of the Data ...... 146 System Environment Settings ..... 197 X-Y area System Reset ............185 ..........204 X-Y area value ..........177 System screen ..........197 X-Y Dots ............94 X-Y Line ............94 XY Synthesis ..........
Need help?
Do you have a question about the MR8880-20 and is the answer not in the manual?
Questions and answers