Tektronix DPO7254 Quick Start User Manual
Dpo7000 series
digital phosphor oscilloscopes
Hide thumbs
Also See for DPO7254:
- User manual (213 pages) ,
- Quick start user manual (164 pages) ,
- Instructions manual (26 pages)
Table of Contents
Advertisement
Quick Links
See also:
User Manual
TMG Corporate Website
Disclaimer:
All trademarks appearing within this PDF are trademarks of their respective owners.
Form 080/01
Complimentary Reference Material
This PDF has been made available as a complimentary service for you to assist in
evaluating this model for your testing requirements.
TMG offers a wide range of test equipment solutions, from renting short to long
term, buying refurbished and purchasing new. Financing options, such as
Financial Rental, and Leasing are also available on application.
TMG will assist if you are unsure whether this model will suit your requirements.
Call TMG if you need to organise repair and/or calibrate your unit.
If you click on the "Click-to-Call" logo below, you can all us for FREE!
TMG Products Website
Advertisement
Table of Contents

Related Manuals for Tektronix DPO7254


Summary of Contents for Tektronix DPO7254
- Page 1 Complimentary Reference Material This PDF has been made available as a complimentary service for you to assist in evaluating this model for your testing requirements. TMG offers a wide range of test equipment solutions, from renting short to long term, buying refurbished and purchasing new. Financing options, such as Financial Rental, and Leasing are also available on application.
- Page 2 DPO7000 Series Digital Phosphor Oscilloscopes Quick Start User Manual www.tektronix.com 071-1733-00...
- Page 3 Copyright © Tektronix, Inc. All rights reserved. Tektronix products are covered by U.S. and foreign patents, issued and pending. Information in this publication supersedes that in all previously published material. Specifications and price change privileges reserved. Tektronix, Inc., P.O. Box 500, Beaverton, OR 97077 TEKTRONIX and TEK are registered trademarks of Tektronix, Inc.
- Page 4 Warranty 2 Tektronix warrants that this product will be free from defects in materials and workmanship for a period of one (1) year from the date of shipment. If any such product proves defective during this warranty period, Tektronix, at its option, either will repair the defective product without charge for parts and labor, or will provide a replacement in exchange for the defective product.
-
Page 6: Table Of Contents
Table of Contents Table of Contents General Safety Summary ......................Environmental Considerations . - Page 7 Correlating Data Between a Tektronix Oscilloscope and Logic Analyzer..........
-
Page 8: General Safety Summary
General Safety Summary General Safety Summary Review the following safety precautions to avoid injury and prevent damage to this product or any products connected to it. To avoid potential hazards, use this product only as specified. Only qualified personnel should perform service procedures. While using this product, you may need to access other parts of a larger system. - Page 9 General Safety Summary Terms in this Manual These terms may appear in this manual: WARNING. Warning statements identify conditions or practices that could result in injury or loss of life. CAUTION. Caution statements identify conditions or practices that could result in damage to this product or other property. Symbols and Terms on the Product These terms may appear on the product: DANGER indicates an injury hazard immediately accessible as you read the marking.
-
Page 10: Environmental Considerations
The symbol shown below indicates that this product complies with the European Union’s requirements according to Directive 2002/96/EC on waste electrical and electronic equipment (WEEE). For information about recycling options, check the Support/Service section of the Tektronix Web site (www.tektronix.com) Mercury Notification. -
Page 11: Preface
DPO7000 Series instruments can help you verify, debug, and characterize electronic designs. Key features include: 2.5 GHz bandwidth and 10 GS/s real time sampling rate on all channels, 40 GS/s on 1 channel, DPO7254 1 GHz bandwidth and 5 GS/s (10 GS/s optional) real time sampling rate on all channels, 20 GS/s (40 GS/s optional) on 1 channel, DPO7104 500 MHz bandwidth and 2.5 GS/s (5 GS/s optional) real time sampling rate on all channels, 10 GS/s (20 GS/s optional) -
Page 12: Conventions Used In This Manual
Preface Documentation Review the following for the location of different types of information available for this product. To read about Use these documents Installation and Operation (overviews) Quick Start User Manual. Provides general operating information. In-Depth Operation and User Interface Help Online Help. - Page 13 Preface viii DPO7000 Series Quick Start User Manual...
-
Page 14: Install Your Instrument
Install Your Instrument Unpack the instrument and check that you received all items listed as Standard Accessories. Recommended accessories, probes, instrument options, and upgrades are listed in the online help. Check the Tektronix Web site (www.tektronix.com) for the most current information. -
Page 15: Operating Requirements
Install Your Instrument Operating Requirements 1. Place the instrument on a cart or bench, observing clearance requirements: Top: 0 in (0 mm) Left and right side: 3 in (76 mm) Bottom: 0 in (0 mm) standing on feet, flip stands down Rear: 0 in (0 mm) on rear feet 2. -
Page 16: Powering On The Instrument
Install Your Instrument Powering On the Instrument Power Supply Requirements Source voltage and Frequency Power Consumption 100–240 V ±10%, 50–60 Hz ≤ 400 VA or 115 V ±10%, 400 Hz DPO7000 Series Quick Start User Manual... -
Page 17: Powering Off The Instrument
Install Your Instrument Powering Off the Instrument Removing the Power Connecting to a Network You can connect your instrument to a network for printing, file sharing, internet access, and other functions. Consult with your network administrator and use the standard Windows utilities to configure the instrument for your network. -
Page 18: Adding A Second Monitor
Install Your Instrument Adding a Second Monitor You can operate the instrument while using Windows and installed applications on an external monitor. Follow the procedure below to set up a dual monitor configuration. 1. Turn off power. 2. Connect second monitor. 3. - Page 19 Install Your Instrument 7. Right-click on the Windows desktop, and then select Properties. 8. Select Settings. Click the grayed out external monitor ( 2 ), and drag it to the left of monitor 1. 9. Select Yes when you are prompted to enable the new monitor.
-
Page 20: Getting Acquainted With Your Instrument
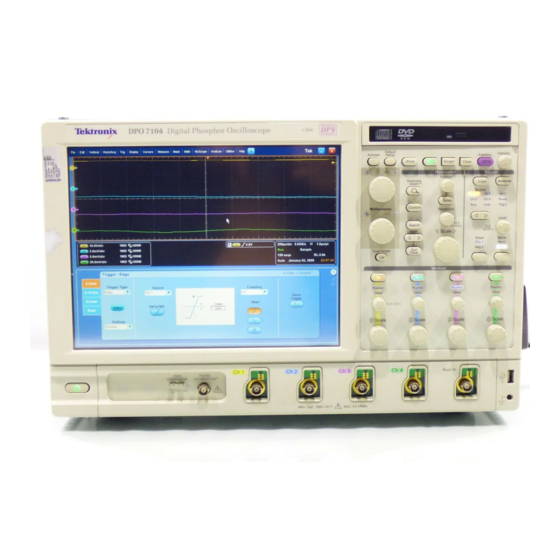
Front Panel 1. DVD/CD-RW drive 2. Front panel controls 3. USB port 4. Ground terminal 5. Recovered clock output, DPO7254 only 6. Recovered data output, DPO7254 only 7. Probe compensation output 8. Probe calibration output 9. Channel 1–4 input 10. Auxiliary Trigger input... -
Page 21: Side And Rear Panels
Getting Acquainted with Your Instrument Side and Rear Panels 1. USB ports 2. Video port to connect a monitor for side-by-side display 3. Mic connector for microphone 4. Line Out connector for speaker 5. Scope Only XGA Out video port to connect a monitor 6. -
Page 22: Interface And Display
Getting Acquainted with Your Instrument Interface and Display The menu bar mode provides access to commands that control all of the instrument features and functions. The toolbar mode provides access to the most common features. 1. Menu Bar: Access to data I/O, printing, online help, and instrument functions 2. - Page 23 Getting Acquainted with Your Instrument 1. Buttons/Menu: Click to toggle between toolbar and menu bar modes and to customize the toolbar 2. Drag cursors to measure waveforms on screen 3. Drag the position icons to reposition a waveform 4. Click the icon to assign the multipurpose knobs to waveform vertical position and scale 5.
-
Page 24: Control Panel
Getting Acquainted with Your Instrument Control Panel 1. Push to automatically set up the vertical, horizontal, and trigger controls based on selected channels. 2. Push to return settings to default values. 3. Push to make a hard copy or save a screen capture. -
Page 25: Accessing Online Help
Getting Acquainted with Your Instrument Accessing Online Help In-depth information is available in the online help on all the features of your instrument. To access context-sensitive help on the active window, select Help > Help on Window... or press F1. 1. -
Page 26: Accessing Menus And Control Windows
Getting Acquainted with Your Instrument Accessing Menus and Control Windows You can access menus and control windows using the following techniques: Click a menu, and then select a command. For a shortcut menu, right-click anywhere in the graticule or on an object. The shortcut menu is context sensitive and varies with the area or object where you right-clicked. -
Page 27: Inspect Your Instrument
Inspect Your Instrument Inspect Your Instrument Use the following procedures to verify the functionality of your instrument. Verify Internal Diagnostics Pass 1. Power on the instrument. 2. Select Instrument Diagnostics..DPO7000 Series Quick Start User Manual... -
Page 28: Signal Path Compensation
4. Verify that all tests pass. If diagnostic failures occur, contact your local Tektronix service personnel. Signal Path Compensation Use this procedure if the temperature has changed more than 5 °C (9 °F) since the last signal path compensation. - Page 29 Inspect Your Instrument 3. When the status changes to Temp, click Calibrate to start the calibration. Calibration may take 10 to 15 minutes. 4. If the instrument does not Pass, recalibrate the instrument, or have the instrument serviced by qualified service personnel.
-
Page 30: Acquisition
Acquisition Acquisition This section contains concepts of and procedures for using the acquisition system. Setting Up Signal Input Use front-panel buttons to set up your instrument to acquire the signal. 1. Connect the probe to the input signal source. 2. Select the input channel by pushing the front-panel buttons to toggle the channels on and off. -
Page 31: Using Default Setup
Acquisition 3. Press Autoset. 4. Adjust the vertical position, scale, and offset using the front-panel knobs. (Push the knob to toggle between position and offset.) 5. Adjust the horizontal position and scale using the front-panel knobs. The horizontal position determines the number of pretrigger and posttrigger samples. -
Page 32: Using Autoset
Acquisition Using Autoset Use Autoset to quickly and automatically set up the instrument (acquisition, horizontal, trigger, and vertical) based on the characteristics of the input signal. Autoset makes adjustments to the signal such that the waveform displays two or three cycles with the trigger level near the midlevel. -
Page 33: Acquisition Concepts
Acquisition Calibrate active probes Deskew input channels Acquisition Concepts Acquisition Hardware Before a signal can be displayed, it must pass through the input channel where it is scaled and digitized. Each channel has a dedicated input amplifier and digitizer. Each channel produces a stream of digital data from which the instrument extracts waveform records. -
Page 34: Waveform Record
Acquisition Equivalent-time Sampling The instrument uses equivalent-time sampling to extend its sample rate beyond its real-time maximum sampling rate. Equivalent-time sampling is only used if Equivalent Time is selected and the time base is set to a sampling rate that is too fast to create a waveform record using real-time sampling. -
Page 35: How The Acquisition Modes Work
Acquisition Interpolation Your instrument can interpolate between the samples it acquires when it does not have all of the actual samples it needs to fill the waveform record. Linear interpolation computes record points between actual acquired samples by using a straight line fit. Sin(x)/x interpolation computes record points using a curve fit between the actual values acquired. -
Page 36: Changing The Acquisition Mode
Acquisition Changing the Acquisition Mode Use this procedure to change the acquisition mode. 1. Select Horiz/Acq > Acquisition Mode. 2. To select an acquisition mode, do one of the following: Select an acquisition mode directly from the menu. Click Mode..., and then select an acquisition mode. -
Page 37: Starting And Stopping An Acquisition
Acquisition Starting and Stopping an Acquisition After the channels that you want to acquire are selected, use the following procedure. 1. Press the front-panel RUN/STOP button to start the acquisition. 2. Press the RUN/STOP button again to stop the acquisition. 3. -
Page 38: Using Roll Mode
Acquisition Using Roll Mode Roll mode gives a display similar to a strip chart recorder for low-frequency signals. Roll mode displays acquired data points without waiting for the acquisition of a complete waveform record. 1. Select Horiz/Acq > Horizontal/Acquisition Setup..2. -
Page 39: Pinpoint Triggers
Pinpoint Triggers Pinpoint Triggers The Pinpoint trigger system comes with advanced trigger types that are usable on both A and B triggers, and it can reset the trigger sequence if the B event does not occur after a specific number of events or a specific time. Pinpoint triggers support capture of events based on the most complex trigger event or sequence of trigger events. -
Page 40: Trigger Coupling
Pinpoint Triggers Trigger Coupling Trigger coupling determines what part of the signal is passed to the trigger circuit. Edge triggering can use all available coupling types: AC, DC, Low Frequency Rejection, High Frequency Rejection, and Noise Rejection. All other trigger types use DC coupling only. -
Page 41: Choosing A Trigger Type
Pinpoint Triggers Choosing a Trigger Type Your instrument allows you to modify basic trigger parameters from the front panel or set up more advanced triggers in the Trigger Setup control window. 1. Push EDGE. 2. Set the source, slope and mode. To set the coupling use the Trig >... -
Page 42: Pinpoint Trigger Selections
Pinpoint Triggers Pinpoint Trigger Selections Trigger Type Trigger Conditions Edge Trigger on a rising or falling edge, as defined by the slope control. Coupling choices are DC, AC, LF Reject, HF Reject, and Noise Reject. Glitch Trigger on a pulse narrower (or wider) than the specified width or ignore glitches narrower (or wider) than the specified width. -
Page 43: Checking Trigger Status
Pinpoint Triggers Checking Trigger Status You can check the trigger status from the status lights on the front panel or from the readout. Check the ARM, READY, and TRIG’D front-panel controls to determine the trigger status. If TRIG’D is on, the instrument has recognized a valid trigger and is filling the posttrigger portion of the waveform. -
Page 44: Using A (Main) And B (Delayed) Triggers
Pinpoint Triggers Using A (Main) and B (Delayed) Triggers You can use the A Event (Main) trigger for simple signals or combine it with the B Event (Delayed) trigger to capture more complex signals. After the A Event occurs, the trigger system looks for the B Event before triggering and displaying the waveform. - Page 45 Pinpoint Triggers 5. Set the B trigger characteristics in the B Event (Delayed) tab. 6. Select Normal Trigger Mode and Holdoff in the Mode tab. Trigger on B Event The A trigger arms the instrument. Posttrigger acquisition starts on the nth B event.
- Page 46 Pinpoint Triggers B Trigger After Delay Time The A trigger arms the instrument. Posttrigger acquisition starts on the first B edge after the trigger delay time. Triggering with Reset You can specify a condition to reset the trigger system if it occurs before the B trigger event.
-
Page 47: Sending E-Mail On Trigger
Pinpoint Triggers Sending E-mail on Trigger You must configure e-mail on event before performing the following procedure. (See page 93, Setting Up E-mail on Event.) 1. Select Trig > A Event (Main) Trigger Setup..2. Select the Mode tab. 3. Under E-mail on Trigger, click On, and then click Setup. - Page 48 Pinpoint Triggers Quick Tips Use MultiView Zoom and Horizontal Delay together to magnify a delayed acquisition. Toggle Horizontal Delay on and off to quickly compare signal details at two different areas of interest, one near the trigger location and the other centered at the delay time. DPO7000 Series Quick Start User Manual...
-
Page 49: Display A Waveform
Display a Waveform Display a Waveform This section contains concepts and procedures for displaying a waveform. Detailed information is available in the online help. Setting the Display Style To set the display style select Display > Display Style, and then select one of the following styles: Displays waveforms with lines drawn between... -
Page 50: Setting The Display Persistence
Display a Waveform Setting the Display Persistence Select Display > Display Persistence, and then select the type of persistence. No persistence shows record points for the current acquisition only. Each new waveform record replaces the previously acquired record for a channel. Infinite persistence continuously accumulates record points until you change one of the acquisition display... -
Page 51: Setting The Display Format
Display a Waveform Setting the Display Format The instrument can display waveforms in two different formats. Choose the format that best suits your needs. Select Display > Display Format. Select Y-T format to show a signal amplitude as it varies over time. Select X-Y format to compare the amplitude of Ch 1 (X) and Ch 2 (Y), Ch 3 (X) and Ch 4 (Y), Ref 1 (X) and... -
Page 52: Adding Screen Text
Display a Waveform Quick Tips Sin(x)/x interpolation is the default interpolation mode. It requires fewer actual sample points than linear interpolation to accurately represent the waveform. Adding Screen Text 1. Select Display > Screen Text. 2. Enter up to eight independent lines of text. -
Page 53: Setting The Graticule Style
Display a Waveform Setting the Graticule Style To set the graticule style, select Display > Graticule Style, and then select one of the following styles: Use for quick estimate of waveform parameters. Use for full-screen measurements with cursors and automatic readouts when cross-hairs are not needed. -
Page 54: Setting The Trigger Level Marker
Display a Waveform Setting the Trigger Level Marker 1. Select Display > Objects..2. Select one of the following: Short displays a short arrow on the side of the graticule. Long displays a horizontal line across the graticule. Off turns off the trigger level marker. Displaying the Date and Time 1. -
Page 55: Using The Color Palettes
Display a Waveform Using the Color Palettes Select Display > Record View Palette or FastAcq/WfmDB Palette, and then select one of the following color schemes for the waveform and graticule: Normal displays hues and lightness levels for best overall viewing. The color of each channel waveform matches the color of the corresponding front-panel vertical knob. -
Page 56: Setting The Reference Colors
Display a Waveform Setting the Reference Colors Select Display > Colors..., and then select one of the following: Default uses the default system color for reference waveforms. Inherit uses the same color for the reference waveform as the original waveform. Setting Math Colors Select Display >... - Page 57 Display a Waveform 2. Push HORIZ or VERT to select which axis to magnify in the zoom graticule. Use the multipurpose knobs to adjust scale and position of the magnified waveform. 3. To adjust the zoom graticule size, select Zoom Graticule Size from either the Vertical or Horiz/Acq menus.
-
Page 58: Zooming In Multiple Areas
Display a Waveform Zooming in Multiple Areas When you want to view and compare multiple areas of one record at the same time, use the following procedure. 1. Click and drag a box around the area of the waveform that you want to zoom. 2. - Page 59 Display a Waveform 6. To adjust the zoomed area vertically, select Vertical > Zoom Setup..., click a vertical field, and then use the multipurpose knobs to adjust the Vertical Position and Factor. Quick Tips To clear the zoom area, click Position Factor Reset from the Zoom Setup control window. You can turn each zoom display on and off from the Zoom Setup control window.
-
Page 60: Lock And Scroll Zoomed Waveforms
Display a Waveform Lock and Scroll Zoomed Waveforms 1. To use Lock and Scroll select Zoom Setup... from either the Vertical or Horiz/Acq menu, and then select the Lock and Scroll tab. 2. To scroll a single zoomed area, select a Zoom 1-4 check box, and then click an Auto Scroll button. -
Page 61: Analyzing Waveforms
Analyzing Waveforms Analyzing Waveforms Your instrument features cursors, automatic measurements, statistics, histograms, math, spectral analysis, and advanced pass/fail tests to assist you in analyzing waveforms. This section contains concepts and procedures for analyzing waveforms. Detailed information is available in the online help. Taking Automatic Measurements 1. - Page 62 Analyzing Waveforms 4. To remove the last measurement, click Clear. 5. To remove multiple measurements, click and drag to select the measurements, and then click Clear. You can also choose a measurement for the selected waveform directly in the Measure menu. (See page 50, Automated Measurement Selections.) Quick Tips In roll mode, measurements are not available until after you stop the acquisition.
-
Page 63: Automated Measurement Selections
Analyzing Waveforms Automated Measurement Selections The following tables list each automated measurement by category: amplitude, time, more, histogram, or communication. (See page 48, Taking Automatic Measurements.) Amplitude Measurements Measurement Description Amplitude The high value less the low value measured over the entire waveform or gated region. High This value is used as 100% whenever high reference, mid reference, or low reference values are needed, such as in fall time or rise time measurements. - Page 64 Analyzing Waveforms Time Measurements (cont.) Measurement Description - Duty Cyc The ratio of the negative pulse width to the signal period expressed as a percentage. The duty cycle is measured on the first cycle in the waveform or gated region. Period The time required to complete the first cycle in a waveform or gated region.
- Page 65 Analyzing Waveforms Histogram Measurements (cont.) Measurement Description Mean ±2 Std Dev Displays the percentage of points in the histogram that are within two standard deviations of the histogram mean. Mean ±3 Std Dev Displays the percentage of points in the histogram that are within three standard deviations of the histogram mean.
-
Page 66: Customizing An Automatic Measurement
Analyzing Waveforms Customizing an Automatic Measurement You can customize automatic measurements by using gating, modifying measurement statistics, or adjusting the measurement reference levels. Gating Use Gating to confine the measurement to a certain portion of a waveform. 1. Select Measure > Gating > Gating ..2. - Page 67 Analyzing Waveforms Statistics Statistics turn on automatically with measurements. Statistics characterize the stability of the measurement. 1. To change the statistics that are displayed, select Measure > Statistics, and then select Mean or All. (All includes min, max, mean, standard deviation, and population.) 2.
-
Page 68: Taking Cursor Measurements
Analyzing Waveforms Taking Cursor Measurements Use cursors to taking measurements on acquired data. 1. Push Cursors. 2. Select the Cursor Source. 3. Select a cursor type from one of the following: H Bars measure amplitude (typically in volts or amperes) V Bars measure horizontal parameters (typically time) Waveform and screen cursors... - Page 69 Analyzing Waveforms 4. To take measurements between two waveforms, select Waveform, and then select the waveform source for each cursor. 5. Select Cursors > Cursor Position..., and then use the multipurpose knobs to adjust the cursor position. 6. Read cursor measurement results in the display.
-
Page 70: Setting Up A Histogram
Analyzing Waveforms Setting Up a Histogram You can display either a vertical (voltage) or horizontal (time) histogram. Use histogram measurements to get statistical measurement data for a section of a waveform along one axis. 1. Click and drag the pointer across the segment of the waveform that you want the histogram to cover. - Page 71 Analyzing Waveforms 4. To make adjustments to the histogram scale or the size and location of the histogram box, select Measure > Waveform Histograms, and then use the Histogram Setup control window. 5. You can also take automated measurements on histogram data. (See page 48, Taking Automatic Measurements.) Quick Tips...
-
Page 72: Using Math Waveforms
Analyzing Waveforms Using Math Waveforms Create math waveforms to support the analysis of your channel and reference waveforms. By combining and transforming source waveforms and other data into math waveforms, you can derive the data view that your application requires. Use the following procedure for predefined math equations. - Page 73 Analyzing Waveforms 2. Click Editor. 3. Build your advanced math waveform expression using sources, operators, constants, measurements, variables, and functions. 4. When you have defined the expression to your satisfaction, click Apply. 5. To add your own filter, click the Filter tab.
- Page 74 Analyzing Waveforms 6. Double click Math Arbitrary Filters folder. Double click the filter you want to use. 7. Built your math expression using the filter you selected. 8. When you have defined the expression to your satisfaction, click Apply. Quick Tips Math definitions are not implemented if the sources are not valid.
-
Page 75: Using Spectral Analysis
Analyzing Waveforms Using Spectral Analysis Use the following procedure for predefined spectral math expressions. See the online help for more information. 1. Select Math > Math Setup..2. Choose one of the predefined spectral math expressions. 3. Click Basic. 4. Click Resolution BW or Frequency Span and use the keypad or the multipurpose knobs to adjust the spectral display. - Page 76 Analyzing Waveforms Use the following procedure to build an advanced spectral math expression. 1. Select Math > Advanced Spectral..2. Select the math waveform that you want to define. 3. Click the type of spectral waveform that you want to create. To redefine a waveform, click Clear.
-
Page 77: Using Mask Testing
Analyzing Waveforms Quick Tips Sources for spectral math waveforms must be channel or other math waveforms. Use short record lengths for faster instrument response. Use long record lengths to lower the noise relative to the signal and increase the frequency resolution. Different window functions produce different filter response shapes in the spectrum and result in different resolution bandwidths. - Page 78 Analyzing Waveforms 4. Select the Type and standard. 5. Click Config to access the Mask Configuration control window, where you can adjust how masks and violations are displayed and how Mask Autoset and Autofit are configured. 6. Click Masks to return to the Mask Setup control window.
- Page 79 Analyzing Waveforms 11. Click the Tolerance tab, and then set the tolerance. Tolerance settings greater than 0% make the mask test harder to pass, settings less than 0% make the test easier to pass. Use 0% if you want the mask as specified in the standard.
- Page 80 Analyzing Waveforms 14. Select the polarity you want to test. 15. Toggle Pass/Fail Test On to start the mask test. 16. Toggle Repeat On to run the mask test continuously. 17. Click the Pass/Fail Results tab to view the test results. 18.
-
Page 81: Myscope
MyScope MyScope MyScope allows you to create custom control windows that include only the controls that you use regularly. Instead of switching between several control windows, put the controls you use into a custom control window. This section contains procedures for creating and using MyScope control windows. Detailed information is available in the online help. - Page 82 MyScope 3. Click a control to preview it. 4. Double-click the control or click the + to expand the control list. (If there is no +, then the control cannot be customized further.) DPO7000 Series Quick Start User Manual...
- Page 83 MyScope 5. Clear the check boxes to remove any components that you do not want included in the control. 6. Click and drag the control to your MyScope control window. The control will snap to the nearest grid location when you release the mouse. You can change the placement of the control in your MyScope control window by clicking and dragging.
- Page 84 MyScope 7. Click New Tab to add a tab to your MyScope control window. You can have up to eight tabs. 8. To rename a tab do one of the following: Click Rename Tab. Double-click the tab, and then type the new name.
-
Page 85: Using Myscope Control Windows
MyScope Using MyScope Control Windows To open a previously defined MyScope control window, do the following: 1. Select MyScope > Open Control Window... or one of the five most recently used MyScope windows. 2. Select the MyScope control window you want to use, and then click Open. - Page 86 MyScope To edit a MyScope control window do the following: 1. Select MyScope > Edit Control Window..2. Select the control window you want to edit, and then click Open. Quick Tips Some controls function differently in a MyScope control window than they do in the standard control window. For details, see the online help.
-
Page 87: Saving And Recalling Information
Saving and Recalling Information Saving and Recalling Information This section contains procedures for saving and recalling screen captures and setups, saving measurements, using the clipboard, and printing on your instrument. Detailed information is available in the online help. Saving Screen Captures 1. -
Page 88: Saving Waveforms
Saving and Recalling Information 3. Select the location to save the screen capture. 4. Type in a name for the screen capture, or use the default name, and then select a file type. 5. Click Save. Quick Tip To quickly save multiple screen captures, select Set Front Panel Print Button to Save, and then click Save. You can now save a screen capture by pushing the front panel Print button. - Page 89 Saving and Recalling Information 2. Click Waveform. 3. Click Options..., if you want to specify the Waveform Data Range, FastFrame Data Range, Waveform Detail, Data Destination, Source, or Data Ordering; otherwise, skip to step 4. 4. Select the Source. 5. You can either save the waveform as a reference waveform in the instrument memory or as a .wfm file in a Windows directory.
-
Page 90: Recalling Waveforms
Saving and Recalling Information Recalling Waveforms 1. Select File > Recall..2. Click Waveform. 3. Select the Destination of the waveform you are recalling. 4. Select the waveform to recall. 5. Click Recall. Clicking Recall turns on the reference waveform and activates the Reference Waveform control window. -
Page 91: Saving Instrument Setups
Saving and Recalling Information Saving Instrument Setups 1. Select File > Save or Save As > Setup..2. Click Setup. 3. Select the location where you want to save the setup. You can either save the setup to the instrument memory in one of the ten setup storage locations or as a .set file in a Windows directory. -
Page 92: Recalling Instrument Setups
Saving and Recalling Information Recalling Instrument Setups 1. Select File > Recall..2. Click Setup. 3. Select the setup you want to recall. You can recall a setup file from one of the ten locations in the instrument memory or from a Windows directory. -
Page 93: Saving Measurements
Saving and Recalling Information Saving Measurements 1. Select File > Save or Save As > Measurement..2. Click Options..., if you want to specify Displayed Measurements or Measurement Format; otherwise, skip to step 3. 3. Select the location to save the measurement. -
Page 94: Copying Your Results To The Clipboard
Saving and Recalling Information Copying Your Results to the Clipboard Use the following procedure to set the output content and format for images, waveforms, or measurements to be copied to the Microsoft clipboard. 1. Select Edit > Copy Setup..2. Click the Images, Waveforms, or Measurements tab, and then select the desired options. - Page 95 Saving and Recalling Information To copy images, waveforms, or measurements use the following procedure: 1. Select the item that you want to copy. 2. Select Edit > Copy or press Ctrl + C. 3. Press Ctrl + V to paste the item into a Windows application.
-
Page 96: Printing A Hard Copy
Saving and Recalling Information Printing a Hard Copy 1. To print a hard copy, do one of the following: Push PRINT. Select File > Print. If necessary, you can make changes to the page orientation in the Page Setup dialog box. -
Page 97: Run Application Software
The Optional Application Software CD contains free five-time trials of optional application software that you can install on your instrument. These applications provide application-specific measurement solutions. Some examples are described below. Additional packages may be available. Contact your Tektronix representative or visit our Web site at www.tektronix.com for more information. -
Page 98: Application Examples
Application Examples Application Examples This section contains ways to use your instrument in common troubleshooting tasks and extending the use of your instrument. Capturing Intermittent Anomalies One of the most difficult tasks that design engineers face is tracking down the cause of intermittent failures. If you know what type of anomaly you are looking for, then it is easy to configure the oscilloscope advanced triggering capability to isolate it. - Page 99 Application Examples 3. Select Display > Display Persistence > Infinite Persistence. In this example, we are looking at a clock signal. After observing the signal for 1–2 minutes, but before you look for the problem elsewhere, go to step 4. 4.
- Page 100 Application Examples 6. To trigger on the glitch that you identified in step 5, select Glitch Setup..7. Select the appropriate trigger values. 8. Click Level, and then set the level based on what you found in step 5. 9. Click Width, and then set the width based on what you found in step 5.
-
Page 101: Using The Extended Desktop And Openchoice Architecture For Efficient Documentation
Application Examples Using the Extended Desktop and OpenChoice Architecture for Efficient Documentation Engineers often need to document their lab work for future reference. Instead of saving screen shots and waveform data to a CD or USB memory device, and then generating a report later, try using the OpenChoice architecture to document your work in real time. -
Page 102: Triggering On Buses
Application Examples 5. Select Edit > Select for Copy > Full Screen (bitmap). 6. Press Ctrl+C. 7. Click in the Word document wherever you want to place the screen shot, and then press Ctrl+V. Quick Tips The instrument comes with a variety of OpenChoice software tools designed to ensure maximum efficiency and connectivity to the rest of your design environment. - Page 103 Application Examples 2. Set the A trigger type and source in the A Event tab. 3. Select Trigger On to select the desired trigger on feature. 4. Depending on your Trigger On selection, you may need to make additional selections. DPO7000 Series Quick Start User Manual...
-
Page 104: Triggering On A Video Signal
Application Examples Triggering on a Video Signal The instrument supports triggering on NTSC, SECAM, PAL, and high definition signals. To trigger on the video fields: 1. Select Trig > A Event (Main) Trigger Setup..2. Set the A trigger type and source in the A Event tab. - Page 105 Application Examples Triggering on Lines To look at the video lines in the field: 1. Select Trig > A Event (Main) Trigger Setup..2. Set the A trigger type and source in the A Event tab. Select Format > 525/NTSC. 3.
-
Page 106: Setting Up E-Mail On Event
Application Examples Setting Up E-mail on Event 1. Select Utilities > E-mail on Event > Setup..2. Enter recipients’ e-mail address(es). Separate multiple entries with commas. There is a limit of 252 characters in the e-mail address box. 3. Click Config, and then enter the SMTP Server Address. - Page 107 Application Examples 4. Select the event(s) for which you want to send an e-mail. 5. To include attachments, select the type of attachment, and then click Settings to specify the format. 6. Set the maximum message limit and e-mail size. (Maximum message limit is 50 and maximum e-mail size is 2000 MB).
-
Page 108: Correlating Data Between A Tektronix Oscilloscope And Logic Analyzer
The iView capability seamlessly integrates and automatically time-correlates data from Tektronix logic analyzers and oscilloscopes, so you can transfer analog waveforms from the oscilloscope to the logic analyzer display with the click of a mouse. View time-correlated analog and digital signals side-by-side and pinpoint the source of elusive glitches and other problems in moments. - Page 109 Application Examples DPO7000 Series Quick Start User Manual...
-
Page 110: Index
Index Index Default setup, 18 Delayed trigger, 27, 31 Accessories, 1 H Bars cursor, 55 Diagnostics, 14 Acquisition Hi Res acquisition mode, 22 Display input channels and Histogram measurements, 51 colors, 43 digitizers, 20 Histogram setup, 57 objects, 41 sampling, 20 Horizontal delay, 34 persistence, 37 Acquisition modes... - Page 111 Index Measurements, 48 READY status light, 30 Spectral math expression Rear panel map, 8 cursor, 55 advanced, 63 defined, 50 Recall SPI, 89 reference levels, 54 setup, 79 Start an acquisition, 24 saving, 80 waveforms, 77 State trigger snapshot, 54 Record view palette, 42 defined, 29 statistics, 54...
- Page 112 Index Video trigger Waveform record defined, 29 defined, 21 Y-T display format, 38 Width trigger defined, 29 Window trigger Waveform defined, 29 Zoom, 43 display style, 36 Zoom graticule size, 44 recalling, 77 saving, 75 Waveform cursors, 55 X-Y display format, 38 Waveform database acquisition mode, 22 DPO7000 Series Quick Start User Manual...
- Page 113 Index DPO7000 Series Quick Start User Manual...
Need help?
Do you have a question about the DPO7254 and is the answer not in the manual?
Questions and answers