
Related Manuals for Sutron MONITOR


Summary of Contents for Sutron MONITOR
-
Page 1: Data Logger
MONITOR® Data Logger & PERATIONS AINTENANCE ANUAL Part No. 8800-1174 Revision – 1.04 Oct 20, 2008... -
Page 2: Table Of Contents
Tipping Bucket......................35 Solar Radiation Sensor....................36 SDI-12 Multi-Parameter Sensor ................... 37 Logging ..........................39 SD Card Interface ......................41 MONITOR Time ......................42 SDI Clock Synchronization ..................42 MONITOR Errors......................44 Clearing errors ......................44 Measurement errors ...................... 44 System errors ........................ - Page 3 Modbus Menu Options ....................68 Modbus Function Codes ....................70 Get Log Command......................73 Appendix A – Monitor Specifications ................75 Appendix B – Sutron Customer Service Policy..............77 Appendix C – Commercial Warranty ................78 Sutron Manufactured Equipment.................. 78 Non-Sutron Manufactured Equipment................
-
Page 4: Introduction
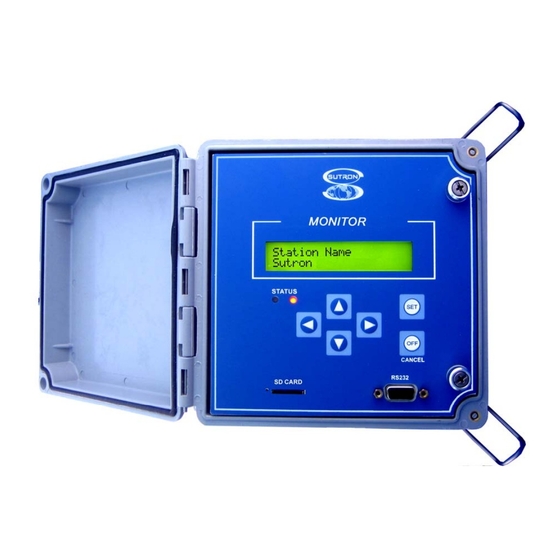
The general purpose version of MONITOR supports up to 16 sensors with its analog, digital and SDI-12 interfaces. The built-in display/keypad makes it simple to set the station up and perform routine maintenance. -
Page 5: Connections
Power (Battery), SDI and tipping bucket sensors are wired to a terminal block inside MONITOR. Connections are made to this terminal block with bare wires using a small flat blade screwdriver (3.5mm or 0.125” wide). The connections on the terminal block... -
Page 6: Db9 Connector
Another jumper J16 (located near J19) determines when MONITOR outputs the voltage on pin 9. If the jumper is across pins 1 and 2, MONITOR will always output the voltage on pin 9. Any other configuration will cause MONITOR to output the voltage only when... -
Page 7: Sensor Connections
Two terminal blocks are provided for making connections to analog and digital sensors. These blocks are located inside MONITOR, behind the front panel. The terminals are numbered 1 to 22. The following table gives a short description of each of the terminals. - Page 8 Terminal Description Notes Block DIFF ‘E’ (+) Differential voltage input for bridge type sensors DIFF ‘E’ (- ) I/O ‘F’ Digital input (discrete) I/O ‘G’ Digital input (discrete) Ground...
-
Page 9: Measurements
As a data logger, MONITOR’s primary function is to measure and log data from sensors. All commonly used environmental sensors are supported. Here is a list of some of the many sensors supported by MONITOR and available through Sutron: • AT/RH (Air Temperature and Relative Humidity) - using analog or SDI-12 sensors •... -
Page 10: Setup
Setup Once it is powered on, how MONITOR behaves is controlled by its setup. The user has the option of changing any part of the setup. MONITOR’s setup is stored in non-volatile memory and will not be affected when the unit loses power. - Page 11 Averaging Time Sampling Interval Subsamples MONITOR is capable of collecting multiple samples and averaging them in order to produce a measurement result. Averaging is useful for measuring changing conditions, such as wind and water level. For example, correctly measuring the level of choppy water requires that wave action be cancelled.
- Page 12 Averaging Time to one hour. Sampling Interval or Subsamples would not need to be changed. MONITOR will collect sensor data all throughout the hour as fast as possible. However, if the power consumption for measuring the sensor continuously for an hour were unacceptable, one would use the Sampling Interval.
- Page 13 MEAS or LAST. MONITOR offers easy ways to change the current reading of the measurement by modifying just the offset or both the slope and offset. Please see the sections on...
- Page 14 Note: Equation processing can take a while to complete (up to several seconds). If you are using a lengthy equation, Monitor may not be able to complete a measurement every second, or even every two seconds (see Bad Schedule in the Error section).
- Page 15 Details are useful for diagnostics and for capturing the minimum and maximum values. Log Error Value When MONITOR is unable to get valid data from a sensor (more specifically, whenever a sensor failure error occurs), MONITOR will change the sensor reading to match the user set Log Error Value which defaults to -99999.
- Page 16 The number of digits shown after the decimal place is referred to as the right digits. To make the measurement read 10.12 rather than 10.12345, set the right digits to 2. Note that MONITOR will round to the requested number of digits before logging the data.
- Page 17 two measurements: one a Precip Rate with an interval of one hour, and another as Precip Rate with an interval of one day. Usually, a slope is applied to convert the counts from the tipping bucket into inches of rain. For example, setting the Slope to 0.01 means that one hundred counts from the tipping bucket equal to one inch of rain.
- Page 18 “SDI-12 Param” specifies which of the sensor readings returned by the SDI-12 device to use. Setting the parameter to 1 tells MONITOR to use the first value returned from the device; setting parameter to 3 tells MONITOR to use the third value returned from the device.
- Page 19 • Diff E 0-5VA and 0-5VB Connection: A (2), B (3) May also use AGND (1), GND (13), SW’D battery (14). Analog Sensor (0-5v) Inputs 0-5V A and 0-5B are designed to be general purpose 0-5 Volt DC input. While sometimes referred to as a single ended input, it is designed to measure voltage with respect to analog ground.
- Page 20 VREF and not to AGND in order to maintain this common mode voltage. Sensors that are not powered by MONITOR are generally floating (such as a pyranometer). Input Range This setting is relevant only to analog differential measurements. The following options are available: •...
- Page 21 • -2.5 to +2.5V Choose the option that is close to and greater than the input range of the sensor that is being connected. E.g. if the sensor provides a reading from 0 to 100mV, choose the 312mV option. If you were to choose the 39mV option, whenever the sensor provided a reading greater than 39mV, the unit would indicate a sensor failure.
- Page 22 This Warmup time gives the sensors a chance to power up and prepare their outputs. If Warmup is set to zero, MONITOR will not wait at all prior to measuring. The value Warmup should be set to depends on the analog sensor being measured.
- Page 23 Measurement Interval Averaging Time Sampling Interval If the fields are not setup exactly the same way, MONITOR will show an error ‘Bad Wind Setup’. Additional settings will appear based on the Wind Type chosen. Analog types will allow the selection of analog input and warmup time. SDI-12 types will allow SDI-12 command and parameters to be chosen.
- Page 24 When Period is the chosen type, MONITOR will watch the input line for up to 10 seconds. MONITOR stops watching as soon as one wave period is noticed on the input.
- Page 25 When scheduling meta measurements, take care that they occur at the same time or after the measurement they reference. If the meta and the reference are scheduled for the same time, MONITOR will try to delay the meta measurement until the reference completes.
- Page 26 Conductivity = 10^(-.284 – 1.334*X - 0.573*X^2 - 0.136 * X^3) Soil temperature: Temperature Fahrenheit = -45.11 + 282.8*V1 Please note that you do not need to enter these equations into monitor. Simply setup the measurement type as Soil and choose the appropriate Soil Type. MONITOR will do the rest.
-
Page 27: Other Setup
Measurement Calibration MONITOR offers an easy way to change the current reading of any measurement. Via the front panel, navigate to the last reading of the measurement (top level of the menu tree). Press SET and enter the desired value. This calibration procedure has the effect of modifying the measurement’s offset. - Page 28 “RECORDING = OFF”. Garmin GPS MONITOR may be connected to a Garmin GPS for accurate time keeping. If this setting is enabled, a GPS menu will appear on the top level of the front panel providing GPS details and showing the setting Local Time Offset which may be changed to translate GPS time to local time.
- Page 29 Command Line for more details. Hardware Flow Ctrl This setting enables hardware flow control (handshaking) for serial communications. If enabled Monitor uses the CTS and RTS lines on the RS232. Please see the section on Command Line for more details.
-
Page 30: Measurement Setup Examples
Measurement Setup Examples RM Young Wind Speed and Direction This section describes how to connect the sensor and how to setup MONITOR in order to measure wind speed and direction. The sensor used is an RM Young 05103-11 which has a four blade propeller for speed and a vane for direction. The sensor provides a square wave signal for wind speed and uses a potentiometer for wind direction. -
Page 31: Thermistor
“completion” resistor (0.1% or better). This completion resistor will help MONITOR to calculate the resistance of the thermistor by measuring the voltage generated by two resistances (a known and unknown). -
Page 32: Pressure Transducer (Analog Bridge Sensor)
Active Label TEMP Meas Type Analog Analog Type 0-5V A (or B) Warmup 0 sec Averaging Time 00:00:00 Sampling Interval 0.0 sec Slope 1 for Celsius 1.8 for Fahrenheit Offset 0 for Celsius +32 for Fahrenheit Use Equation Equation (note this is STEINHART(10000*X/(VREF-X) entered all on one line ,0.00146732513897221... - Page 33 NOTE: Connect the shield wire on the pressure transducer to the earth ground on the side of the Monitor. The wire color column refers to a Druck PDCR 1830 series Sensor. The setup to have the MONITOR measure STAGE from the sensor in units of feet is as follows:...
-
Page 34: Thermocouple Sensor
AGND, wire to DIFF ‘C’ (-) VREF (not used) DIFF ‘C’ (+) Positive Output DIFF ‘C’ (- ) Negative Output This MONITOR setup will measure the temperature difference from the sensor in units of Celsius. Stage setup Value Active Label TDIFF... -
Page 35: Tipping Bucket
If the terminal strip is at 20C and the thermocouple is at 30C, Monitor will read the difference (10C) in the thermocouple. In order to have an absolute temperature reading you’ll need to measure the temperature of the terminal strip and then add to it the thermocouple temperature. -
Page 36: Solar Radiation Sensor
Precip Accumulation and Precip Rate. Solar Radiation Sensor This section describes how to connect the sensor and how to setup MONITOR in order to measure solar radiation sensors. The sensor used is an SP Lite with an analog output and sensitivity expressed as 79.4uV /Wm². -
Page 37: Sdi-12 Multi-Parameter Sensor
00:00:00 Slope -12594.46 SDI-12 Multi-Parameter Sensor This section describes how to connect the sensor and how to setup MONITOR in order to measure multiple parameters from a single SDI-12 sensor. The SDI-12 sensors use three wires for connection, one for data, one for power “+” and one for power “-“. - Page 38 Meas Interval 00:15:00 Meas Time 00:00:00 Averaging Time 00:00:00 M3 Active Label SDI0P3 Meas Type SDI-12 SDI-12 Address SDI-12 Command SDI-12 Param Meas Interval 00:15:00 Meas Time 00:00:00 Averaging Time 00:00:00...
-
Page 39: Logging
Logging MONITOR automatically logs data that it collects according to schedule. Data is logged on a secure flash chip with a capacity of approximately 240,000 entries. An entry looks like this: WNDDIR,04/14/2008,16:09:00,7.6655, Data will not be lost if power is removed. Once the log is full, the oldest data will be overwritten. - Page 40 You may also ask for data from the last X days. In addition, MONITOR remembers the last log download and will allow downloads ‘since last download’, which means that the only parts of the log downloaded are those that have not been previously downloaded.
-
Page 41: Sd Card Interface
If an SD card is left plugged in, the unit will perform an automatic backup of the log to the SD card. All the user needs to do is leave the SD card plugged in, and MONITOR will periodically download the log and save it to a file on the SD card. -
Page 42: Monitor Time
MONITOR Time MONITOR time can be viewed and set via the front panel top level menu or by using the TIME command line. MONITOR uses an RTC (real time clock) backed by an internal battery. The RTC will keep ticking even if the main battery to the MONITOR is removed. The RTC will, at worst case, drift ±2 minutes per month (0 to +50C). - Page 43 Example set date time command: 0XDT2008/06/26 13:15:00!
-
Page 44: Monitor Errors
It is also recorded for analog measurements when the MONITOR analog to digital converter indicates a problem reading the input which could be to the input voltage being out of range or not being connected (MONITOR will not always be able to tell if an analog sensor is present). -
Page 45: System Errors
Time not set This error is noted when MONITOR does not have valid time. This error can only be fixed by setting the time which can be done via the front panel, via the TIME command, or via the SDI-12 XDT command. -
Page 46: Front Panel Interface
Hold SET turn on backlight Turning Display On/Off MONITOR will continue to measure and log data as long as a good battery is connected. The display turns off automatically after 5 minutes of inactivity in order to conserve power. The display can be turned on at any time by pressing any key. -
Page 47: Contrast
DOWN to scroll through the logged values for that measurement. Understanding the “?” indicator If MONITOR displays a “?” after a value if there is a question about the quality of the data. It is normal to see the ? right after power up, while MONITOR is still computing the first readings. -
Page 48: Front Panel Menu Tree
Front Panel Menu Tree Input Range* Errors (only show if errors are present) Warmup* Error details (only show if Meas Interval multiple or hardware errors Meas Time occur) Averaging Time Status (is recording on, and how many Sampling Interval* measurements are active) Subsamples* Station Name and Time Slope... -
Page 49: Rs232 Command Line Interface
RS232 Command Line Interface The RS232 interface provides a simple way to connect the MONITOR to PCs, modems and other communications devices. Details on the DB9 connector are on page 5. Microsoft Windows usually comes with a program called HyperTerminal. It can be found by going to the Windows start menu, Programs, Accessories, Communications. -
Page 50: Setup
By just typing the name of the field, the current value and the range of the field are shown. For example, typing “STATION NAME” will show the current station name. Typing “STATION NAME = SUTRON” will change the station name. >STATION NAME Setup NOT changed Station Name = DEMO, max length 23 >STATION NAME = SUTRON... -
Page 51: Measurements
To start MONITOR, type “RECORDING = ON”. Downloading the Log MONITOR will save the measured data in its flash memory each time a measurement is made. This data is then available to download to via the RS232 port. The command “LOG”... -
Page 52: Examples
“LOG” with no parameters will download since last. “LOG ALL” gets whole log. “LOG X” gets X last days ("LOG 3" gets last 3 days worth of data) “LOG timeStart” gets data since provided date “LOG timeStart timeEnd” gets data between provided dates time can be YYYY/MM/DD HH:MM:SS or YYYY/MM/DD or HH:MM:SS e.g. -
Page 53: Machine To Machine Communication
Auto Output When MONITOR has auto output mode enabled it will automatically send data out on the RS232 port. For more details, please see section Auto Output... - Page 54 E.g. “STATION NAME” will show the current name. Every setup variable can be changed by typing its name = new value. E.g. “STATION NAME = STURON” will set the current name to SUTRON. List of commands BATTERY Shows the current battery reading.
- Page 55 MEAS + Use this to make a measurement on all or some sensors. After receiving this command, MONITOR will measure every active sensor and display the results. If preceded by the measurement designator (E.g. “M1 MEAS”), it measures only one sensor.
- Page 56 Initiates a system software upgrade. It needs to be followed by the YModem transfer of an .upg file specific to the product. Both the main application and the bootloader are upgraded this way (but each needs its own .upg file). Check www.sutron.com for software upgrades. VER + Shows the current software version, including build date and time and the bootloader version.
-
Page 57: Setup Transfer Via Hyperterminal
Character delay to 5 milliseconds. If these changes are not made, HyperTerminal will send the file too fast for MONITOR to capture any but the first few settings. Once the changes are made, choose HyperTerminal’s Transfer menu and click Send Text File. -
Page 58: Connecting A Modem
• Type the command ‘Ver’ to confirm that the upgrade was successful. Connecting a Modem It is possible to connect a modem to MONITOR, allowing for remote access to the station. Use the RS232 port to connect the modem. Most modems will need a null modem adapter between the modem and MONITOR. - Page 59 HyperTerminal) • Carrier Detect: always on (also know as LSD Action, DCD, and CD) • Baud rate, parity, etc: set this up to match the settings of MONITOR (defaults are 115200 Baud, no parity, 8 data bits, 1 stop bit)
- Page 60 You can connect the Raven to the same battery powering the station; however, remember that it will increase the power consumption (both when the modem is idle and when it is connected). As a result, you will need to make sure your battery is large enough to provide the power needed by the station.
-
Page 61: More About Sdi-12
More about SDI-12 Overview SDI-12 is a standard for interfacing data recorders with microprocessor based sensors. SDI-12 stands for serial data interface at 1200 baud. SDI-12 is intended for applications with the following requirements: • Battery powered operation with minimal current drain •... -
Page 62: Wiring Guidelines
Most sensors are factory default set to address zero (0). If/when interfacing more than one sensor to MONITOR, each sensor must be assigned a unique address. This is normally done by setting dipswitches on the sensor or by software commands. Failure to set unique addresses for each sensor will result in failure of the communications interface (i.e. -
Page 63: Useful Sdi Commands
Useful SDI commands Resetting the address by software (some sensors) is normally done by sending the aAb! command. (a A b !, where a is the current address of the sensor you want to change and b is the address you want to change to, e.g. 0A5! changes the address of sensor 0 to address Another useful SDI-12 command is the aI! (where a is the address of the sensor, e.g. -
Page 64: Gps
Coordinated Time) is an internationally accept time standard. UTC will differ from the local time by a number of hours. The user can setup the MONITOR so that it keeps local time by changing the variable Local Time Offset. To get EST, set the local time offset to -5 hours. -
Page 65: Gps Positioning
GPS Positioning If the MONITOR is reporting that the GPS cannot get a time fix, it means that the GPS is unable to get a clear view of the sky. It could also be the case that the GPS is picking up interference. -
Page 66: Jumpers
GPS has been improperly configured. If possible, try using a different GPS module. If a faulty GPS is connect to the MONITOR, of it the GSP is not connected to the MONITOR, the MONITOR will take a full minute before deciding it cannot talk to the GPS. - Page 67 Garmin converter Sutron unit plug color 1 Red Blue Power 8 to 40V for 16HVS 2 Black Orange Ground 3 Yellow Black 8 CTS Remote On if <0.3V, Off if power open circuit on/off 4 Blue Port 1 Data NMEA input to GPS...
-
Page 68: Modbus
Modbus MONITOR can be configured as a Modbus slave device. In this mode, the unit will respond to properly formed Modbus messages in either RTU (default) or ASCII format. Keep in mind that when Modbus has been enabled, the unit will not be capable of connecting to a PC/PDA to download a log or make setup changes, but AutoPoll can be used to access log data. - Page 69 Modbus Protocol Default is RTU. There are two protocols available to the user, RTU and ASCII. In RTU mode a compatible Modbus master device must generate messages, as strict timing is required for a successful communication. This mode allows for better data throughput than ASCII mode for the same baud rate.
-
Page 70: Modbus Function Codes
Modbus Function Codes The following table identifies the functions that are supported. Each diagnostic counter is cleared when the device is powered up or reset. Code Subcode Read Holding Registers 0x03 Read Input Register 0x04 Write Single Register 0x06 Diagnostic 0x08 Return Query Data 0x00... - Page 71 Holding Registers Holding registers are reserved for the purpose of setting and getting data such as the date and time and diagnostic counts if the ability to send the above Diagnostic (0x08) command is not available. The following table identifies the holding registers and their locations.
- Page 72 MONITOR. This will ensure data will follow that found in the MONITOR log. If the last measured data is not acceptable, a live reading can be forced by writing to the Force Measurement (1010) holding register.
-
Page 73: Get Log Command
Get Log Command The Get Log subcode is used to retrieve log data from the unit. The format of the command is as follows: GL,logfilename,datetime,recordID,numbytes • The logfilename can be used to return log entries of specific types. The available types are data, events, and all. - Page 74 Example: command: GL,data,02/07/2007 15:50:00,80,0 reply: GLR,0,0,38,02/07/2007,15:51:00,VBAT,13.16,Volts,G Wrapped for 37,10/07/2003,15:51:10,A,10.89,5.2,-25.4 illustration purposes only. command: GL,data,02/07/2007 15:50:00,80,2 reply: GLR,0,2,37,02/07/2007,15:54:00,C,10.89,5.2,-25.4,0 The GLR response will contain as many log records as can fit into the response. The numbytes value in the GLR response does not include the comma preceding the data, and refers to the number of data bytes from the log that are being returned, not the number of packet bytes used to store the response (which would be twice the data bytes when ASCII protocol is selected).
-
Page 75: Appendix A - Monitor Specifications
<1mA standby <20mA active Mechanical Enclosure NEMA-4 Fiberglass Dimensions Monitor-1 5”x5”x4”, Monitor-4 12” x 14” x 8” Display 2x20 character backlit LCD Keypad 6 buttons SD card slot with activity LED For download data and read/write setups Red Warning LED... - Page 76 Digital Input 1 – tipping bucket type 100KOhm resistor to +5V Switch contact type Digital Input 2 – frequency type Maximum frequency Input range 0-5V Ordering Information Part Number Description Monitor-1 Monitor, 5x5x4 NEMA enclosure Monitor-4 Monitor, 12x14x8 NEMA with 7amp-hr battery and regulator...
-
Page 77: Appendix B - Sutron Customer Service Policy
Dear Customer: Thank you for making the important decision to purchase Sutron equipment. All Sutron equipment is manufactured and tested to the highest quality standards as set by Sutron’s Quality Assurance Department. Our Customer Service Representatives have years of experience with equipment, systems, and services. They are electronic technicians with field and applications experience, not just with a technical background. -
Page 78: Appendix C - Commercial Warranty
The above Warranty applies only to products manufactured by Sutron. Equipment provided, but not manufactured by Sutron, is warranted and will be repaired to the extent of and according to the current terms and conditions of the respective equipment manufacturers. -
Page 79: Index
INDEX ? Indicator ........... 47 Installation and Setup...... 64 Auto Output ........28, 53 Local Time Offset ..... 64, 65 Battery Positioning the Antenna....65 Battery Low ........45 Hardware Error ........47 Connections........5 Hardware Flow Ctrl ......29 Measurement........ - Page 80 Soil ..........25 Connector.......... 5 Subsamples ........11 Minimizing Errors......63 Temperature ........27 Overview......... 61 Tipping Bucket........ 16 Sensor Setup........62 Type ..........11 Wiring Guidelines......62 Type ..........16 www.sdi-12.org....... 62 Warmup........... 22 Sensor Example Wind..........23 Bridge..........32 Menu Tree...........
Need help?
Do you have a question about the MONITOR and is the answer not in the manual?
Questions and answers