Table of Contents
Advertisement
Quick Links
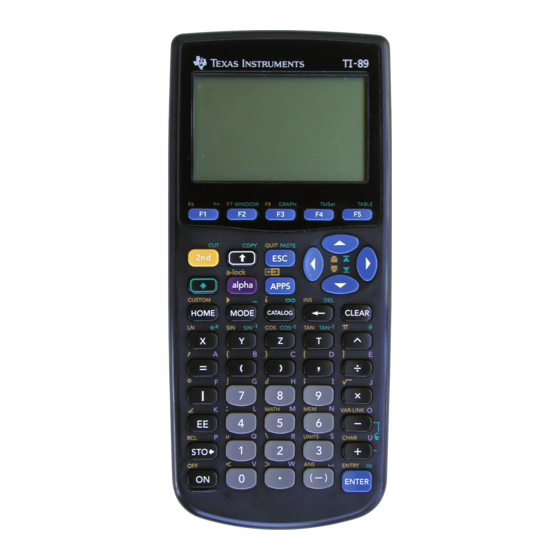
ti
TI-89 / TI-92 Plus / Voyage™ 200
Statistics with List Editor
Important Information
Where to Find Installation Instructions
How to contact Support and Service
License Agreement
Table of Contents
The Statistics with List Editor application (Stats/List Editor) adds inferential
and more advanced statistics functionality to the TI-89 / TI-92 Plus /
Voyage™ 200 PLT through an easy-to-use list editor interface.
The Stats/List Editor is really two application in one. The list editor
provides a means for viewing, editing, and working with data lists. The
Statistics portion of the application provides basic inferential and
advanced statistics functionality. The two work together to let you view
and perform statistical analyses on data lists.
Copyright © 1999–2002 Texas Instruments Incorporated
Advertisement
Table of Contents

Related Manuals for Texas Instruments TI-89


Summary of Contents for Texas Instruments TI-89
- Page 1 Table of Contents The Statistics with List Editor application (Stats/List Editor) adds inferential and more advanced statistics functionality to the TI-89 / TI-92 Plus / Voyage™ 200 PLT through an easy-to-use list editor interface. The Stats/List Editor is really two application in one. The list editor provides a means for viewing, editing, and working with data lists.
-
Page 2: Important Information
“as-is” basis. In no event shall Texas Instruments be liable to anyone for special, collateral, incidental, or consequential damages in connection with or arising out of the purchase or use of these materials, and the sole and exclusive liability of Texas Instruments, regardless of the form of action, shall not exceed the purchase price of this product. - Page 3 BY INSTALLING THIS SOFTWARE YOU AGREE TO ABIDE BY THE FOLLOWING PROVISIONS. LICENSE: Texas Instruments Incorporated (“TI”) grants you a license to use and copy the software program(s) (“License Materials”) contained on this diskette/CD/web site. You, and any subsequent user, may only use the Licensed Materials on Texas Instruments calculator products.
-
Page 4: Table Of Contents
Ops (Operations) Menu ........................44 Sort List ............................45 Sort List, Adjust All........................46 dim( ..............................47 Fill..............................48 seq( ..............................49 cumSum( ............................50 @List( .............................. 51 TI-89 / TI-92 Plus / Voyage™ 200 PLT Statistics with List Editor App... - Page 5 ! (factorial) ........................... 106 randInt( ............................107 .randNorm( ..........................108 randBin( ............................109 randSamp( ........................... 110 rand(............................. 111 RandSeed ............................ 112 CorrMat (Correlation Matrix)......................113 Show Stats ............................114 TI-89 / TI-92 Plus / Voyage™ 200 PLT Statistics with List Editor App...
- Page 6 ANOVA2-Way ............................. 173 ‰ Ints (Intervals) Menu ZInterval.............................. 178 TInterval.............................. 180 2-SampZInt ............................182 2-SampTInt ............................184 1-PropZInt............................186 2-PropZInt............................188 LinRegTInt ............................190 MultRegInt ............................193 TI-89 / TI-92 Plus / Voyage™ 200 PLT Statistics with List Editor App...
-
Page 7: Getting Started: Read This First
Example: Making Predictions with the Model ................15 Error Messages............................ 16 Note: You must set your TI-89 / TI-92 Plus / Voyage 200 PLT to the AUTO or APPROXIMATE mode when using the Stats/List Editor application. TI-89 / TI-92 Plus / Voyage™ 200 PLT Statistics with List Editor App... -
Page 8: Running And Quitting Stats/List Editor
¦ Tip: Press 2 a to toggle between applications. STATVARS Tip: Press 2 ° from anywhere on the calculator to open the menu. VAR-LINK [All] TI-89 / TI-92 Plus / Voyage™ 200 PLT Statistics with List Editor App Getting Started... -
Page 9: Stats/List Editor Catalog
N = Number of trials LOW = Lower limit UP = Upper limit P = Probability of success Notes: Always separate arguments with commas. Arguments in brackets are optional. TI-89 / TI-92 Plus / Voyage™ 200 PLT Statistics with List Editor App Getting Started... -
Page 10: Stats/List Editor Screens
Stats/List Editor Screens Understanding the Stats/List Editor Screens Note: All the screens used in this documentation were taken from the TI-89 calculator. The screens displayed on the TI-92 Plus / Voyage™ 200 PLT are similar. list editor menus dialog boxes... -
Page 11: Example: Pendulum Lengths And Periods
Note: Removing lists from the list editor does not delete them from memory. However, clearing elements from lists does delete the elements permanently from memory. list1 list2 list1 ‘ B ‘ ¸ list1 list2 TI-89 / TI-92 Plus / Voyage™ 200 PLT Statistics with List Editor App Getting Started... -
Page 12: Example: Entering The Data
Ë Í list1 Length (cm): 13.2 23.1 24.4 26.6 30.5 34.3 37.6 41.5 list2 Ë Í list2 Time (sec): 1.01 1.08 1.13 1.26 1.28 1.32 TI-89 / TI-92 Plus / Voyage™ 200 PLT Statistics with List Editor App Getting Started... -
Page 13: Example: Plotting The Data
¸ more than once in order to calculate the results. Press ¸ once to save your information, and then press ¸ again to close a dialog box. TI-89 / TI-92 Plus / Voyage™ 200 PLT Statistics with List Editor App Getting Started... - Page 14 ‡ ZoomData Tip: To return to the list editor after graphing an equation or plotting data, press 2 a. TI-89 / TI-92 Plus / Voyage™ 200 PLT Statistics with List Editor App Getting Started...
-
Page 15: Example: Fitting A Line To The Data
ƒ 9:Format to display the FORMATS dialog box, Change the Results->Editor setting to NO, and then press Í. resid is stored in the STATVARS folder. ¥ % TI-89 / TI-92 Plus / Voyage™ 200 PLT Statistics with List Editor App Getting Started... -
Page 16: Example: Producing A Scatter Plot Of The Residuals
Í resid list1 list1 ¦ „ Plots 3:PlotsOff ¦ „ Plots 4:FnOff „ Plots 1:Plot Setup Plot Setup TI-89 / TI-92 Plus / Voyage™ 200 PLT Statistics with List Editor App Getting Started... - Page 17 Note: If you paste a variable name that is not in the current folder, the variable’s pathname is pasted as well. Use Freq and Categories? Í Plot2 ‡ ZoomData Plot2 TI-89 / TI-92 Plus / Voyage™ 200 PLT Statistics with List Editor App Getting Started...
-
Page 18: Example: Producing A Power Regression
ƒ ( Note: If the Results->Editor Formats) dialog box is set to are pasted to the end of the list resid residt editor. ¥ s TI-89 / TI-92 Plus / Voyage™ 200 PLT Statistics with List Editor App Getting Started... -
Page 19: Example: Producing Another Residual Plot With The New Data
Example: Producing Another Residual Plot with the New Data … ¦ „ Plots 3:PlotsOff ¦ „ Plots 4:FnOff „ Plots 1:Plot Setup Plot † Ÿ Setup Plot 2 ‡ ZoomData Plot2 TI-89 / TI-92 Plus / Voyage™ 200 PLT Statistics with List Editor App Getting Started... -
Page 20: Example: Producing Magnitudes Of The Residuals
Example: Producing Magnitudes of the Residuals … Trace TI-89 / TI-92 Plus / Voyage™ 200 PLT Statistics with List Editor App Getting Started... -
Page 21: Example: Making Predictions With The Model
From the text Contemporary Precalculus through Applications Copyright © 1999,1992. Everyday Learning Corporation Exercise Set 6 from Chapter 1 . Data Analysis One, pages 21, 22, and TI-89 / TI-92 Plus / Voyage™ 200 PLT Statistics with List Editor App Getting Started... -
Page 22: Error Messages
Press „ ( ) and select to display the • Plots 1:Plot Setup Plot Setup dialog box. Highlight any unnecessary plots and press … ( • Clear TI-89 / TI-92 Plus / Voyage™ 200 PLT Statistics with List Editor App Getting Started... -
Page 23: List Editor
List Editor Using the List Editor..........................18 Creating Lists............................20 Removing Lists ............................ 21 Editing a List Element ......................... 23 Formulas .............................. 24 … List Menu TI-89 / TI-92 Plus / Voyage™ 200 PLT Statistics with List Editor App List Editor... -
Page 24: Using The List Editor
Move to the first list in the list editor. ¥ A ¥ A Move to the last list in the list editor. ¥ B ¥ B TI-89 / TI-92 Plus / Voyage™ 200 PLT Statistics with List Editor App List Editor... - Page 25 Enter name The new list name cell is highlighted. The Name= prompt is displayed in the entry line. You may enter a list name. TI-89 / TI-92 Plus / Voyage™ 200 PLT Statistics with List Editor App List Editor...
-
Page 26: Creating Lists
List 1:Names VAR-LINK [ALL] ¸ ¦ Name= letter from A to Z or q AB22 Ab22 aB22 ab22 LineVert xmin xmax Í ¦ Name= ¸ TI-89 / TI-92 Plus / Voyage™ 200 PLT Statistics with List Editor App List Editor... -
Page 27: Removing Lists
Note: If you archive a list, the Stats/List Editor lets you open and view the list. You cannot store values to this archived list. You must unarchive an archived list before you can delete it. TI-89 / TI-92 Plus / Voyage™ 200 PLT Statistics with List Editor App List Editor... - Page 28 List C 2 ½ … List C ú ¸ clrList( clrList( ¸ list1 Note: TIStat.clrlist(list1) and the Done message are displayed when the list is cleared. TI-89 / TI-92 Plus / Voyage™ 200 PLT Statistics with List Editor App List Editor...
-
Page 29: Editing A List Element
Note: To cancel any editing and restore the original element at the rectangular cursor, press N. Í C & Note: You can enter expressions (as shown above) and variables for list elements, but they must resolve to a single value. TI-89 / TI-92 Plus / Voyage™ 200 PLT Statistics with List Editor App List Editor... -
Page 30: Formulas
(list1+10) and stores it to the target list (list2). TI-89 / TI-92 Plus / Voyage™ 200 PLT Statistics with List Editor App List Editor... - Page 31 Note: When you use a formula (or expression) to generate or update a list, the resulting calculations must resolve to a list. TI-89 / TI-92 Plus / Voyage™ 200 PLT Statistics with List Editor App List Editor...
- Page 32 List Formula dialog box to edit the formula. Detaching a Formula from a List Name ¦ list2 ‘ Í é & ¦ list2 ¸ ¸ é & TI-89 / TI-92 Plus / Voyage™ 200 PLT Statistics with List Editor App List Editor...
- Page 33 Setup Editor ............................28 Copy and Paste............................ 29 Clear a-z..............................30 Clear Editor ............................31 Format ..............................32 About ..............................33 ƒ Tools Copy Paste ƒ TI-89 / TI-92 Plus / Voyage™ 200 PLT Statistics with List Editor App Tools Menu...
-
Page 34: Tools Menu
, highlight a list name, and then ¸ press to paste a list name into this field. Be sure to separate the arguments with a comma ( ¸ ƒ TI-89 / TI-92 Plus / Voyage™ 200 PLT Statistics with List Editor App Tools Menu... -
Page 35: Copy And Paste
92 Plus / Voyage™ 200 PLT Tip: You can press C to ¥ ƒ copy or V to paste without having to use the toolbar menu. ƒ TI-89 / TI-92 Plus / Voyage™ 200 PLT Statistics with List Editor App Tools Menu... -
Page 36: Clear A-Z
Example ƒ Tools 7:Clear a-z Clear a-z ¸ Note: You cannot use the Clear a-z command in a program; instead, use the DelVar command. ƒ TI-89 / TI-92 Plus / Voyage™ 200 PLT Statistics with List Editor App Tools Menu... -
Page 37: Clear Editor
Note: The Clear Editor command is not available under the CATALOG. In programs, you must use SetupEd, ClrList, or DelVar commands. ƒ TI-89 / TI-92 Plus / Voyage™ 200 PLT Statistics with List Editor App Tools Menu... -
Page 38: Format
, the elements in a list to which a ¦ Auto-calculate formula is attached, are automatically updated when you edit the formula. Example ƒ Tools 9:Format FORMATS ƒ TI-89 / TI-92 Plus / Voyage™ 200 PLT Statistics with List Editor App Tools Menu... -
Page 39: About
¸ education.ti.com Example ƒ ¦ Tools ƒ ¦ Tools A Note: The About dialog box will not look exactly like the one shown here. ƒ TI-89 / TI-92 Plus / Voyage™ 200 PLT Statistics with List Editor App Tools Menu... - Page 40 ƒ TI-89 / TI-92 Plus / Voyage™ 200 PLT Statistics with List Editor App Tools Menu...
-
Page 41: Plots Menu
This chapter assumes that you know how to create lists using the Stats/List Editor application. If necessary, review the information on creating lists in the Lists and … List Menu chapters in this user guide. „ Plots Menu TI-89 / TI-92 Plus / Voyage™ 200 PLT Statistics with List Editor App... -
Page 42: Plot Setup
Include Categories Category calculation to specified category values. For example, if you specify }, the calculation uses only data points with a category value of „ Plots Menu TI-89 / TI-92 Plus / Voyage™ 200 PLT Statistics with List Editor App... - Page 43 ‡ (ZoomData) lets you set the viewing window to display all statistical data points without having to access this function in the Y= Editor, Window Editor, or Graph Screen. „ Plots Menu TI-89 / TI-92 Plus / Voyage™ 200 PLT Statistics with List Editor App...
-
Page 44: Norm Prob Plot (Normal Probability Plot)
.randNorm Calc NUMTRIALS m s NUMTRIALS randNorm( list1 Norm Prob Plot „ „ Plots 3:PlotsOff Plots 4:FnOff † list1, Calc 4:Probability. 6:.randNorm( .randNorm( .randNorm( „ Plots Menu TI-89 / TI-92 Plus / Voyage™ 200 PLT Statistics with List Editor App... - Page 45 Note: Use the default list variable name in the Store Zscores to input box. The “statvars/zscores” variable name is truncated in the screenshot above. ¸ zscores „ Plots 1:Plot Setup Plot Setup ‡ ZoomData Norm Prob Plot „ Plots Menu TI-89 / TI-92 Plus / Voyage™ 200 PLT Statistics with List Editor App...
-
Page 46: Plotsoff (Plots Off) And Fnoff (Functions Off)
¦ PlotsOff Æ „ Plots 3:PlotsOff PlotsOff ¦ FnOff Æ „ Plots 4:FnOff Examples ¦ PlotsOff „ Plots 3:PlotsOff ¦ FnOff „ Plots 4:FnOff „ Plots Menu TI-89 / TI-92 Plus / Voyage™ 200 PLT Statistics with List Editor App... -
Page 47: List Menu
............................62 stdDev(............................63 variance( ............................64 stDevPop( ............................65 varPop( ............................66 Attach List Formula ..........................67 Delete Item ............................68 … List … List Menu TI-89 / TI-92 Plus / Voyage™ 200 PLT Statistics with List Editor App... -
Page 48: Introduction
Functions that are not followed by an open parenthesis ¦ SinReg Inputs Outputs SinReg input dialog box SinReg output dialog box Using the CATALOG to Access Functions and Commands CATALOG CATALOG … List Menu TI-89 / TI-92 Plus / Voyage™ 200 PLT Statistics with List Editor App... -
Page 49: Names Menu
… (List) menu, only list names are displayed, but when you Note: When you select 1:Names press 2 °, all variable types, including lists, are displayed. … List Menu TI-89 / TI-92 Plus / Voyage™ 200 PLT Statistics with List Editor App... -
Page 50: Ops (Operations) Menu
Returns the leftmost specified elements in a list. left( Returns the middle specified elements in a list. mid( Returns the rightmost specified elements in a list. right( … List Menu TI-89 / TI-92 Plus / Voyage™ 200 PLT Statistics with List Editor App... -
Page 51: Sort List
2 °, highlight the list name, and press ¸ to paste the list name into the List field. Separate each list name with a comma (b). ¸ … List Menu TI-89 / TI-92 Plus / Voyage™ 200 PLT Statistics with List Editor App... -
Page 52: Sort List, Adjust All
… List 2:Ops. 2:Sort List, Adjust All. Sort List, Adjust independent list2), Key List Sort Order Descending ¸ Key List … List Menu TI-89 / TI-92 Plus / Voyage™ 200 PLT Statistics with List Editor App... -
Page 53: Dim
¸ to paste the list name into the list editor. Be sure to close arguments with a right parenthesis (d). ¸ The dimension of list1 is 5. … List Menu TI-89 / TI-92 Plus / Voyage™ 200 PLT Statistics with List Editor App... -
Page 54: Fill
You can also press … (List) and select 1:Names to display the VAR-LINK [All] menu. ¸ All of the elements in list1 are replaced with the fill value 1.01 … List Menu TI-89 / TI-92 Plus / Voyage™ 200 PLT Statistics with List Editor App... -
Page 55: Seq
¥ ¸. You can also set the calculator to APPROXIMATE mode. (Press 3 „ and then set Exact/Approx to APPROXIMATE.) … List Menu TI-89 / TI-92 Plus / Voyage™ 200 PLT Statistics with List Editor App... -
Page 56: Cumsum
¥ ¸. You can also set the calculator to APPROXIMATE mode. (Press 3 „ and then set Exact/Approx to APPROXIMATE.) … List Menu TI-89 / TI-92 Plus / Voyage™ 200 PLT Statistics with List Editor App... -
Page 57: List
VAR-LINK [All] menu. ¸ The difference between element 1 and element 2 is 10; the difference between element 2 and element 3 is 15, etc. … List Menu TI-89 / TI-92 Plus / Voyage™ 200 PLT Statistics with List Editor App... -
Page 58: Augment
Be sure to close arguments with a right parenthesis (d). You can also press … (List) and select 1:Names to display the VAR-LINK [All] menu. ¸ … List Menu TI-89 / TI-92 Plus / Voyage™ 200 PLT Statistics with List Editor App... -
Page 59: Left
You can also press … (List) and select 1:Names to display the VAR-LINK [All] menu. ¸ The 3 leftmost elements in list1 are 5, 10, and 15. … List Menu TI-89 / TI-92 Plus / Voyage™ 200 PLT Statistics with List Editor App... -
Page 60: Mid
You can also press … (List) and select 1:Names to display the VAR-LINK [All] menu. ¸ Beginning with the third element in list1, the two middle elements are 15 and 20. … List Menu TI-89 / TI-92 Plus / Voyage™ 200 PLT Statistics with List Editor App... -
Page 61: Right
You can also press … (List) and select 1:Names to display the VAR-LINK [All] menu. ¸ The 3 rightmost elements in list1 are 20, 25, 30. … List Menu TI-89 / TI-92 Plus / Voyage™ 200 PLT Statistics with List Editor App... -
Page 62: Math Menu
Returns the standard deviation of a population based on the sample stDevPop( contained in the list. Returns the variance of a population based on the sample contained in a varPop( list. … List Menu TI-89 / TI-92 Plus / Voyage™ 200 PLT Statistics with List Editor App... -
Page 63: Min
Be sure to close arguments with a right parenthesis (d). You can also press … (List) and select 1:Names to display the VAR-LINK [All] menu. ¸ … List Menu TI-89 / TI-92 Plus / Voyage™ 200 PLT Statistics with List Editor App... -
Page 64: Max
Be sure to close arguments with a right parenthesis (d). You can also press … (List) and select 1:Names to display the VAR-LINK [All] menu. ¸ … List Menu TI-89 / TI-92 Plus / Voyage™ 200 PLT Statistics with List Editor App... -
Page 65: Mean
¥ ¸. You can also set the calculator to APPROXIMATE mode. (Press 3 „ and then set Exact/Approx to APPROXIMATE.) … List Menu TI-89 / TI-92 Plus / Voyage™ 200 PLT Statistics with List Editor App... -
Page 66: Median
(d). You can also press … (List) and select 1:Names to display the VAR-LINK [All] menu. ¸ The median of the elements is 8. … List Menu TI-89 / TI-92 Plus / Voyage™ 200 PLT Statistics with List Editor App... -
Page 67: Sum
(d). You can also press … (List) and select 1:Names to display the VAR-LINK [All] menu. ¸ The sum of the elements is 15 … List Menu TI-89 / TI-92 Plus / Voyage™ 200 PLT Statistics with List Editor App... -
Page 68: Product
(d). You can also press … (List) and select 1:Names to display the VAR-LINK [All] menu. ¸ The product of the elements is 24. … List Menu TI-89 / TI-92 Plus / Voyage™ 200 PLT Statistics with List Editor App... -
Page 69: Stddev
¥ ¸. You can also set the calculator to APPROXIMATE mode. (Press 3 „ and then set Exact/Approx to APPROXIMATE.) … List Menu TI-89 / TI-92 Plus / Voyage™ 200 PLT Statistics with List Editor App... -
Page 70: Variance
¥ ¸. You can also set the calculator to APPROXIMATE mode. (Press 3 „ and then set Exact/Approx to APPROXIMATE.) … List Menu TI-89 / TI-92 Plus / Voyage™ 200 PLT Statistics with List Editor App... -
Page 71: Stdevpop
¥ ¸. You can also set the calculator to APPROXIMATE mode. (Press 3 „ and then set Exact/Approx to APPROXIMATE.) … List Menu TI-89 / TI-92 Plus / Voyage™ 200 PLT Statistics with List Editor App... -
Page 72: Varpop
¥ ¸. You can also set the calculator to APPROXIMATE mode. (Press 3 „ and then set Exact/Approx to APPROXIMATE.) … List Menu TI-89 / TI-92 Plus / Voyage™ 200 PLT Statistics with List Editor App... -
Page 73: Attach List Formula
Note: In this case, the formula will not be in quotation marks in the entry line, and the lock symbol (é) will not display next to list2. … List Menu TI-89 / TI-92 Plus / Voyage™ 200 PLT Statistics with List Editor App... -
Page 74: Delete Item
Be sure to close arguments with a right parenthesis (d). You can also press … (List) and select 1:Names to display the VAR-LINK [All] menu. … List Menu TI-89 / TI-92 Plus / Voyage™ 200 PLT Statistics with List Editor App... -
Page 75: Calc Menu
.randNorm( ..........................108 randBin( ............................109 randSamp( ........................... 110 rand(............................. 111 RandSeed ............................ 112 CorrMat (Correlation Matrix)......................113 Show Stats ............................114 † Calc † Calc Menu TI-89 / TI-92 Plus / Voyage™ 200 PLT Statistics with List Editor App... -
Page 76: Introduction
Functions that are not followed by an open parenthesis ¦ SinReg Inputs Outputs SinReg input dialog box SinReg output dialog box Using the CATALOG to Access Functions and Commands CATALOG CATALOG † Calc Menu TI-89 / TI-92 Plus / Voyage™ 200 PLT Statistics with List Editor App... -
Page 77: Var Stats (One-Variable Statistics)
To enter the list elements in the field, simply key in the elements inside the pair of braces ( {} ) in the field. Outputs for List mat1var STATVARS v Gx etc.) mat1var † Calc Menu TI-89 / TI-92 Plus / Voyage™ 200 PLT Statistics with List Editor App... - Page 78 (d). You can also press … (List) and select 1:Names to display the VAR-LINK [All] menu. † Calc Menu TI-89 / TI-92 Plus / Voyage™ 200 PLT Statistics with List Editor App...
-
Page 79: Var Stats (Two-Variable Statistics)
Description Æ † Calc 2:2-Var Stats 2.Var Stats Inputs X List Y List Freq optional List Category List optional Include Categories Category List optional † Calc Menu TI-89 / TI-92 Plus / Voyage™ 200 PLT Statistics with List Editor App... - Page 80 MinX min_x q1_x MedX med_x q3_x MaxX max_x MinY min_y q1_y MedY med_y q3_y MaxY max_y G(x-v) ssdevx G(y-w) ssdevy † Calc Menu TI-89 / TI-92 Plus / Voyage™ 200 PLT Statistics with List Editor App...
- Page 81 (d). You can also press … (List) and select 1:Names to display the VAR-LINK [All] menu. † Calc Menu TI-89 / TI-92 Plus / Voyage™ 200 PLT Statistics with List Editor App...
-
Page 82: Regressions Menu
QuartReg quartic regression LnReg logarithmic regression ExpReg exponential regression PowerReg power regression Logist83 Logistic logistic regression SinReg sinusoidal regression MultReg multiple regression † Calc Menu TI-89 / TI-92 Plus / Voyage™ 200 PLT Statistics with List Editor App... -
Page 83: Linreg(A+Bx)
* Output variable is pasted to the end of the list editor when Results -> Editor option is YES, (located in ƒ (Tools) 9:Format). If RegEqn, Freq, Category List, or Include Categories are used as inputs, these are also outputs. † † Calc Menu TI-89 / TI-92 Plus / Voyage™ 200 PLT Statistics with List Editor App... - Page 84 ƒ (Tools) and select 9:Format to display the FORMATS dialog box. Change the Results->Editor setting to NO and press Í. † Calc Menu TI-89 / TI-92 Plus / Voyage™ 200 PLT Statistics with List Editor App...
-
Page 85: Linreg(Ax+B)
* Output variable is pasted to the end of the list editor when Results -> Editor option is YES, (located in ƒ (Tools) 9:Format). If RegEqn, Freq, Category List, or Include Categories are used as inputs, these are also outputs. † † Calc Menu TI-89 / TI-92 Plus / Voyage™ 200 PLT Statistics with List Editor App... - Page 86 ƒ (Tools) and select 9:Format to display the FORMATS dialog box. Change the Results->Editor setting to NO and press Í. † Calc Menu TI-89 / TI-92 Plus / Voyage™ 200 PLT Statistics with List Editor App...
-
Page 87: Medmed
* Output variable is pasted to the end of the list editor when Results -> Editor option is YES, (located in ƒ (Tools) 9:Format). † If RegEqn, Freq, Category List, or Include Categories are used as inputs, these are also outputs. † Calc Menu TI-89 / TI-92 Plus / Voyage™ 200 PLT Statistics with List Editor App... - Page 88 ƒ (Tools) and select 9:Format to display the FORMATS dialog box. Change the Results->Editor setting to NO and press Í. † Calc Menu TI-89 / TI-92 Plus / Voyage™ 200 PLT Statistics with List Editor App...
-
Page 89: Quadreg
* Output variable is pasted to the end of the list editor when Results -> Editor option is YES, (located in ƒ (Tools) 9:Format). † If RegEqn, Freq, Category List, or Include Categories are used as inputs, these are also outputs. † Calc Menu TI-89 / TI-92 Plus / Voyage™ 200 PLT Statistics with List Editor App... - Page 90 ƒ (Tools) and select 9:Format to display the FORMATS dialog box. Change the Results->Editor setting to NO and press Í. † Calc Menu TI-89 / TI-92 Plus / Voyage™ 200 PLT Statistics with List Editor App...
-
Page 91: Cubicreg
* Output variable is pasted to the end of the list editor when Results -> Editor option is YES, (located in ƒ (Tools) 9:Format). † If RegEqn, Freq, Category List, or Include Categories are used as inputs, these are also outputs. † Calc Menu TI-89 / TI-92 Plus / Voyage™ 200 PLT Statistics with List Editor App... - Page 92 ƒ (Tools) and select 9:Format to display the FORMATS dialog box. Change the Results->Editor setting to NO and press Í. † Calc Menu TI-89 / TI-92 Plus / Voyage™ 200 PLT Statistics with List Editor App...
-
Page 93: Quartreg
* Output variable is pasted to the end of the list editor when Results -> Editor option is YES, (located in ƒ (Tools) 9:Format). † If RegEqn, Freq, Category List, or Include Categories are used as inputs, these are also outputs. † Calc Menu TI-89 / TI-92 Plus / Voyage™ 200 PLT Statistics with List Editor App... - Page 94 ƒ (Tools) and select 9:Format to display the FORMATS dialog box. Change the Results->Editor setting to NO and press Í. † Calc Menu TI-89 / TI-92 Plus / Voyage™ 200 PLT Statistics with List Editor App...
-
Page 95: Lnreg
* Output variable is pasted to the end of the list editor when Results -> Editor option is YES, (located in ƒ (Tools) 9:Format). If RegEqn, Freq, Category List, or Include Categories are used as inputs, these are also outputs. † † Calc Menu TI-89 / TI-92 Plus / Voyage™ 200 PLT Statistics with List Editor App... - Page 96 ƒ (Tools) and select 9:Format to display the FORMATS dialog box. Change the Results->Editor setting to NO and press Í. † Calc Menu TI-89 / TI-92 Plus / Voyage™ 200 PLT Statistics with List Editor App...
-
Page 97: Expreg
* Output variable is pasted to the end of the list editor when Results -> Editor option is YES, (located in ƒ (Tools) 9:Format). If RegEqn, Freq, Category List, or Include Categories are used as inputs, these are also outputs. † † Calc Menu TI-89 / TI-92 Plus / Voyage™ 200 PLT Statistics with List Editor App... - Page 98 ƒ (Tools) and select 9:Format to display the FORMATS dialog box. Change the Results->Editor setting to NO and press Í. † Calc Menu TI-89 / TI-92 Plus / Voyage™ 200 PLT Statistics with List Editor App...
-
Page 99: Powerreg
* Output variable is pasted to the end of the list editor when Results -> Editor option is YES, (located in ƒ (Tools) 9:Format). If RegEqn, Freq, Category List, or Include Categories are used as inputs, these are also outputs. † † Calc Menu TI-89 / TI-92 Plus / Voyage™ 200 PLT Statistics with List Editor App... - Page 100 ƒ (Tools) and select 9:Format to display the FORMATS dialog box. Change the Results->Editor setting to NO and press Í. † Calc Menu TI-89 / TI-92 Plus / Voyage™ 200 PLT Statistics with List Editor App...
-
Page 101: Logist83
* Output variable is pasted to the end of the list editor when Results -> Editor option is YES, (located in ƒ (Tools) 9:Format). If RegEqn, Freq, Category List, or Include Categories are used as inputs, these are also outputs. † † Calc Menu TI-89 / TI-92 Plus / Voyage™ 200 PLT Statistics with List Editor App... - Page 102 ƒ (Tools) and select 9:Format to display the FORMATS dialog box. Change the Results->Editor setting to NO and press Í. † Calc Menu TI-89 / TI-92 Plus / Voyage™ 200 PLT Statistics with List Editor App...
-
Page 103: Logistic
* Output variable is pasted to the end of the list editor when Results -> Editor option is YES, (located in ƒ (Tools) 9:Format). If RegEqn, Freq, Category List, or Include Categories are used as inputs, these are also outputs. † † Calc Menu TI-89 / TI-92 Plus / Voyage™ 200 PLT Statistics with List Editor App... - Page 104 ƒ (Tools) and select 9:Format to display the FORMATS dialog box. Change the Results->Editor setting to NO and press Í. † Calc Menu TI-89 / TI-92 Plus / Voyage™ 200 PLT Statistics with List Editor App...
-
Page 105: Sinreg
* Output variable is pasted to the end of the list editor when Results -> Editor option is YES, (located in ƒ (Tools) 9:Format). If RegEqn, Freq, Category List, or Include Categories are used as inputs, these are also outputs. † † Calc Menu TI-89 / TI-92 Plus / Voyage™ 200 PLT Statistics with List Editor App... - Page 106 ƒ (Tools) and select 9:Format to display the FORMATS dialog box. Change the Results->Editor setting to NO and press Í. † Calc Menu 100 TI-89 / TI-92 Plus / Voyage™ 200 PLT Statistics with List Editor App...
-
Page 107: Multreg
ƒ (Tools) and select 9:Format to display the FORMATS dialog box. Change the Results->Editor setting to NO and press Í. † Calc Menu 101 TI-89 / TI-92 Plus / Voyage™ 200 PLT Statistics with List Editor App... -
Page 108: Probability Menu
NOREP NOREP rand( rand( LIST random number rand( LIST rand( LIST ë ë RandSeed Integer Seed π random seed Integer Seed seed1 seed2 † Calc Menu 102 TI-89 / TI-92 Plus / Voyage™ 200 PLT Statistics with List Editor App... -
Page 109: Rand83
NUMTRIALS NUMTRIALS Example list3 † Calc 4:Probability 1:rand83( rand83( Five values that are all between 0 and 1 are pasted into list3. † Calc Menu 103 TI-89 / TI-92 Plus / Voyage™ 200 PLT Statistics with List Editor App... -
Page 110: Npr
Æ † Calc 4:Probability 2:nPr( EXPR1 EXPR2 ⇒ LIST nPr( LIST EXPR1 EXPR2, Example list3={5,4,3} list4={2,4,2} list5 † Calc 4:Probability 2:nPr(. nPr( list3,list4 † Calc Menu 104 TI-89 / TI-92 Plus / Voyage™ 200 PLT Statistics with List Editor App... -
Page 111: Ncr
Æ † Calc 4:Probability 3:nCr( EXPR1 EXPR2 ⇒ LIST nCr( LIST EXPR1 EXPR2, Example list3={5,4,3} list4={2,4,2} list5 † Calc 4:Probability 3:nCr(. nCr( list3,list4 † Calc Menu 105 TI-89 / TI-92 Plus / Voyage™ 200 PLT Statistics with List Editor App... -
Page 112: (Factorial)
! (factorial) Description Æ Æ † Calc 4:Probability EXPR ⇒ LIST LIST EXPR Example list3={5,4,3} list3) † Calc 4:Probability 4:!. † Calc Menu 106 TI-89 / TI-92 Plus / Voyage™ 200 PLT Statistics with List Editor App... -
Page 113: Randint
Calc 4:Probability 5:randInt(. 5:randInt( 1,20,50) A list of 50 random integers with values between 1 and 20 is generated and displayed in list3. † Calc Menu 107 TI-89 / TI-92 Plus / Voyage™ 200 PLT Statistics with List Editor App... -
Page 114: Randnorm
NUMTRIALS. Example list3 † Calc 4:Probability. 6:.randNorm(. .randNorm( 0,1,50) m = 0 s = 1 NUMTRIALS = 50 † Calc Menu 108 TI-89 / TI-92 Plus / Voyage™ 200 PLT Statistics with List Editor App... -
Page 115: Randbin
NUMTRIALS = 10, the size of the data set A list of 10 random values from a binomial distribution with N = 7 is generated and displayed in list3. † Calc Menu 109 TI-89 / TI-92 Plus / Voyage™ 200 PLT Statistics with List Editor App... -
Page 116: Randsamp
LIST1 = list3, the input data CHOOSE = 6, the number in the random sample List4 = a random sample of 6 from list3 † Calc Menu 110 TI-89 / TI-92 Plus / Voyage™ 200 PLT Statistics with List Editor App... -
Page 117: Rand
ë ë Example † Calc 4:Probability. 9:rand( rand( A single random value between 1 and 5 is generated and displayed in list3. † Calc Menu 111 TI-89 / TI-92 Plus / Voyage™ 200 PLT Statistics with List Editor App... -
Page 118: Randseed
RandSeed Description Æ Æ † Calc 4:Probability A:RandSeed RandSeed ƒ Integer Seed seed1 seed2 Integer Seed Example † Calc 4:Probabilty A:RandSeed RandSeed 1147 † Calc Menu 112 TI-89 / TI-92 Plus / Voyage™ 200 PLT Statistics with List Editor App... -
Page 119: Corrmat (Correlation Matrix)
Calc 5:CorrMat. CorrMat " ¥ " Data/Matrix Editor, 2:Open. 2:Matrix 1:main matrix1 Note: You can also view the matrix from the Home screen. † Calc Menu 113 TI-89 / TI-92 Plus / Voyage™ 200 PLT Statistics with List Editor App... -
Page 120: Show Stats
Show Stats Description Æ † Calc 6:Show Stats Show Stats Procedure † Calc 6:Show Stats SinReg ¸ † Calc Menu 114 TI-89 / TI-92 Plus / Voyage™ 200 PLT Statistics with List Editor App... - Page 121 Binomial Cdf............................137 Poisson Pdf............................137 Poisson Cdf............................139 Geometric Pdf ............................ 140 Geometric Cdf ............................ 141 ‡ Distr Flash Apps CATALOG ‡ Distr (Distribution) Menu 115 TI-89 / TI-92 Plus / Voyage™ 200 PLT Statistics with List Editor App...
-
Page 122: Distr (Distribution) Menu
Shade Chi-square of freedom, df Area Lower Value Upper Value Û Shade F Num df Den df Lower Value Upper Value ‡ Distr (Distribution) Menu 116 TI-89 / TI-92 Plus / Voyage™ 200 PLT Statistics with List Editor App... -
Page 123: Shade Normal
1:Shade Normal Shade Normal Note: After completing a Shade function and viewing the graph, press 2 a to return to the Stats/List Editor. ‡ Distr (Distribution) Menu 117 TI-89 / TI-92 Plus / Voyage™ 200 PLT Statistics with List Editor App... -
Page 124: Shade T
2:Shade t Shade t Note: After completing a Shade function and viewing the graph, press 2 a to return to the Stats/List Editor. ‡ Distr (Distribution) Menu 118 TI-89 / TI-92 Plus / Voyage™ 200 PLT Statistics with List Editor App... -
Page 125: Shade Chi-Square
3:Shade Chi-square Shade Chi-square Note: After completing a Shade function and viewing the graph, press 2 a to return to the Stats/List Editor. ‡ Distr (Distribution) Menu 119 TI-89 / TI-92 Plus / Voyage™ 200 PLT Statistics with List Editor App... -
Page 126: Shade F
4:Shade F Shade F Note: After completing a Shade function and viewing the graph, press 2 a to return to the Stats/List Editor. ‡ Distr (Distribution) Menu 120 TI-89 / TI-92 Plus / Voyage™ 200 PLT Statistics with List Editor App... -
Page 127: Inverse Menu
Inverse t Inverse Area Deg of Freedom, df cñ Inverse Chi-square Inverse Deg of Freedom Area Û Inverse F Inverse Deg of Freedom ‡ Distr (Distribution) Menu 121 TI-89 / TI-92 Plus / Voyage™ 200 PLT Statistics with List Editor App... -
Page 128: Inverse Normal
Inverse Normal Inverse Area Inputs Area Outputs Inverse inverse Area STATVARS Example ‡ Dist 2:Inverse Inverse 1:Inverse Normal Inverse Normal ‡ Distr (Distribution) Menu 122 TI-89 / TI-92 Plus / Voyage™ 200 PLT Statistics with List Editor App... -
Page 129: Inverse T
Freedom df Area Inputs Area Deg of Freedom, df Outputs Inverse inverse Area STATVARS Example ‡ Dist 2:Inverse Inverse 2:Inverse t Inverse t ‡ Distr (Distribution) Menu 123 TI-89 / TI-92 Plus / Voyage™ 200 PLT Statistics with List Editor App... -
Page 130: Inverse Chi-Square
Area Deg of Freedom, df Outputs cñ Inverse inverse Û Area STATVARS Example ‡ Dist 2:Inverse Inverse 3:Inverse Chi-square Inverse Chi-square ‡ Distr (Distribution) Menu 124 TI-89 / TI-92 Plus / Voyage™ 200 PLT Statistics with List Editor App... -
Page 131: Inverse F
Den df Outputs Û Inverse inverse Û Area Num df Den df STATVARS Example ‡ Dist 2:Inverse Inverse 4:Inverse F Inverse F ‡ Distr (Distribution) Menu 125 TI-89 / TI-92 Plus / Voyage™ 200 PLT Statistics with List Editor App... -
Page 132: Normal Pdf
Normal Pdf X Value ( ) = > Inputs X Value Outputs X Value STATVARS Example 1 ‡ Dist 3:Normal Pdf Normal Pdf ‡ Distr (Distribution) Menu 126 TI-89 / TI-92 Plus / Voyage™ 200 PLT Statistics with List Editor App... - Page 133 Tip: For plotting the normal distribution, you can set window variables Xmin and Xmax so that the mean (m) falls between them and then select A:ZoomFit from the ZOOM menu. ‡ Distr (Distribution) Menu 127 TI-89 / TI-92 Plus / Voyage™ 200 PLT Statistics with List Editor App...
-
Page 134: Normal Cdf
Lower Value Upper Value Inputs Lower Value Lˆ Upper Value ˆ Outputs LowVal UpVal STATVARS Example ‡ Dist 4:Normal Cdf Normal Cdf ‡ Distr (Distribution) Menu 128 TI-89 / TI-92 Plus / Voyage™ 200 PLT Statistics with List Editor App... -
Page 135: Pdf
X Value x df Inputs X Value Deg of Freedom, df Outputs X Value STATVARS Example 1 ‡ Dist 5:t Pdf t Pdf ‡ Distr (Distribution) Menu 129 TI-89 / TI-92 Plus / Voyage™ 200 PLT Statistics with List Editor App... - Page 136 Ù b ¸ TIStat.tPdf( ¥ % Note: To return to the Stats/List Editor, you must press O then select Stats/List Editor. ‡ Distr (Distribution) Menu 130 TI-89 / TI-92 Plus / Voyage™ 200 PLT Statistics with List Editor App...
-
Page 137: Cdf
Inputs Lower Value Lˆ Upper Value ˆ Deg of Freedom, df Outputs LowVal UpVal STATVARS Example ‡ Dist 6:t Cdf t Cdf ‡ Distr (Distribution) Menu 131 TI-89 / TI-92 Plus / Voyage™ 200 PLT Statistics with List Editor App... -
Page 138: Chi-Square Pdf
Deg of Freedom, df c2pdf( ≥ (1/ 2) Inputs X Value Deg of Freedom, df Outputs X Value Example ‡ Dist 7:Chi-square Pdf Chi-square Pdf ‡ Distr (Distribution) Menu 132 TI-89 / TI-92 Plus / Voyage™ 200 PLT Statistics with List Editor App... -
Page 139: Chi-Square Cdf
Lower Value Lˆ cñ Upper Value ˆ Deg of Freedom, df Outputs cñ LowVal UpVal STATVARS Example ‡ Dist 8:Chi-square Cdf Chi-square Cdf ‡ Distr (Distribution) Menu 133 TI-89 / TI-92 Plus / Voyage™ 200 PLT Statistics with List Editor App... -
Page 140: F Pdf
X Value Num df Den df Outputs Û X Value Num df Den df STATVARS Example ‡ Dist 9:F Pdf F Pdf ‡ Distr (Distribution) Menu 134 TI-89 / TI-92 Plus / Voyage™ 200 PLT Statistics with List Editor App... -
Page 141: F Cdf
Num df Den df Outputs Û LowVal UpVal numdf dendf STATVARS Example A:F Cdf ‡ ¦ Dist ‡ ¦ Dist A F Cdf ‡ Distr (Distribution) Menu 135 TI-89 / TI-92 Plus / Voyage™ 200 PLT Statistics with List Editor App... -
Page 142: Binomial Pdf
Binomial Pdf Note: The Results"Editor must be ON in order to automatically append results to the list editor. To enter the FORMATS dialog box press ¥ Í for the TI-89; press ¥ Ô for the TI-92 Plus / Voyage™ 200 PLT. -
Page 143: Binomial Cdf
Binomial Cdf Note: The Results"Editor must be ON in order to automatically append results to the list editor. To enter the FORMATS dialog box press ¥ Í for the TI-89; press ¥ Ô for the TI-92 Plus / Voyage™ 200 PLT. -
Page 144: Poisson Pdf
X Value f(x) Inputs X Value Outputs X Value STATVARS Example D:Poisson Pdf ¦ ‡ Dist ¦ ‡ Dist D Poisson Pdf ‡ Distr (Distribution) Menu 138 TI-89 / TI-92 Plus / Voyage™ 200 PLT Statistics with List Editor App... -
Page 145: Poisson Cdf
Poisson Cdf Inputs Lower Value Lˆ Upper Value ˆ Outputs LowVal UpVal STATVARS Example E:Poisson Cdf ¦ ‡ Dist ¦ ‡ Dist E ‡ Distr (Distribution) Menu 139 TI-89 / TI-92 Plus / Voyage™ 200 PLT Statistics with List Editor App... -
Page 146: Geometric Pdf
Prob Success, p X Value Outputs X Value STATVARS Example F:Geometric Pdf ¦ ‡ Dist ¦ ‡ Dist F Geometric Pdf ‡ Distr (Distribution) Menu 140 TI-89 / TI-92 Plus / Voyage™ 200 PLT Statistics with List Editor App... -
Page 147: Geometric Cdf
Lower Value Lˆ Upper Value ˆ Outputs LowVal UpVal STATVARS Example G:Geometric Cdf ¦ ‡ Dist ¦ ‡ Dist G Geometric Cdf ‡ Distr (Distribution) Menu 141 TI-89 / TI-92 Plus / Voyage™ 200 PLT Statistics with List Editor App... - Page 148 ‡ Distr (Distribution) Menu 142 TI-89 / TI-92 Plus / Voyage™ 200 PLT Statistics with List Editor App...
-
Page 149: ˆ Tests Menu
LinRegTTest ............................165 MultRegTests ............................. 168 ANOVA..............................171 ANOVA2-Way ............................. 173 F6 Tests Note: All output variables are stored in the folder. STATVARS ˆ Tests Menu 143 TI-89 / TI-92 Plus / Voyage™ 200 PLT Statistics with List Editor App... -
Page 150: Z-Test
Results Calculate: (Calculate or Draw) Draw: Data and Stats Outputs Outputs Stored to Description s ‡ P Value P Value x_bar List Data ˆ Tests Menu 144 TI-89 / TI-92 Plus / Voyage™ 200 PLT Statistics with List Editor App... - Page 151 Choose Input Method Data Input Method Test Data Stats) Z Test Data Stats Alternate Hyp Results Data Stats Input: Calculated results: Drawn results: ˆ Tests Menu 145 TI-89 / TI-92 Plus / Voyage™ 200 PLT Statistics with List Editor App...
-
Page 152: T-Test
(mπ π π π m0, m< < < < m0, m> > > > m0) Results Calculate: (Calculate or Draw) Draw: Data and Stats Outputs Outputs Stored to Description ‡ P Value pval x_bar List ˆ Tests Menu 146 TI-89 / TI-92 Plus / Voyage™ 200 PLT Statistics with List Editor App... - Page 153 Choose Input Method Data Input Method T Test Data Stats) T Test Data Stats Alternate Hyp Results Data Stats Input: Calculated results: Drawn results: ˆ Tests Menu 147 TI-89 / TI-92 Plus / Voyage™ 200 PLT Statistics with List Editor App...
-
Page 154: 2-Sampztest
List 1. List 2. Alternate Hyp π π π π < < < < > > > > Results Calculate: (Calculate or Draw) Draw: ˆ Tests Menu 148 TI-89 / TI-92 Plus / Voyage™ 200 PLT Statistics with List Editor App... - Page 155 ˆ ¦ Tests 3 Choose Input Method Data Input Method 2-Sample Z Test Data Stats) 2-Sample Z Test Data Stats Alternate Hyp Results ˆ Tests Menu 149 TI-89 / TI-92 Plus / Voyage™ 200 PLT Statistics with List Editor App...
- Page 156 2-SampZTest (continued) Example (continued) Data Stats Input: Calculated results: Drawn results: ˆ Tests Menu 150 TI-89 / TI-92 Plus / Voyage™ 200 PLT Statistics with List Editor App...
-
Page 157: 2-Sampttest
Alternate Hyp π π π π < < < < > > > > Pooled (YES, NO) Results Calculate: (Calculate or Draw) Draw: ˆ Tests Menu 151 TI-89 / TI-92 Plus / Voyage™ 200 PLT Statistics with List Editor App... - Page 158 ˆ ¦ Tests 4 Choose Input Method Data Input Method 2-Sample T Test Data Stats) 2-Sample T Test Data Stats Alternate Hyp Results ˆ Tests Menu 152 TI-89 / TI-92 Plus / Voyage™ 200 PLT Statistics with List Editor App...
- Page 159 2-SampTTest (continued) Example (continued) Data Stats Input: Calculated results: Drawn results: ˆ Tests Menu 153 TI-89 / TI-92 Plus / Voyage™ 200 PLT Statistics with List Editor App...
-
Page 160: 1-Propztest
(pπ π π π p0, p< < < < p0, p> > > > p0) Results Calculate: (Calculate or Draw) Draw: Outputs Outputs Stored to Description P Value pval p_hat p_hat ˆ Tests Menu 154 TI-89 / TI-92 Plus / Voyage™ 200 PLT Statistics with List Editor App... - Page 161 (continued) Example 5:1-PropZTest, - ˆ ¦ Tests 5 ˆ ¦ Tests 5 1-Proportion Z Test Alternate Hyp Results Input: Calculated results: Drawn results: ˆ Tests Menu 155 TI-89 / TI-92 Plus / Voyage™ 200 PLT Statistics with List Editor App...
-
Page 162: 2-Propztest
Calculate: (Calculate or Draw) Draw: Outputs Outputs Stored to Description P Value pval p1_hat p1_hat p2_hat p2_hat p_hat p_hat n1, n2 n1, n2 ˆ Tests Menu 156 TI-89 / TI-92 Plus / Voyage™ 200 PLT Statistics with List Editor App... - Page 163 (continued) Example 6:2-PropZTest, - ˆ ¦ Tests 6 ˆ ¦ Tests 6 2-Proportion Z Test Alternate Hyp Results Input: Calculated results: Drawn results: ˆ Tests Menu 157 TI-89 / TI-92 Plus / Voyage™ 200 PLT Statistics with List Editor App...
-
Page 164: Chi2 Gof
* The output variable is pasted to the end of the list editor when Results!Editor option is YES, (located in ƒ (Tools) 9:Format). ˆ Tests Menu 158 TI-89 / TI-92 Plus / Voyage™ 200 PLT Statistics with List Editor App... - Page 165 7:Chi2 GOF, - ˆ ¦ Tests 7 ˆ ¦ Tests 7 Chi-square Goodness of Fit Results Input: Calculated results: Drawn results: ˆ Tests Menu 159 TI-89 / TI-92 Plus / Voyage™ 200 PLT Statistics with List Editor App...
-
Page 166: Chi2 2-Way
Store CompMat to Results Calculate: (Calculate or Draw) Draw: Outputs Outputs Stored to Description Chi-2 chi2 P Value pval Exp Mat expmat Comp Mat compmat ˆ Tests Menu 160 TI-89 / TI-92 Plus / Voyage™ 200 PLT Statistics with List Editor App... - Page 167 Note: You can enter a matrix directly into the Observed Mat input box using matrix notation. Enter [[4,7][9,2][5,3]] into the 0bserved Mat input field. ˆ Tests Menu 161 TI-89 / TI-92 Plus / Voyage™ 200 PLT Statistics with List Editor App...
- Page 168 Chi2 2-way (continued) Example (continued) statvars\expmat Input: statvars\compmat Calculated results: Drawn results: ˆ Tests Menu 162 TI-89 / TI-92 Plus / Voyage™ 200 PLT Statistics with List Editor App...
-
Page 169: 2-Sampftest
Den df dendf Sx1, Sx2 sx1, sx2 List 1 List 2 x1, x2 x1_bar List 1 List 2 x2_bar n1, n2 n1, n2 ˆ Tests Menu 163 TI-89 / TI-92 Plus / Voyage™ 200 PLT Statistics with List Editor App... - Page 170 2-Sample F Test Data Input Method Data Stats) 2-Sample F Test Data Stats Alternate Hyp Results Data Stats Input: Calculated results: Drawn results: ˆ Tests Menu 164 TI-89 / TI-92 Plus / Voyage™ 200 PLT Statistics with List Editor App...
-
Page 171: Linregttest
π π π π 0, < < < < 0, > > > > 0) Store RegEqn to Results Calculate: (Calculate or Draw) Draw: ˆ Tests Menu 165 TI-89 / TI-92 Plus / Voyage™ 200 PLT Statistics with List Editor App... - Page 172 (located in ƒ (Tools) 9:Format). Example list3={38,56,59,64,74} list4={41,63,70,72,84} A:LinRegTTest, - ˆ ¦ Tests ˆ ¦ Tests A Linear Regression T Test Alternate Hyp Store RegEqn to Results ˆ Tests Menu 166 TI-89 / TI-92 Plus / Voyage™ 200 PLT Statistics with List Editor App...
- Page 173 (Chapter 1). However, limiting the number of digits to a small number could affect the accuracy of the fit. ˆ Tests Menu 167 TI-89 / TI-92 Plus / Voyage™ 200 PLT Statistics with List Editor App...
-
Page 174: Multregtests
X1 List, X2 List Outputs Outputs Stored to Description P Value pval Adj R adjrsq REGRESSION Outputs Outputs Stored to Description dfreg ssreg msreg ˆ Tests Menu 168 TI-89 / TI-92 Plus / Voyage™ 200 PLT Statistics with List Editor App... - Page 175 (located in ƒ (Tools) 9:Format). Example list1={12,16,25,22,8,10} list2={11,9,12,9,8,7} list3={1,2,3,4,5,6} B:MultRegTests, - ˆ ¦ Tests ˆ ¦ Tests B Multiple Regression Tests Num of Ind Vars ˆ Tests Menu 169 TI-89 / TI-92 Plus / Voyage™ 200 PLT Statistics with List Editor App...
- Page 176 However, limiting the number of digits to a small number could affect the accuracy of the fit. ˆ Tests Menu 170 TI-89 / TI-92 Plus / Voyage™ 200 PLT Statistics with List Editor App...
-
Page 177: Anova
* The output variables are pasted to the end of the list editor when Results!Editor option is YES, (located in ƒ (Tools) 9:Format). ˆ Tests Menu 171 TI-89 / TI-92 Plus / Voyage™ 200 PLT Statistics with List Editor App... - Page 178 Choose Input Method Data Input Method Data Input Method Data Stats) Number of Groups ¸ Analysis of Variance Data Stats Data Stats Input: Calculated results: ˆ Tests Menu 172 TI-89 / TI-92 Plus / Voyage™ 200 PLT Statistics with List Editor App...
-
Page 179: Anova2-Way
(2...10) Lvls of Row Factor Outputs Block Design Outputs Stored to Description P Value pval BLOCK P Value pvalb ERROR dferr sserr mserr ˆ Tests Menu 173 TI-89 / TI-92 Plus / Voyage™ 200 PLT Statistics with List Editor App... - Page 180 INTERACTION Outputs Outputs Stored to Description fint P Value pvalint dfint ssint msint ERROR Outputs Outputs Stored to Description dferr sserr mserr ˆ Tests Menu 174 TI-89 / TI-92 Plus / Voyage™ 200 PLT Statistics with List Editor App...
- Page 181 Design Block 2 Factor, Eq Reps Lvls of Col Factor 2 - 10 2 Factor, Eq Reps Lvls of Row Factor ¸ ¸ ˆ Tests Menu 175 TI-89 / TI-92 Plus / Voyage™ 200 PLT Statistics with List Editor App...
- Page 182 ANOVA2-Way (continued) Example (continued) Block 2 Factor, Eq Reps Input: Calculated results: ˆ Tests Menu 176 TI-89 / TI-92 Plus / Voyage™ 200 PLT Statistics with List Editor App...
-
Page 183: Ints (Intervals) Menu
( ), if applicable. Calculate Draw The output variables are stored in the folder. STATVARS ‰ Ints (Intervals) Menu 177 TI-89 / TI-92 Plus / Voyage™ 200 PLT Statistics with List Editor App... -
Page 184: Zinterval
List C Level Stats Inputs List C Level Data and Stats Outputs Outputs Stored to Description C Int lower, upper x_bar List ‰ Ints (Intervals) Menu 178 TI-89 / TI-92 Plus / Voyage™ 200 PLT Statistics with List Editor App... - Page 185 Choose Input Method Data Input Method Z Interval Data Input Method Data Stats) Z Interval Data Stats Data Stats Input: Calculated results: ‰ Ints (Intervals) Menu 179 TI-89 / TI-92 Plus / Voyage™ 200 PLT Statistics with List Editor App...
-
Page 186: Tinterval
List (Freq) List C Level Stats Inputs C Level Data and Stats Outputs Outputs Stored to Description C Int lower, upper x_bar ‰ Ints (Intervals) Menu 180 TI-89 / TI-92 Plus / Voyage™ 200 PLT Statistics with List Editor App... - Page 187 Choose Input Method Data Input Method T Interval Data Input Method Data Stats) T Interval Data Stats Data Stats Input: Calculated results: ‰ Ints (Intervals) Menu 181 TI-89 / TI-92 Plus / Voyage™ 200 PLT Statistics with List Editor App...
-
Page 188: 2-Sampzint
Sx1, Sx2 sx1 sx2 List 1 List 2 n1 n2 n1 n2 s1, s2 r1, r2 List 1 List ‰ Ints (Intervals) Menu 182 TI-89 / TI-92 Plus / Voyage™ 200 PLT Statistics with List Editor App... - Page 189 Choose Input Method Data Input Method 2-Sample Z Interval Data Input Method Data Stats) 2-Sample Z Interval Data Stats Data Stats Input: Calculated results: ‰ Ints (Intervals) Menu 183 TI-89 / TI-92 Plus / Voyage™ 200 PLT Statistics with List Editor App...
-
Page 190: 2-Samptint
C Int lower, upper x1-x2 xbardiff x1, x2 x1_bar, x2_bar Sx1 Sx2 sx1 sx2 List 1 List 2 n1, n2 n1 n2 Pooled ‰ Ints (Intervals) Menu 184 TI-89 / TI-92 Plus / Voyage™ 200 PLT Statistics with List Editor App... - Page 191 Choose Input Method Data Input Method 2-Sample T Interval Data Input Method Data Stats) 2-Sample T Interval Data Stats Data Stats Input: Calculated results: ‰ Ints (Intervals) Menu 185 TI-89 / TI-92 Plus / Voyage™ 200 PLT Statistics with List Editor App...
-
Page 192: 1-Propzint
5:1.PropZInt Æ ‰ Ints 5:1.PropZInt 1.PropZInt Inputs Successes, x C Level Outputs Outputs Stored to Description C Int lower, upper p_hat p_hat ‰ Ints (Intervals) Menu 186 TI-89 / TI-92 Plus / Voyage™ 200 PLT Statistics with List Editor App... - Page 193 1-PropZInt (continued) Example 5:1-PropZInt, - ‰ ¦ Ints 5 ‰ ¦ Ints 5 1–Proportion Z Interval Input: Calculated results: ‰ Ints (Intervals) Menu 187 TI-89 / TI-92 Plus / Voyage™ 200 PLT Statistics with List Editor App...
-
Page 194: 2-Propzint
Successes, x1 Successes, x2 optional C Level Outputs Outputs Stored to Description C Int lower, upper phatdiff phatdiff p1_hat p1_hat p2_hat p2_hat ‰ Ints (Intervals) Menu 188 TI-89 / TI-92 Plus / Voyage™ 200 PLT Statistics with List Editor App... - Page 195 2-PropZInt (continued) Example 6:2-PropZInt, - ‰ ¦ Ints 6 ‰ ¦ Ints 6 2–Proportion Z Interval Input: Calculated results: ‰ Ints (Intervals) Menu 189 TI-89 / TI-92 Plus / Voyage™ 200 PLT Statistics with List Editor App...
-
Page 196: Linregtint
* The output variables are pasted to the end of the list editor when Results!Editor option is YES, (located in ƒ (Tools) 9:Format). ‰ Ints (Intervals) Menu 190 TI-89 / TI-92 Plus / Voyage™ 200 PLT Statistics with List Editor App... - Page 197 * The output variables are pasted to the end of the list editor when Results!Editor option is YES, (located in ƒ (Tools) 9:Format) ‰ Ints (Intervals) Menu 191 TI-89 / TI-92 Plus / Voyage™ 200 PLT Statistics with List Editor App...
- Page 198 7:LinRegTInt, - ‰ ¦ Ints 7 ‰ ¦ Ints 7 Linear Regression T Interval Input: Calculated results: LinRegTInt resid STATVARS resid ‰ Ints (Intervals) Menu 192 TI-89 / TI-92 Plus / Voyage™ 200 PLT Statistics with List Editor App...
-
Page 199: Multregint
* The output variables are pasted to the end of the list editor when Results!Editor option is YES, (located in ƒ (Tools) 9:Format). ‰ Ints (Intervals) Menu 193 TI-89 / TI-92 Plus / Voyage™ 200 PLT Statistics with List Editor App... - Page 200 Num of Ind Vars Mult Reg Pt Estimate & Intervals Num of Ind Vars C Level Data Input: Calculated results: MultRegInt resid STATVARS resid ‰ Ints (Intervals) Menu 194 TI-89 / TI-92 Plus / Voyage™ 200 PLT Statistics with List Editor App...
Need help?
Do you have a question about the TI-89 and is the answer not in the manual?
Questions and answers