
Subscribe to Our Youtube Channel
Related Manuals for ECM egrCAN


Summary of Contents for ECM egrCAN
- Page 1 Modular, Multichannel, Exhaust Gas Recirculation (EGR) Ratio and Lambda Measurement System Instruction Manual 10-23-2009...
- Page 2 © COPYRIGHT 2009 by ECM: ENGINE CONTROL AND MONITORING. All Rights Reserved. No part of this manual may be photocopied or reproduced in any form without prior written consent from ECM: ENGINE CONTROL AND MONITORING. Information and specifications subject to change without notice.
-
Page 3: Table Of Contents
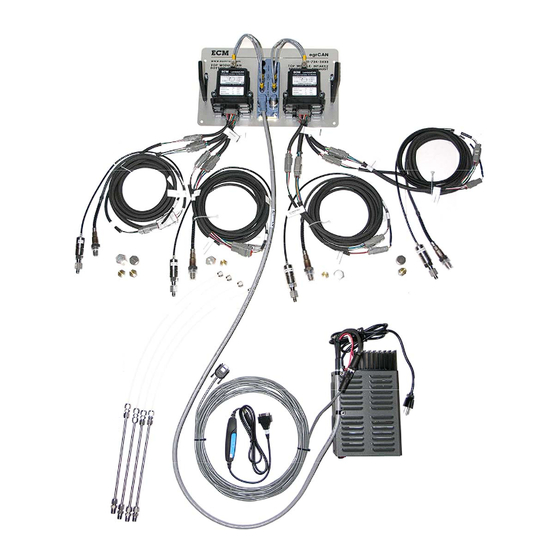
CONF (Configure) Setup Option (LEdS, LOCK) Specifications and Limits Appendices A. egrCAN Kit Contents (Basic System) B. Module Stand-alone Mode and EIB Mode C. Interpreting Data from LambdaCAN and NOxCAN(g) Modules D. Setting up ETAS INCA for ECM Modules E. LOCKing and unLOCKing dashCAN... - Page 4 Safety Warnings Warranty and Disclaimers A two-zone egrCAN system with optional module mounting panel and AC/DC Power Supply. %EGR can be determined at two locations in the engine.
-
Page 5: Introduction
Introduction egrCAN is a modular, multichannel, exhaust gas recirculation (EGR) ratio measurement system. egrCAN is scalar. The basic system (see Figure 1) consists of three modules: one measuring ambient air (the “air module”), one measuring the intake charge (the “intake module”), and one measuring the exhaust of the engine (the “exhaust module”). - Page 6 Figure 1: Basic egrCAN System...
-
Page 7: Setting Up Egrcan (Hardware)
Alternatively, the sensors could be mounted on conditioned-air ducting leading to the intake of the engine. ECM supplies both steel and aluminum mounting bosses for the air module’s O2 sensor and pressure sensor (see Figure 2). However in some cases, user-designed sensor mounting bosses may be more appropriate. - Page 8 Mount the exhaust O2 sensor using the short steel 18 mm boss (P/N 12-02) between 300 mm downstream of exhaust valve and ten exhaust diameters upstream of exhaust exit. Preferentially mount downstream of turbocharger and upstream of exhaust catalyst. egrCAN supports the use of multiple exhaust modules.
-
Page 9: Attaching The Modules To The Bus
Figure 2: Bosses and Plugs Attaching the Modules to the Bus Figure 1 and Appendix A shows a basic (3 module) egrCAN system. egrCAN is a bus-based measurement system. The bus is composed of Eurofast cables (in 2m, 4m, and 10m lengths), Tees, termination resistors, and “flexi-cables”. -
Page 10: Setting Up Egrcan (Software)
PC, all modules should be hooded up to the bus (with proper termination), the bus should be powered, and the CAN adapter should be connected to the bus and the PC. Double click on the ECM icon and the window shown in Figure 3 will appear. - Page 11 There is a limit to the amount of information being passed on the CAN bus. Assuming that nothing but egrCAN modules on the bus, the following formula calculates the minimum programmable broadcast rate (used by all modules) given a total number of TPDOs transmitted (total for all modules) Minimum broadcast rate (ms) = total number of TPDOs for all modules x 0.3125...
- Page 12 (written on sensor cable) for each module TPDOs (“Air” Module): O2, PKPA, RPVS, VH, IP1, TEMP (“Intake” Module): O2, PKPA, RPVS, VH, IP1, VSM (“Exhaust” Module): O2, PKPA, RPVS, VH, IP1, Lambda Table 1: Recommended Task Values and TPDOs for egrCAN Systems...
- Page 13 Change Node ID: Allowable range 0x01 to 0x7F (hex). When you assign a Node ID (NID), the following CAN IDs cannot be used by any other devices on the bus: 0x00, 0x80 + NID, 0x180 + NID, 0x280 + NID, 0x380 + NID, 0x480 + NID, 0x580 NID, 0x600...
- Page 14 16 bit Pressure sensor output voltage (unsigned integer format) ERFL Error bit flags (bits) Module error flags (unsigned long format) ERCd ECM CANOpen Error Code ECM CANOpen Error Code PR10 Praw10 (bits) 10 bit Pressure sensor output voltage (unsigned integer format)
- Page 15 NOx sensor Ip2 pumping current (unsigned integer format) ERFL Error bit flags (bits) Module error flags (unsigned long format) ERCd ECM CANOpen Error Code ECM CANOpen Error Code PR10 Praw10 (bits) 10 bit Pressure sensor output voltage (unsigned integer format)
-
Page 16: Producing A .Dbc File
Producing a .dbc File A .dbc file describes to the device receiving data from one or more LambdaCAN and/or NOxCAN(g) modules what is in the data packages. For each module, the packages will contain data for the parameters selected in the activated TPDOs and an error code. The Configuration Software has a tool called “Generate .dbc…”... - Page 17 CAN recover bus off 0x00B5 CAN Tx CanId collision 0x00B6 Serial overrun 0x00FF Both ON Module powering down within 500ms ECM AUX Sensor Warm-up count down in seconds (active during ECM Error Code 0x0001) Table 5: LambdaCAN and NOxCAN(g) Error Codes List...
-
Page 18: Selecting What Data Is To Be Sent (Tpdos)
Selecting what Data is to be Sent (TPDOs) Data send from LambdaCAN and NOxCAN(g) modules is packaged as TPDOs (Transmit Process Data Object). Each TPDO contains two pieces of data and each module can send up to four TPDOs. All selected TPDOs will be sent at the broadcast rate. For example, if the broadcast rate is 5 ms and four TPDOs were selected to be sent, then eight pieces of data would be transmitted every 5 ms. -
Page 19: Processing Data In Host Data Acquisition System
O2air = Parameter O2 (%O2) output by the “air” module. O2int = Parameter O2 (%O2) output by an “intake” module. An egrCAN system can have multiple intake modules. Thus multiple %EGRs can be reported for different locations (for EGR distribution studies) or stages (for multi-stage EGR systems). -
Page 20: Setting Up Egrcan (Calibration)
How often can only be determined by your experimentation. Alternatively, the sensors can be sent to ECM for recalibration. Calibration information (both factory calibration and user calibration) for the O2 and NOx sensors is stored in a memory chip in the sensor’s connector. Therefore, the sensor does not have to be used with the module it was calibrated with. - Page 21 Delta O2 Table and Delta Lambda Table The %O2 calculated by LambdaCAN and NOxCAN(g) modules is denoted as “O2R” and is a wet (i.e. water taken into consideration in %O2 calculation), at chemical-equilibrium (i.e. not frozen-equilibrium) %O2 measurement (see Appendix C). The Lambda (AFR, FAR, PHI) calculated by the LambdaCAN and NOxCAN(g) modules is denoted as “LAMR”...
-
Page 22: Calibration Of The Ntk Nox Sensor And The Delta Tables (Noxcan Only)
Also, the zero and gain of the NOx measurement is sensitive to changes in the exhaust pipe’s temperature. To reduce this sensitivity, ECM offers a heated NOx sensor mount (the BTU200). With or without the BTU200, for best accuracy the NOx sensor should be calibrated in a mounting pipe and pipe temperature similar to that it will be used The gases the NOx sensor is measuring must contain water. - Page 23 When the NOx sensor is off (i.e. cold) and is stored for a period longer than a few days, the sensor may adsorb water vapor. This results in a NOx measurement error until the water is boiled off the sensor. When the sensor is used in an engine, this will occur quickly. However, if the sensor is held in air or is mounted in a cold pipe with slow moving gases, it may take up to eight hours for the water to boil off.
-
Page 24: Calibration Of The Ngk Nox Sensor And The Delta Tables (Noxcang Only)
6. If the NOx sensor subsequently measures exhaust gases after these gases have passed through a water separator. IMPORTANT NOTE: ECM has found it very difficult to accurately calibrate the NTK NOx sensor using model gases. Calibrate in an engine and in comparison to a NOx CLA if possible. - Page 25 3. “Span O2” the sensor in a manner similar to the Lambda sensor. 4. “Zero NOx” the sensor in a running engine and in comparison to a CLA. The NOx level doesn’t have to be exactly zero for the zero process. For example, if it is 12 ppm, the Configuration Software will allow this.
-
Page 26: Using The Dashcan Display
Using the dashCAN Display The dashCAN display (see below) is a small (105 mm x 63 mm x 63 mm), two-channel remote display for CAN networks containing LambdaCAN and NOxCAN(g) modules. dashCAN comes with a two meter cable and a “T” (P/N 09-05). Simply attach dashCAN to the CAN bus and any two parameters being transmitted from LambdaCAN and NOxCAN(g) modules can be displayed. -
Page 27: Mod (Module) Setup Option
Setup Option Level 1 Function Select module s/n. Default is NONE. RATE Set parameter averaging rate. Range 0.001 to 1.000 Default is 1.000 dISP Select parameter. Note: Parameters available are those programmed using Configuration Software. CONF LEdS Set display intensity. Default is 3333. LOCK Lock and Unlock Display for Programming MOd, RATE, and dISP appear on the upper display for the upper channel and on the lower... -
Page 28: Disp (Display) Setup Option
dISP (Display) Setup Option In dISP setup, the parameters to be displayed are selected. Only parameters selected to be transmitted by the Configuration Software can be displayed. Here is an example of setting the parameter to be displayed on the upper display: 1. -
Page 29: Specifications And Limits
Specifications and Limits Measurements and Accuracies Parameter Range Response Time Accuracy -25 to 25% < 150 ms ±0.2 ±0.005 (at λ=1) Lambda (λ) 0.4 to 25 < 150 ms ±0.008 (0.8<λ<1.2) ±0.009 (elsewhere) 6 to 364 < 150 ms ±0.1 (at 14.6 AFR) ±0.2 (12<AFR<18) ±0.5 (elsewhere) Equivalence Ratio (Φ) - Page 30 gasoline: 1.70 < H:C < 2.10, O:C=0.0, N:C=0.0, (1.75 or 1.85 are commonly used) methanol: H:C=4.0, O:C=1.0, N:C=0.0 ethanol: H:C=3.0, O:C=0.5, N:C=0.0 propane: H:C=2.67, O:C=0.0, N:C=0.0 methane: H:C=4.0, O:C=0.0, N:C=0.0 Maximum allowable levels of fuel "Impurities": Lead: 0.012 gm/gal., 0.003 gm/ltr. Phosphorous: 0.0008 gm/gal., 0.00027 gm/ltr.
- Page 31 Mating Thread with Engine: ¼” NPT (USA) or ¼” ISO tapered (Metric) Tubing Assembled Length: 19” (USA) or 483 mm (Metric) Tubing Diameter: ¼” (USA) or 6mm (Metric) Nut, Front Ferrule, Back Ferrule at Pressure Sensor end of Tubing: Swagelok SS-402-1, SS-403-1, SS-404-1 (USA) or Swagelok SS-6M3-1, SS-6M4-1, SS-6M2-1 (Metric) Union between Stainless Steel and Teflon Tubing: Swagelok SS-400-6 (USA) or Swagelok SS-6MO-6 (Metric)
-
Page 32: Appendices
Appendix A: egrCAN Kit Contents (Basic System) - Page 33 The Basic egrCAN Kit consists of: Description Quantity 1. LambdaCAN Control Module 02-01 2. O2 Sensor 05-05 (LSU4.2, Type P) 3. Pressure Sensor, 0-75 psia, 517 kPa 07-01 (USA) or 07-02 (metric) 4. Pressure Sensor Tubing 12-08 (USA) or 12-11 (metric) 5.
-
Page 34: Module Stand-Alone Mode And Eib Mode
Appendix B: Module Stand-alone Mode and EIB Mode CAN data from LambdaCAN and NOxCAN(g) modules can either be taken directly from the modules themselves or from the CAN port of display heads connected to the modules. When data is taken directly from one or more modules, each module must in Stand-alone mode. When data is taken from one or more display heads of an EGR 5210, Lambda 5220, or EGR 5230 analyzer, each module must be in EIB mode. - Page 35 3. Slide the PCB out. Install a jumper on JP4. Jumper 5. Make sure both O-rings are on the threaded connector. 6. Slide the PCB into the enclosure until the two tangs “click”. 7. Put the nut on and tighten ONLY ½ turn from where it is seated. If this nut is tightened too much, the connector will crack and the enclosure will not be sealed.
- Page 36 P/N 11-02, DC Power Cable, To power Module Serial DB9F, Banana Plugs (shown), Number P/N 11-01, DC Power Cable, “T” To CAN adapter Resistor On PC Figure A1: Module prepared for Reprogramming 9. Start the Configuration Tool (software). Click on the “Module” tab. Select the CAN adapter being used.
- Page 37 10. Click on the “Set to Stand-Alone Mode”. Wait for “Done” Message. Stop communication and exit program. The module is in Stand-alone mode. To convert a module from Stand-alone Mode to EIB Mode 1. Use the Configuration Tool (software) to “Set to EIB Mode”. 2.
-
Page 38: Interpreting Data From Lambdacan And Noxcan(G) Modules
This fact is well documented in the literature. However, some organizations prefer to call their specific (and often unique) Spindt or Brettschneider calculations of Lambda the “true” values. To satisfy such needs, ECM has provided the Delta Lambda Table and Delta O2 Table features. - Page 39 Delta O2 Table. The wet versus dry reporting of NOx is best resolved by how the NOxCAN(g) is zeroed and spanned. If you want wet numbers, calibrate using wet (i.e. water-compensated) CLA data. If you want dry numbers, calibrate using dry CLA data. Equilibrium versus Non-Equilibrium O2 Gases exiting the combustion chamber of an Otto or Diesel cycle engine are not at chemical equilibrium.
- Page 40 Comparing to an ETAS LA4 Meter Many ETAS meters with new sensors will not correctly show the %O2 when the sensor is held in air. The actual %O2 in air depends on the humidity and will be almost always less than 20.945%.
-
Page 41: Setting Up Etas Inca For Ecm Modules
2. Connect the Ethernet port directly to the Ethernet port on your PC. This port does not use an internet/intranet connection like a router. 3. Connect either the CAN1 or CAN2 port to a CAN network (i.e. ECM modules or display heads). - Page 42 5. Configure the hardware. Click on the icon for the workspace you created in step 3. Open the Hardware Configuration icon under the section text “6. Hardware”. A hardware configuration window will open.
- Page 43 6. Select the hardware. In the hardware configuration window, right click the “HWK Workspace” listed under the section text “1. Hardware Devices”, and select Insert. Select the ETAS device you wish to use. In this example, we are using an ETAS ES591.1.
- Page 44 8. Initialize hardware. The hardware is currently stopped, as indicated by the red stop sign icon next to the selected hardware. You must initialize it before you can use it to collect data. Click on the Initialize Hardware button on the upper tool bar and wait for the hardware to complete its initialization.
- Page 45 10. Select and Configure Variables. Select the variables that you wish to monitor in the Experiment Environment. These variables names are based on the data found in the dbc file. Click Configure. 11. Another window will pop up to configure each selected variable. You can configure, for each variable, whether to record or simply display the data, how the data will be displayed (graphs, charts, gauges, numeric, etc.).
- Page 46 13. Start CAN monitoring. Right now there is no data displayed. That is because the CAN monitoring is stopped. To begin CAN monitoring, click on the Start Visualization icon (blue triangle) on the left hand tool bar. To stop CAN monitoring, click the Stop Measuring icon (black square) on the left hand tool bar.
-
Page 47: Locking And Unlocking Dashcan
1. Press SYS until “LOCK” is displayed. Then press ENT. 2. “50” will be displayed. Press ↑ until “60” is displayed. Then press ENT. dashCAN is now unLOCKed. If an unauthorized person learns that 60 is the key number, contact ECM. - Page 48 Operate the engine only in a well ventilated area and never when you or one of your co- workers is tired. When operating the egrCAN in a moving vehicle, the operator should keep his or her eyes on the road.
- Page 49 Warranty and Disclaimers WARRANTY The products described in this manual, with the exception of the O2 and pressure sensors, are warranted to be free from defects in material and workmanship for a period of 365 days from the date of shipment to the buyer. Within the 365 day warranty period, we shall at our option repair such items or reimburse the customer the original price of such items which are returned to us with shipping charges prepaid and which are determined by us to be defective.
- Page 50 586 Weddell Drive, Suite 2 Sunnyvale, CA 94089-2134 AND MONITORING Phone: (408) 734-3433 FAX: (408) 734-3432 Email: sales@ecm-co.com Web: www.ecm-co.com EC DECLARATION OF CONFORMITY We declare under our sole responsibility that the products: AFM1540 Lambda Module AFM1600 Lambda and O Analyzer DIS1000 Display head...
- Page 52 Los Altos, CA 94023-0040 • USA • (408) 734-3433 • Fax: (408) 734-3432 • www.ecm-co.com...
Need help?
Do you have a question about the egrCAN and is the answer not in the manual?
Questions and answers