Table of Contents
Advertisement
Quick Links
Advertisement
Table of Contents

Related Manuals for GSi Protek A333


Summary of Contents for GSi Protek A333
-
Page 2: Table Of Contents
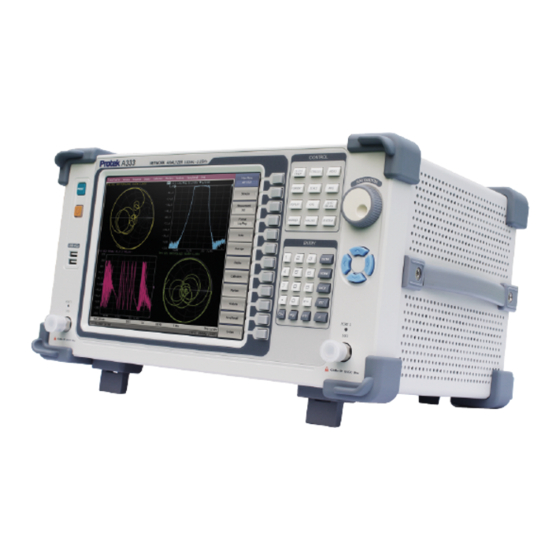
Version 1.0 ▪ June 2008 Network Analyzer A333 CONTENTS INTRODUCTION....................... 4 1. SAFETY INSTRUCTIONS ..................5 2. GENERAL OVERVIEW ....................7 2.1 Description ......................7 2.2 Specifications ......................7 2.3 Options and Accessories..................15 2.4 Principle of Operation ..................15 3. - Page 3 Version 1.0 ▪ June 2008 Network Analyzer A333 5.11 Initial Condition Setting ..................81 5.12 Reference Frequency Oscillator Selection ............81 5.13 User Interface Setting..................82 6. CALIBRATION AND CALIBRATION KIT ............. 86 6.1 Calibration......................86 6.2 Calibration Kit Management................112 7.
-
Page 4: Introduction
Version 1.0 ▪ June 2008 Network Analyzer A333 INTRODUCTION This Operating Manual represents design, specifications, overview of functions, and detailed operation procedure of A333 Network Analyzer, to ensure effective and safe use of the technical capabilities of the instruments by the user. Network Analyzer operation and maintenance should be performed by qualified engineers with initial experience in operating of microwave circuits and PC. -
Page 5: Safety Instructions
Version 1.0 ▪ June 2008 Network Analyzer A333 SAFETY INSTRUCTIONS Carefully read through the following safety instructions before putting the Analyzer into operation. Observe all the precautions and warnings provided in this manual for all the phases of operation, service, and repair of the Analyzer. The Analyzer must be used only by skilled and specialized staff or thoroughly trained personnel with the required skills and knowledge of safety precautions. - Page 6 Version 1.0 ▪ June 2008 Network Analyzer A333 Direct current. On (Supply). Off (Supply). A chassis terminal; a connection to the instrument’s chassis, which includes all exposed metal structure. This sign denotes a hazard. It calls attention to a procedure, WARNING practice, or condition that, if not correctly performed or adhered to, could result in injury or death to personnel.
-
Page 7: General Overview
Version 1.0 ▪ June 2008 Network Analyzer A333 GENERAL OVERVIEW 2.1. Description A333 Network Analyzer has been designed for use in the process of development, adjustment and testing of various electronic devices in industrial and laboratory facilities, including operation as a component of an automated measurement system. A333 is designed for operation with external PC, which is not supplied with the Analyzer. - Page 8 Version 1.0 ▪ June 2008 Network Analyzer A333 Table 1.1 (continued) Magnitude transmission measurement accuracy, if S of the DUT are less than -32 dB, and S and andS S values are as follows: 0.2 dB +5 dB to +15 dB 0.1 dB -50 dB to +5 dB 0.2 dB...
- Page 9 Version 1.0 ▪ June 2008 Network Analyzer A333 Table 1.1 (continued) AC mains power 220 ± 22 V Power consumption 30 W Dimensions LxWxH 275x415x97 mm Weight 5 kg Operating conditions: - Temperature 5 °C to 40 °C - Humidity at 25 °C - Altitude 0 to 2,000m - Error-Corrected Temperature Range...
- Page 10 Version 1.0 ▪ June 2008 Network Analyzer A333 2.2.2. Supplemental Specifications Source stability within operating temperature range ±5×10 –6 Frequency resolution 1 Hz. Measurement time per test point 125 µs. Number of test points per sweep from 2 to 10001. Source to receiver port switchover time less than 10 ms.
- Page 11 Version 1.0 ▪ June 2008 Network Analyzer A333 2.2.3. Measurement Capabilities Measured parameters Number of Up to 16 independent logical channels. A logical measurement channels channel is defined by such stimulus signal settings as frequency range, number of test points, power level, etc.
- Page 12 Version 1.0 ▪ June 2008 Network Analyzer A333 Sweep features Sweep type Linear frequency sweep, logarithmic frequency sweep, and segment frequency sweep, when the stimulus power is a fixed value; and linear power sweep when frequency is a fixed value. Measured points per Set by the user from 2 to 10001.
- Page 13 Version 1.0 ▪ June 2008 Network Analyzer A333 Accuracy enhancement Calibration Calibration of a test setup (which includes the Analyzer, cables, and adapters) significantly increases accuracy measurements. Calibration allows for correction of the errors caused by imperfections in the measurement system: system directivity, source and load match, tracking and isolation.
- Page 14 Version 1.0 ▪ June 2008 Network Analyzer A333 Data analysis Port impedance The function of conversion of the S-parameters conversion measured at 50 port into the values, which could be determined if measured at a test port with arbitrary impedance. De-embedding The function allows to mathematically exclude from the measurement result the effect of the...
-
Page 15: Options And Accessories
Version 1.0 ▪ June 2008 Network Analyzer A333 2.3. Options and Accessories The contents of the delivery package of A333 are represented in table 1.2: Table 1.2 A333 package contents Description Quantity, pcs Analyzer Unit USB Cable Power Cable CD with software and Operating Manual 2.4. - Page 16 Version 1.0 ▪ June 2008 Network Analyzer A333 Figure 1.1 A333 Network Analyzer block diagram...
-
Page 17: Preparation For Use
Version 1.0 ▪ June 2008 Network Analyzer A333 PREPARATION FOR USE 3.1. General Information Unpack the Analyzer and other accessories. Check the contents of the package against the list specified in table 1.2. Connect your A333 to the 220VAC/50Hz power source by means of the Power Cable supplied with the instrument. - Page 18 Version 1.0 ▪ June 2008 Network Analyzer A333 Figure 3.1 A333 front panel 3.2.1 «PRESET» Default Setting Key «PRESET» key restores the initial condition of the Analyzer. The values of the default settings are represented in Appendix 1. 3.2.2 ON/STANDBY Switch ON/STANDBY switch toggles between On and Standby states of the Analyzer.
- Page 19 Version 1.0 ▪ June 2008 Network Analyzer A333 Note Holding the key for more than 4 seconds on an operating Analyzer will turn off the power supply skipping the normal Windows shutdown process. CAUTION Do not disconnect the power cable from the 220 V mains when the Analyzer is operating.
- Page 20 Version 1.0 ▪ June 2008 Network Analyzer A333 3.2.4 Functional Keys Functional keys The functional keys control the functions of the block Analyzer together with the softkeys. The assignment of functional keys is defined by a current softkey panel displayed along the right side of the screen. The top functional key enables you to return to an upper level of the menu.
- Page 21 Version 1.0 ▪ June 2008 Network Analyzer A333 «Meas» key «Meas» key enables the softkey submenu for a measured parameter (S or S ) selection. This submenu is described in section 5.7. «Format» key «Format» key enables the softkey submenu for the measured data display format selection.
- Page 22 Version 1.0 ▪ June 2008 Network Analyzer A333 «System» key «System» key enables the system softkey submenu. This submenu allows to perform initial condition setting, diagram printout, reference frequency (10 MHz) source selection, and carry out performance test of the Analyzer. This submenu is described in sections 5.11, 5.12, 8.3.
- Page 23 Version 1.0 ▪ June 2008 Network Analyzer A333 «BACK» key «BACK» key deletes the character to the left of the cursor. «ESC» key «ESC» key is used for the following: If there is an active data entry field, this key cancels all the data entered in the field and restores the value of the field as it was before any new numbers or characters were entered.
- Page 24 Version 1.0 ▪ June 2008 Network Analyzer A333 «LEFT» and «RIGHT» navigation keys are used for the following: If there is an active numeric data entry field, these keys move the cursor within the field. If the menu bar is active, these keys move the selection to the next/previous item of the menu.
- Page 25 Version 1.0 ▪ June 2008 Network Analyzer A333 3.2.10 Test Ports 1 and 2 with LED Indicators The type-N 50 test ports are intended for DUT connection. A test port can be used either as a source of the stimulus signal or as a receiver of the response signal of the DUT.
-
Page 26: Rear Panel
Version 1.0 ▪ June 2008 Network Analyzer A333 Rear Panel The rear view of A333 is represented in figure 3.2. The rear panel is equipped with the following parts: Power cable receptacle; GPIB connector (optional); Mini-DIN keyboard connector; Mini-DIN mouse connector; Printer parallel port;... - Page 27 Version 1.0 ▪ June 2008 Network Analyzer A333 3.3.1 Power Cable Receptacle Power cable receptacle is intended for 220 V 50 Hz power cable connection. CAUTION In case of emergency, to avoid danger of electric shock or the like, pull the power cable out of the power outlet or the power cable receptacle of the instrument.
- Page 28 Version 1.0 ▪ June 2008 Network Analyzer A333 3.3.6 COM-port 9-pin port of COM interface is a reserved connector. 3.3.7 Ethernet Connector Ethernet connector is intended for Analyzer connection to a LAN (Local Area Network). This connection enables you to control the instrument using an external 3.3.8 External Trigger Signal Input Connector This connector is intended for external trigger source...
-
Page 29: Getting Started
Version 1.0 ▪ June 2008 Network Analyzer A333 GETTING STARTED This section represents a sample session of the Analyzer. It describes the main techniques of measurement of reflection coefficient parameters of the DUT. SWR and reflection coefficient phase of the DUT will be analyzed. For reflection coefficient measurement only one test port of the Analyzer is used. - Page 30 Version 1.0 ▪ June 2008 Network Analyzer A333 Set the scale of the traces; Perform calibration of the Analyzer for reflection coefficient measurement; Analyze SWR and reflection coefficient phase using markers. Note In this section the control over Analyzer is performed by the softkeys located in the right part of the screen.
-
Page 31: Analyzer Preparation For Reflection Measurement
Version 1.0 ▪ June 2008 Network Analyzer A333 4.1. Analyzer Preparation for Reflection Measurement Turn on the Analyzer and warm it up for the period of time stated in the specifications. Ready state features The bottom line of the screen should display: date and time, the Analyzer state, serial number and internal temperature. -
Page 32: Stimulus Signal Setting
Version 1.0 ▪ June 2008 Network Analyzer A333 4.2. Stimulus Signal Setting After you have restored the initial state of the Analyzer, the stimulus parameters will be as follows: frequency range from 300 kHz to 3.2 GHz, sweep type is linear, number of sweep points is 201, and power level is 0 dBm. -
Page 33: Number Of Traces, Measured Parameter And Display Format Setting
Version 1.0 ▪ June 2008 Network Analyzer A333 4.4. Number of Traces, Measured Parameter and Display Format Setting In the current example, two traces are used for simultaneous display of the two parameters (SWR and reflection coefficient phase). To set the number of traces, click «Display» - «Num of Traces», «2». -
Page 34: Trace Scale Setting
Version 1.0 ▪ June 2008 Network Analyzer A333 assign parameter trace, click «Measurement» - «S11» softkeys. Then assign SWR display format to the first trace and reflection coefficient phase display format to the second trace. Before setting the trace parameters, select this trace as active. To set the trace display format, click «Format»... - Page 35 Version 1.0 ▪ June 2008 Network Analyzer A333 4.6. Analyzer Calibration Reflection Coefficient Measurement Calibration of the whole measurement setup, which includes the Analyzer, cables and other devices, supporting connection to the DUT, allows to considerably enhance the accuracy of the measurement. To perform full 1-port calibration, you need to prepare the kit of calibration standards: OPEN, SHORT and LOAD.
- Page 36 Version 1.0 ▪ June 2008 Network Analyzer A333 To select the calibration kit, click «Calibration» - «Cal Kit». Then select the kit being used in the available list. To perform full 1-port calibration, execute measurements of the three standards. After that the table of calibration coefficients will be calculated and saved into the memory of the Analyzer.
-
Page 37: Swr And Reflection Coefficient Phase Analysis Using Markers
Version 1.0 ▪ June 2008 Network Analyzer A333 4.7. SWR and Reflection Coefficient Phase Analysis Using Markers This section describes how to define the measurement values at three frequency points using markers. The Analyzer screen view is shown in figure 4.3. In the current example, a reflection standard of SWR = 1.2 is used as a DUT. - Page 38 Version 1.0 ▪ June 2008 Network Analyzer A333 Repeat three times the procedure described below to enable three markers and assign them stimulus values (frequencies). To enable a new marker, click «Add Marker». Then enter the frequency value in the input field in the graph, e.g.
-
Page 39: Measurement System Setting
Version 1.0 ▪ June 2008 Network Analyzer A333 MEASUREMENT SYSTEM SETTING 5.1. Screen Layout and Functions The screen layout is represented in figure 5.1. The Analyzer screen contains the following elements: Softkey Menu Bar; Menu Bar; Channel Window(s); Instrument Status Bar. In this section you will find detailed description of the softkey menu bar, menu bar, and instrument status bar. - Page 40 Version 1.0 ▪ June 2008 Network Analyzer A333 5.1.1. Softkey Menu Bar The softkey menu bar is the vertical program menu located along the right side of the screen. Note The top line of the screen represents the menu bar, which enables you direct access to the submenus of the softkey menu.
- Page 41 Version 1.0 ▪ June 2008 Network Analyzer A333 softkey with value field allows entering/selection of the numerical settings. This navigation softkey appears when the softkey menu overflows the menu screen area. Using this softkey you can scroll down and up to the hidden parts of the menu. To navigate in the softkey menu, you can also (additionally to «↑», «↓») use «←», «→», «Esc», «Home»...
- Page 42 Version 1.0 ▪ June 2008 Network Analyzer A333 5.1.3. Instrument Status Bar The instrument status bar is located at the bottom of the screen. It contains the following elements: Date and time; DSP processor state; Warning and error messages (if any); Figure 5.3 Instrument status bar DSP processor state: No communication between DSP and computer.
-
Page 43: Channel Window Layout And Functions
Version 1.0 ▪ June 2008 Network Analyzer A333 5.2. Channel Window Layout and Functions The channel windows display the measurement results in the form of diagrams and numerical values. The screen can display up to 16 channel windows simultaneously. Each window corresponds to one logical channel. That is why it is called a channel window. - Page 44 Version 1.0 ▪ June 2008 Network Analyzer A333 5.2.1. Channel Title Bar Figure 5.5 Channel title The channel title feature allows you to enter your comment for each channel window. You can hide the channel title bar to gain the diagram area screen space. Channel title bar You can switch the channel title bar on/off using on/off switching...
- Page 45 Version 1.0 ▪ June 2008 Network Analyzer A333 Table 5.1 Trace status symbols definition Category Symbols Definition Error OPEN response calibration (+ optional directivity RO(+) Correction calibration) RS(+) SHORT response calibration (+ optional directivity calibration) THRU response calibration (+ optional isolation RT(+) calibration) OP(+)
- Page 46 Version 1.0 ▪ June 2008 Network Analyzer A333 5.2.3. Diagram Area The diagram area displays the graphs of the measured parameters. This area can show one or more graphs simultaneously (See figure 5.7). Apart from that the diagram area contains markers, statistics, and other data related to the graph. Figure 5.7 Channel window traces view The vertical graticule label is displayed to the left from the trace area.
- Page 47 Version 1.0 ▪ June 2008 Network Analyzer A333 5.2.3.1. Markers The markers indicate the stimulus values and the measured values in the markers' points. The marker consists of the following elements: – marker data field; – marker stimulus indicator on the stimulus axis; –...
- Page 48 Version 1.0 ▪ June 2008 Network Analyzer A333 IF bandwidth; CW power level / frequency; Averaging Status; Stimulus stop / span. Figure 5.8 Channel status bar 5.2.4.1. Sweep Progress This field shows a progress bar when the channel data are being updated. The bar will become still in case the sweep process is stopped for some reason.
- Page 49 Version 1.0 ▪ June 2008 Network Analyzer A333 5.2.4.3. Stimulus Start/Center This field indicates the start and center of the stimulus span, e.g. «Start 300 kHz» or «Center 1.6 GHz». This stimulus parameter can be specified either for frequency or for power level, depending on the sweep type, e.g.
- Page 50 Version 1.0 ▪ June 2008 Network Analyzer A333 5.2.4.6. IF Bandwidth This field indicates the IF bandwidth, e.g. «100 Hz». The value of IF bandwidth can range from 1 Hz to 30 kHz. Note Using this field you can select the IF bandwidth by the mouse (as described in section 5.3).
-
Page 51: Channel Parameters Setting Using Mouse
Version 1.0 ▪ June 2008 Network Analyzer A333 5.3. Channel Parameters Setting Using Mouse This section describes the mouse manipulations, which will enable you to set the channel parameters fast and easy. In a channel window, over the field where a channel parameter can be modified, the mouse pointer will change its form to indicate the edit mode. - Page 52 Version 1.0 ▪ June 2008 Network Analyzer A333 5.3.4. Display Format Setting To select the trace display format, make a mouse click on the display format field in the trace status line and select the required format in the drop-down menu. 5.3.5.
- Page 53 Version 1.0 ▪ June 2008 Network Analyzer A333 5.3.6. Reference Level Setting The value of the reference level, which is indicated on the vertical scale by «►» and «◄» symbols, can be set by two methods. The first method: make a mouse click on the reference level value field in the trace status line and enter the required numerical value.
- Page 54 Version 1.0 ▪ June 2008 Network Analyzer A333 5.3.9. Sweep Stop Setting Move the mouse pointer over the stimulus numbered scale until it becomes as shown in the figure. Locate the mouse pointer in the right part of the scale, at approximately 10% of the scale length from the right. Press left button of the mouse and holding it drag the pointer to the right to increase the sweep stop value, or to the left to reduce the value.
- Page 55 Version 1.0 ▪ June 2008 Network Analyzer A333 5.3.13. Switching between Start/Center and Stop/Span Modes To switch between the modes Start / Center and Stop / Span, make a mouse click in the respective field of the channel status bar. Label Start will be changed with Center, and label Stop will be changed with Span.
- Page 56 Version 1.0 ▪ June 2008 Network Analyzer A333 5.3.18. IF Bandwidth Setting IF bandwidth can be set by selection in the drop-down menu or by entering the value using numerical keys of the keyboard. To activate the drop-down menu, make a right mouse click on the IF bandwidth field in the channel status bar.
-
Page 57: Channel And Trace Setting
Version 1.0 ▪ June 2008 Network Analyzer A333 5.4. Channel and Trace Setting The Analyzer supports 16 logical channels, which allow measurements with different stimulus parameter settings. The parameters and control elements related to a logical channel are listed in table 5.4. 5.4.1. - Page 58 Version 1.0 ▪ June 2008 Network Analyzer A333 The measurements are executed for open channel windows in succession. Measurements for hidden channel windows are not executed. 5.4.2. Trace Number Setting Each channel window can contain up to 16 different traces. Each trace is assigned the measured parameter (S-parameter), display format and other parameters.
- Page 59 Version 1.0 ▪ June 2008 Network Analyzer A333 If the number of traces is greater than the number of graphs, traces will be assigned successively (beginning from the smallest trace number) to the available graphs. When all the graphs become occupied, the process will continue from the first graph (the following in succession traces will be added in the graphs).
- Page 60 Version 1.0 ▪ June 2008 Network Analyzer A333 Table 5.4 Channel parameters and control elements Parameter or Control Element Description Sweep Type Sweep Range Number of Sweep Points Stimulus Power Level Power Slope Feature CW Frequency Segment Sweep Table Trigger Mode IF Bandwidth Averaging Calibration...
- Page 61 Version 1.0 ▪ June 2008 Network Analyzer A333 The border area of the active channel window is highlighted in light color. The active trace belongs to the active channel and its title is highlighted in inverse color. Before you set a channel or trace parameters you need to assign the active channel or trace respectively.
-
Page 62: Stimulus Setting
Version 1.0 ▪ June 2008 Network Analyzer A333 5.5. Stimulus Setting The stimulus parameters can be set in «Stimulus» submenu of the softkey menu. To enter this submenu, click «Stimulus» softkey in the main menu. Note To make the measurement more accurate, perform calibration with the same stimulus settings as for the measurement. - Page 63 Version 1.0 ▪ June 2008 Network Analyzer A333 To enter the start and stop values of the range, click «Start» and «Stop» softkeys. To enter center and span values of the range, click «Center» and «Span» softkeys. Note If the power sweep is activated, the values on the «Start», «Stop», «Center», and «Span»...
- Page 64 Version 1.0 ▪ June 2008 Network Analyzer A333 To enter the power level value, use «Power» softkey. 5.5.5. Power Slope Feature The power slope feature allows for compensation of power attenuation with the frequency increase, in the fixture wire. The power slope can be set for linear, logarithmic and segment frequency sweeps.
- Page 65 Version 1.0 ▪ June 2008 Network Analyzer A333 The segment table layout is shown below. The table has three mandatory columns: frequency range and number of sweep points, and three columns, which you can enable/disable: IF bandwidth, power level and delay time. Each row describes one segment.
- Page 66 Version 1.0 ▪ June 2008 Network Analyzer A333 To enable the IF bandwidth column, click «List IFBW» softkey. To enable the power level column, click «List Power» softkey. To enable the delay time column, click «List Delay» softkey. To set a parameter, make a mouse click on its value field and enter the value. To navigate in the table you can use the keys of the keyboard.
-
Page 67: Trigger Setting
Version 1.0 ▪ June 2008 Network Analyzer A333 5.6. Trigger Setting Each channel can operate in one of the three trigger modes. A trigger mode defines the sweep actuation of the channel at a trigger signal detection. The trigger modes are as follows: Continuous –... -
Page 68: Measured Data Setting
Version 1.0 ▪ June 2008 Network Analyzer A333 5.7. Measured Data Setting 5.7.1. S-Parameter Definition For high-frequency network analysis the following terms are applied: incident, reflected and transmitted waves, transferred in the circuits of the setup (See figure 5.9). Figure 5.9 Measurement of magnitude and phase of incident, reflected and transmitted signals allow to determine the S-parameters (scattered parameters) of the DUT. - Page 69 Version 1.0 ▪ June 2008 Network Analyzer A333 5.7.2. S-Parameters Setting A measured parameter (S ) can be set for each trace of the channel. Before you select the measured parameter, assign the active trace. To set the measured parameter, click «Measurement» softkey.
-
Page 70: Data Format Setting
Version 1.0 ▪ June 2008 Network Analyzer A333 5.8. Data Format Setting A333 offers the display of the measured S-parameters on the screen in three diagrams: rectangular diagram; polar diagram; Smith chart diagram. 5.8.1. Rectangular Diagram Formats In this diagram stimulus values are plotted along X-axis and the measured data are plotted along Y-axis (See figure 5.10). - Page 71 Version 1.0 ▪ June 2008 Network Analyzer A333 Table 5.6 Rectangular diagram formats Diagram Type Label Data Type (Y-axis) Measurement Description Unit (Y-axis) Logarithmic Log Mag S-parameter logarithmic Decibel (dB) Magnitude magnitude: 20 ⋅ Voltage Standing Abstract − Wave Ratio number S-parameter phase from –180 °...
- Page 72 Version 1.0 ▪ June 2008 Network Analyzer A333 5.8.2. Polar Diagram Formats Polar diagram represents the measurement results on the pie chart (See figure 5.11). The distance of a measured point from the diagram center corresponds to the magnitude of its value. The counterclockwise angle from the positive horizontal axis corresponds to the phase of the measured value.
- Page 73 Version 1.0 ▪ June 2008 Network Analyzer A333 5.8.3. Smith Chart Diagram Formats Smith chart diagram is used for representation of impedance values for DUT reflection measurements. In this diagram the trace has the same points as in polar diagram. Figure 5.12 Smith chart diagram The polar diagram does not have a frequency axis, so frequency will be indicated by the markers.
- Page 74 Version 1.0 ▪ June 2008 Network Analyzer A333 Complex Smith Resistance at input: Impedance (R + jX) Ohm ( ) (at Input) − Reactance at input: Ohm ( ) Equivalent capacitance or inductance: C=− , X<0 Farad (F) ωX , X>0 Henry (H) ω...
- Page 75 Version 1.0 ▪ June 2008 Network Analyzer A333 5.8.4. Diagram Format Setting You can select the diagram format for each graph of the channel. Before you set the format, assign the active graph. To set the diagram format, use «Format» softkey in the main menu.
-
Page 76: Diagram Scale Setting
Version 1.0 ▪ June 2008 Network Analyzer A333 5.9. Diagram Scale Setting You can set the diagram scale in «Scale» submenu. To access this submenu, select «Scale» softkey in the main menu. 5.9.1. Rectangular Scale For rectangular diagram you can set the following parameters (See figure 5.13): Scale division;... - Page 77 Version 1.0 ▪ June 2008 Network Analyzer A333 5.9.2. Rectangular Scale Setting You can set the scale for each graph of the channel. Before you set the scale, assign the active graph. To set the scale of a diagram, use «Scale» softkey. To set the reference level, use «Ref Value»...
- Page 78 Version 1.0 ▪ June 2008 Network Analyzer A333 5.9.4. Polar Scale Setting To set the scale of the polar diagram, use «Scale» softkey. 5.9.5. Automatic Scaling The automatic scaling function automatically defines the scale division in rectangular coordinates. In polar coordinates this function defines the scale. After this function has been executed the trace will become fit into the graph area for best display.
- Page 79 Version 1.0 ▪ June 2008 Network Analyzer A333 If the electrical delay setting is other than zero, S-parameter value will vary in accordance with the following formula: π ⋅ ⋅ ⋅ ⋅ where f – frequency, Hz, t – electrical delay, sec. The electrical delay is set for each trace individually.
-
Page 80: 5.10. If Bandwidth, Averaging And Smoothing Setting
Version 1.0 ▪ June 2008 Network Analyzer A333 5.10. IF Bandwidth, Averaging and Smoothing Setting You can set IF bandwidth, averaging and smoothing parameters in «Average» softkey submenu. To access these functions, select «Average» softkey in the main menu. 5.10.1. IF Bandwidth Setting The IF bandwidth parameter defines the bandwidth of the test receiver. - Page 81 Version 1.0 ▪ June 2008 Network Analyzer A333 − ⋅ > − – i-sweep averaging result; – i-sweep measurement parameter (S-parameter) value; – averaging factor is set by the user from 1 to 999; the higher the factor value the stronger the averaging effect.
-
Page 82: 5.11. Initial Condition Setting
Version 1.0 ▪ June 2008 Network Analyzer A333 turn smoothing function on/off, «Smoothing» softkey. To set the smoothing aperture, use «Smo Aperture» softkey. 5.11. Initial Condition Setting Initial condition setting feature allows you to restore the default settings of the Analyzer. -
Page 83: 5.13. User Interface Setting
Version 1.0 ▪ June 2008 Network Analyzer A333 5.13. User Interface Setting The Analyzer allows you make to the following user interface settings: Switch between full screen and window display Set color of: Data traces Memory traces Background and grid of graph Background and font of menu bar Style and width of: Data traces... - Page 84 Version 1.0 ▪ June 2008 Network Analyzer A333 To access the user interface menu, click “Display” – “Properties”. To switch between full screen and window display, use “Full Screen” softkey. To change the color of the lines of data and memory traces in an active graph, click “Data Trace”...
- Page 85 Version 1.0 ▪ June 2008 Network Analyzer A333 To change the style and width of a memory trace, click “Mem Trace Style” or “Mem Trace Width” softkeys. Then select the style and enter the width of the memory trace. These changes will be automatically made for all the graphs.
- Page 86 Version 1.0 ▪ June 2008 Network Analyzer A333 To set the graticule label mode (Y axis), use “Graticule” softkey. Then select one of the available options: on for active trace on for all the traces To restore the default factory settings, use “Set Defaults”...
-
Page 87: Calibration And Calibration Kit
Version 1.0 ▪ June 2008 Network Analyzer A333 CALIBRATION AND CALIBRATION KIT 6.1. Calibration S-parameter measurements are influenced by various measurement errors, which can be broken down into two categories: systematic errors, and random errors. Random errors comprise such errors as noise fluctuations and thermal drift in electronic components, changes in the mechanical dimensions of cables and connectors subject to temperature drift, repeatability of connections and cable bends. - Page 88 Version 1.0 ▪ June 2008 Network Analyzer A333 Figure 6.1 represents two cases of test port defining for 2-port measurement. The use of cables and/or adapters does not affect the measurement results if they were connected in the process of calibration. Figure 6.1 Test port defining 6.1.2.
- Page 89 Version 1.0 ▪ June 2008 Network Analyzer A333 the incident signal energy comes to the receiver of the reflected signal. Directivity errors do not depend on the characteristics of the DUT and usually have stronger effect in reflection measurements. 6.1.2.2. Source Match Error A source match error (Es) is caused by the mismatch between the source port and the input of the DUT.
- Page 90 Version 1.0 ▪ June 2008 Network Analyzer A333 6.1.2.6. Transmission Tracking Error A transmission tracking error (Et) is caused by the difference in frequency response between the test receiver of the receiver port and the reference receiver of the source port in transmission measurement.
- Page 91 Version 1.0 ▪ June 2008 Network Analyzer A333 6.1.2.8. Two-Port Error Model For a two-port measurement, two signal flow graphs are considered. One of the graphs describes the case where port 1 is the stimulus source, the other graph describes the case where port 2 is the stimulus source. The signal flow graphs of errors effect in a two-port system are represented in figure 6.3: Figure 6.3 Two-port error model...
- Page 92 Version 1.0 ▪ June 2008 Network Analyzer A333 Table 6.1 Systematic errors Description Stimulus Source Port 1 Port 2 Directivity Source match Reflection tracking Transmission tracking Load match Isolation After determination of all the twelve errors for each measurement frequency by means of a 2-port calibration , it is possible to calculate the true value of the S-parameters: 11a, 21a,...
- Page 93 Version 1.0 ▪ June 2008 Network Analyzer A333 The Analyzer compares the measured parameters of the standards against their predefined values. The difference is used for calculation of the calibration coefficients (systematic errors); The table of calibration coefficients is saved into the memory of the Analyzer and used for error correction of the measured results of any DUT.
- Page 94 Version 1.0 ▪ June 2008 Network Analyzer A333 6.1.4. Calibration Methods The Analyzer supports several methods of one-port and two-port calibrations. The calibration methods vary by quantity and type of the standards being used, by type of error correction, and accuracy. The table below represents the overview of the calibration methods.
- Page 95 Version 1.0 ▪ June 2008 Network Analyzer A333 2-port (transmission) S-parameters (S ) are calibrated by means of a THRU standard, estimating transmission tracking error Et. This method is called normalization because the measured S-parameter at each frequency point is divided (normalized) by the corresponding S-parameter of the calibration standard.
- Page 96 Version 1.0 ▪ June 2008 Network Analyzer A333 6.1.8. Full One-Port Calibration Full one-port calibration involves connection of the following three standards to one test port: SHORT, OPEN, LOAD. Measurement of the three standards allows for acquisition of all the errors (Ed, Es, and Er) of a one-port model.
- Page 97 Version 1.0 ▪ June 2008 Network Analyzer A333 6.1.11. Calibration Standards and Calibration Kits Calibration standards are precision physical devices used for determination of errors in a measurement system. A calibration kit is a set of calibration standards with a specific connector type, and specific impedance.
- Page 98 Version 1.0 ▪ June 2008 Network Analyzer A333 8850Q Maury 8850Q03 50 Type-N calibration kit, up to 18 7 – 11 Empty Templates for user-defined calibration kits To achieve the specified measurement accuracy, use a calibration kit with known characteristics. Before starting calibration select in the program the calibration kit being used among the predefined kits, or define a new one and enter its parameters.
- Page 99 Version 1.0 ▪ June 2008 Network Analyzer A333 Table 6.4 Calibration standard model parameters Parameter Parameter definition of reflection and transmission models (as in the program) The transmission line impedance between the calibration plane and the standard to be defined. Generally it is set to the (Offset Z0) characteristic impedance of the system.
- Page 100 Version 1.0 ▪ June 2008 Network Analyzer A333 6.1.14. Calibration Kit Selection A currently selected calibration kit is indicated on «Cal Kit» softkey and on the top softkey of each calibration method submenu. To select a calibration kit, click «Calibration» - «Cal Kit».
- Page 101 Version 1.0 ▪ June 2008 Network Analyzer A333 To open reflection normalization submenu, use «Response (Short)» or «Response (Open)» softkey. Select the test port to be calibrated using «Select Port». Clicking this softkey you can switch between the test ports (measured parameters). Note The top softkey of the calibration submenu indicates the calibration method short title and the selected...
- Page 102 Version 1.0 ▪ June 2008 Network Analyzer A333 To complete the calibration procedure, click «Apply». This will activate the process of calibration coefficient table calculation and saving it into the memory. The error correction function will also be automatically enabled. To clear the measurement results of the standards, click «Cancel».
- Page 103 Version 1.0 ▪ June 2008 Network Analyzer A333 To open transmission normalization submenu, use «Response (Thru)» softkey. Select the direction of the calibration using «Select Ports» softkey. The label on the softkey indicates the following: receiver port - source port (measured parameter).
- Page 104 Version 1.0 ▪ June 2008 Network Analyzer A333 To clear the measurement results of the standard,s click «Cancel». This softkey does not cancel the current calibration. To disable the current calibration, turn off the error correction function. Note You can check the calibration status in channel status bar (See table 6.5) or in trace status field (See table 6.6).
- Page 105 Version 1.0 ▪ June 2008 Network Analyzer A333 Select the test port to be calibrated using «Select Port». Clicking this softkey you can switch between the test ports (measured parameters). Note The top softkey of the calibration submenu indicates the calibration method short title and the selected calibration kit.
- Page 106 Version 1.0 ▪ June 2008 Network Analyzer A333 Note You can check the calibration status in channel status bar (See table 6.5) or in trace status field (See table 6.6). 6.1.18. One-Path Two-Port Calibration One-path two-port calibration is used for measurements of the DUT parameters in one direction, e.g.
- Page 107 Version 1.0 ▪ June 2008 Network Analyzer A333 To open one-path two-port calibration submenu, use «One Path 2-Port Cal» softkey. Select the direction of the calibration using «Select Ports» softkey. The label on the softkey indicates the following: receiver port - source port (measured parameters).
- Page 108 Version 1.0 ▪ June 2008 Network Analyzer A333 To perform the optional isolation calibration, connect two LOAD standards to the test ports as shown in figure 6.9 and enable measurement using «Isolation (Optional)» softkey. The instrument status bar will indicate «Calibration in progress...»...
- Page 109 Version 1.0 ▪ June 2008 Network Analyzer A333 6.1.19. Full Two-Port Calibration Full two-port calibration is the most accurate method of calibration for two-port measurements. Full two-port calibration combines two one-port calibrations for each test port with measurement of transmission and reflection of a THRU standard in both directions (See figure 6.10).
- Page 110 Version 1.0 ▪ June 2008 Network Analyzer A333 To open full two-port calibration submenu, use «Full 2-Port Cal» softkey. Note The top softkey of the calibration submenu indicates the calibration method short title and the selected calibration kit. Connect SHORT, OPEN and LOAD standards to the 1 and 2 ports in any consequence, as shown in figure 6.10.
- Page 111 Version 1.0 ▪ June 2008 Network Analyzer A333 To perform the optional isolation calibration, connect two LOAD standards to the test ports as shown in figure 6.10 and enable measurement using «Port 1-2 Isol (Optional)» softkey. The instrument status bar will indicate «Calibration in progress...»...
- Page 112 Version 1.0 ▪ June 2008 Network Analyzer A333 6.1.21. Error Correction Status Error correction status for a whole channel is indicated in the channel status bar (See table 6.5). Table 6.5 Channel error correction status Symbols Definition Error correction is enabled for all the traces of the channel. The stimulus values are same for calibration and the measurement.
-
Page 113: Calibration Kit Management
Version 1.0 ▪ June 2008 Network Analyzer A333 6.2. Calibration Kit Management This section describes how to edit a predefined calibration kit, add a user-defined calibration kit, and delete a calibration kit. The Analyzer provides memory space for eleven calibration kits. The first five items are the predefined kits (See table 6.3). - Page 114 Version 1.0 ▪ June 2008 Network Analyzer A333 6.2.2. Calibration Kit Editing To open the calibration kit editing submenu, use «Edit Cal Kit» softkey. 6.2.3. Port Assignment of Standards A calibration kit can include up to eleven calibration standards. The quantity of the standards of the same type is not limited (standard types are SHORT, OPEN, LOAD, and THRU).
- Page 115 Version 1.0 ▪ June 2008 Network Analyzer A333 To assign port to a standard, first click the softkey with this standard name. Then click «Connection» softkey and select one of the four assignment options in the submenu. 6.2.4. User-Defined Calibration Kit Adding The empty templates (items 7 to 11) are provided for adding of user-defined calibration kits.
- Page 116 Version 1.0 ▪ June 2008 Network Analyzer A333 6.2.6. Standard Adding to a Calibration Kit To add a calibration standard, use «Add STD» softkey. 6.2.7. Standard Deleting from a Calibration Kit To delete a calibration standard from the calibration kit, click the softkey with the label of the corresponding standard.
- Page 117 Version 1.0 ▪ June 2008 Network Analyzer A333 For an OPEN standard the values of fringe capacitance of an OPEN model should be defined. The fringe capacitance model is described as a function of frequency, which is a polynomial of the third degree: C = C f + C , where...
-
Page 118: Measurement Data Processing Functions
Version 1.0 ▪ June 2008 Network Analyzer A333 MEASUREMENT DATA PROCESSING FUNCTIONS 7.1. Markers A marker is a tool for selection of a point on the trace and for numerical readout of the stimulus value and value of the measured parameter in the corresponding point. The Analyzer features enabling of up to 16 markers on each trace. - Page 119 Version 1.0 ▪ June 2008 Network Analyzer A333 symbol of the active marker on the stimulus axis, ▲ ∆ symbol of the inactive marker on the stimulus axis. The marker data field contains the marker number, stimulus value, and the measured parameter value.
- Page 120 Version 1.0 ▪ June 2008 Network Analyzer A333 Note The new marker appears as an active marker and indicates the stimulus start. 7.1.2. Marker Deleting To delete a marker, click «Delete Marker» softkey. Or click «Delete All Markers» softkey. 7.1.3. Marker Stimulus Value Setting Before you set the marker stimulus value, you need to select the active marker.
- Page 121 Version 1.0 ▪ June 2008 Network Analyzer A333 7.1.5. Reference Marker Feature Reference marker feature allows for execution of relative measurements. When this feature is enabled, the reference marker will appear on the screen (See figure 7.2). Figure 7.2 Instead of the number, R symbol is used for indication of the reference marker. Reference marker can be indicated on the trace as follows: symbol of the active reference marker on the trace;...
- Page 122 Version 1.0 ▪ June 2008 Network Analyzer A333 7.1.6. Marker Coupling Feature The marker coupling feature activates / deactivates independence of the markers for each trace of the channel. If the feature is turned on, the coupled markers (markers with same numbers) will move along X-axis synchronously on all the traces. If the coupling feature is off, the position of the markers with same numbers along X-axis will be independent (See figure 7.3).
- Page 123 Version 1.0 ▪ June 2008 Network Analyzer A333 Figure 7.4 Marker table To show / hide the marker table, use «Marker Properties» - «Marker Table» softkey. 7.1.8. Marker Value Indication Capacity You can customize the accuracy of marker value display. ©...
- Page 124 Version 1.0 ▪ June 2008 Network Analyzer A333 To set the marker value indication capacity, use «Marker Properties» - «Stimulus Digits» or «Response Digits» softkeys. Then enter the number of decimal digits for stimulus or measured value indication respectively. 7.1.9. Marker Position Search Function For trace analysis you can use the marker position search function, which will enable you to locate the position of the markers meeting the specified conditions:...
- Page 125 Version 1.0 ▪ June 2008 Network Analyzer A333 7.1.9.1. Search for Maximum and Minimum Maximum and minimum search functions enable you to determine the maximum and minimum values of the measured parameter and move the marker to these positions on the trace (See figure 7.5). Figure 7.5 Maximum and minimum search Note In Smith chart and polar diagrams the maximum or...
- Page 126 Version 1.0 ▪ June 2008 Network Analyzer A333 Peak is a local extremum of the trace. Peak is called positive if the value in the peak is greater than the values of the adjacent points. Peak is called negative if the value in the peak is smaller than the values of the adjacent points.
- Page 127 Version 1.0 ▪ June 2008 Network Analyzer A333 Note In Smith chart or polar diagrams the peak search is executed for the first out of the three values of the marker. Before you start the peak search, select the active marker, assign the peak polarity and deviation value.
- Page 128 Version 1.0 ▪ June 2008 Network Analyzer A333 transition type is negative if the function's derivative (trace slope) is negative at the intersection point with the target level. Figure 7.7 Target level search The target level search is executed only for the intersection points, which have the specific transition polarity selected by the user (positive, negative, or both).
- Page 129 Version 1.0 ▪ June 2008 Network Analyzer A333 To activate the nearest target search, use «Search Target» softkey. To activate the left target search, use «Search Target Left» softkey. To activate the right target search, use «Search Target Right» softkey. Note The large dot on a softkey indicates the active search function when tracking is enabled.
- Page 130 Version 1.0 ▪ June 2008 Network Analyzer A333 Parameter Symbol Definition Formula Description Bandwidth The difference between the higher and lower F2 – F1 cutoff frequencies Center cent The midpoint between the higher and lower (F1+F2)/2 Frequency cutoff frequencies Lower Cutoff The lower frequency point of the bandwidth Frequency cutoff level and the trace intersection...
- Page 131 Version 1.0 ▪ June 2008 Network Analyzer A333 7.1.11. Trace Statistics The trace statistics feature allows for the data analysis of the trace (See figure 7.9). Figure 7.9 Trace statistics The trace represents the measured data (X i ) array, where i = 1…N, N – number of points.
- Page 132 Version 1.0 ▪ June 2008 Network Analyzer A333 7.1.12. Parameter Setting Using Markers Using the current position of a marker you can perform settings of the following parameters: Stimulus start; Stimulus stop; Stimulus center; Reference level; Electrical delay. Before making the settings, assign the active marker. To set the stimulus start, use «Marker–>Start»...
-
Page 133: Fixture Simulation
Version 1.0 ▪ June 2008 Network Analyzer A333 7.2. Fixture Simulation The fixture simulation function enables you to emulate the measurement conditions other than those of the real setup. The following conditions can be simulated: Port Z conversion; De-embedding; Embedding; Before starting the fixture simulation, assign the active channel. - Page 134 Version 1.0 ▪ June 2008 Network Analyzer A333 Figure 7.10 Port Z conversion To enable the Port impedance conversion function, use «Port Z Conversion» softkey. The label on the softkey indicates the status of the function — On/Off. Then enter the value of the simulated impedance of Port 1 using «Port 1 Z0»...
- Page 135 Version 1.0 ▪ June 2008 Network Analyzer A333 The circuit being removed should be defined in the data file containing S-parameters of this circuit. The circuit should be described as a 2-port in Touchstone file (extension .s2p), which contains the S-parameter table: S for a number of frequencies.
- Page 136 Version 1.0 ▪ June 2008 Network Analyzer A333 enable de-embedding function, «De- embedding» softkey. The label on the softkey indicates the status of the function. «On» label means that the de-embedding function is enabled at least for one of the test ports. To enter the file name of the de-embedded circuit S- parameters of Port 1, use «S-parameters File»...
- Page 137 Version 1.0 ▪ June 2008 Network Analyzer A333 Figure 7.12 Embedding To enable embedding function, use «Embedding» softkey. The label on the softkey indicates the status of the function. «On» label means that the embedding function is enabled at least for one of the test ports. To enter the file name of the embedded circuit S- parameters of Port 1, use «User File»...
-
Page 138: Time Domain Transformation
Version 1.0 ▪ June 2008 Network Analyzer A333 To enter the file name of the embedded circuit S- parameters of Port 2, use «User File» softkey. After you have specified the file, you can enable the function for Port 2 using «Port 2» softkey. If the file is not specified this softkey is inactive. - Page 139 Version 1.0 ▪ June 2008 Network Analyzer A333 The time domain transformation function offers selection of frequency domain window types. The window function allows to reduce the ringing (side lobes) in the time domain. The ringing is caused by the abrupt change of the data at the limits of the frequency domain.
- Page 140 Version 1.0 ▪ June 2008 Network Analyzer A333 7.3.1. Time Domain Transformation Enabling/Disabling To enable or disable time domain transformation function, use «Time Domain» softkey. The label on the softkey indicates the status of the function. Note Time domain transformation function is accessible only in linear frequency sweep mode.
- Page 141 Version 1.0 ▪ June 2008 Network Analyzer A333 7.3.4. Window Layout Setting To set the window layout, click «Window». Then select the required type in the submenu: Minimum; Normal; Maximum. To set the window layout for the specific impulse width or front edge width, use «Impulse Width» softkey.
-
Page 142: S-Parameter Conversion
Version 1.0 ▪ June 2008 Network Analyzer A333 7.4. S-Parameter Conversion S-parameter conversion function allows conversion of the measurement results (S to the following parameters: Equivalent impedance (Zr) and equivalent admittance (Yr) in reflection measurement: ⋅ − Equivalent impedance (Zt) and equivalent admittance (Yr) in transmission measurement: ⋅... -
Page 143: Limit Test
Version 1.0 ▪ June 2008 Network Analyzer A333 To set the type of conversion, click «Function» softkey and select the required type in the submenu: Z: reflection; Z: transmission; Y: reflection; Y: transmission; 1/S: inverse. Note The trace status field will indicate the conversion type, if enabled. - Page 144 Version 1.0 ▪ June 2008 Network Analyzer A333 If the limit test function is enabled, the [Lim] label will be indicated in the trace status field. If the measurement result passed the judgment the label will remain unchanged. If the measurement result failed the judgment the Analyzer will indicate it in the following ways (See figure 7.14): «Fail»...
- Page 145 Version 1.0 ▪ June 2008 Network Analyzer A333 In the editing mode the limit table will appear in the lower part of the screen (See figure 7.15). The limit table will be hidden when you quit the submenu. Figure 7.15 Limit line table To add a new row in the table, click «Add».
-
Page 146: Memory Trace Function
Version 1.0 ▪ June 2008 Network Analyzer A333 Begin Response Response value in the beginning point of the segment. End Response Response value in the ending point of the segment. 7.5.2. Limit Test Enabling/Disabling To enable/disable limit test function, use «Limit Test» softkey. - Page 147 Version 1.0 ▪ June 2008 Network Analyzer A333 OFF – both traces are not displayed . When only data trace is displayed on the screen, the trace status field shows no specific indication. The memory trace bears the following features of the data trace (which if changed, will clear the memory): frequency range, number of points,...
- Page 148 Version 1.0 ▪ June 2008 Network Analyzer A333 Data – Memory Subtracts a memory trace from the measured data. The trace status field indicates: D – M . Adds the measured data and the data in the memory Data + Memory trace.
- Page 149 Version 1.0 ▪ June 2008 Network Analyzer A333 7.6.3. Mathematical Operations To access math operations, click «Data Math» softkey. Then select the required operation from the submenu: Data / Mem; Data * Mem; Data – Mem; Data + Mem; © 2007, 2008 GS Instruments, Co., Ltd.
-
Page 150: Analyzer Data Output
Version 1.0 ▪ June 2008 Network Analyzer A333 ANALYZER DATA OUTPUT 8.1. Analyzer State Saving and Recalling The Analyzer state, calibration and measured data can be saved on the hard disk drive into an Analyzer state file and then can be uploaded back into the Analyzer program. The following four types of saving are available: The Analyzer settings. - Page 151 Version 1.0 ▪ June 2008 Network Analyzer A333 To save and recall a state file, you can use ten softkeys labeled State01, ... State10 . Each of the softkeys correspond to a *.sta file having the same name. To have the Analyzer state automatically recalled after each start of the instrument use Autorecall.sta file.
-
Page 152: Data File Saving
Version 1.0 ▪ June 2008 Network Analyzer A333 To save a state into the file with an arbitrary name use «File...» softkey. 8.1.2. Analyzer State Recalling To recall the state from a file of Analyzer state, use «Recall State» softkey. Click required softkey... - Page 153 Version 1.0 ▪ June 2008 Network Analyzer A333 The format of a Touchstone file for 2-port measurement is shown below: # Hz S FMT R Z0 F[0] }’ {S }” {S }’ {S }” {S }’ {S }” {S }’ {S }”...
- Page 154 Version 1.0 ▪ June 2008 Network Analyzer A333 Magnitude-Angle – linear magnitude / phase dB-Angle – logarithmic magnitude / phase Click «Save File...» softkey to open «Save as» dialog box. © 2007, 2008 GS Instruments, Co., Ltd.
-
Page 155: Diagram Printout
Version 1.0 ▪ June 2008 Network Analyzer A333 8.3. Diagram Printout This section describes the print/save procedures for the graphic data. The print function is provided with the preview feature, which allows the user to view the image to be printed on the screen, and/or save it into a file. You can print out the diagrams using three different applications: MS Word;... - Page 156 Version 1.0 ▪ June 2008 Network Analyzer A333 Select the print color using «Print Color» softkey: Color Gray Scale Black & White If necessary, invert the image by «Invert Image» softkey. If necessary, select printing of date and time by «Print Date &...
-
Page 157: Maintenance And Storage
Version 1.0 ▪ June 2008 Network Analyzer A333 MAINTENANCE AND STORAGE 9.1. Maintenance Procedures This section describes the guidelines and procedures of maintenance, which will ensure fault-free operation of your Analyzer. The maintenance of the Analyzer consists in cleaning of the instrument, factory calibrations, and regular performance tests. -
Page 158: Storage Instructions
Version 1.0 ▪ June 2008 Network Analyzer A333 9.1.2. Factory Calibration Factory calibration is a regular calibration performed by the manufacturer or an authorized service center. We recommend you to send your Analyzer for factory calibration every three years. 9.1.3. Performance Test Performance test is the procedure of the Analyzer performance verification by confirming that the behavior of the instrument meets the published specifications. -
Page 159: 10. Warranty Information
Version 1.0 ▪ June 2008 Network Analyzer A333 10. WARRANTY INFORMATION 1. The manufacturer warrants the Network Analyzer to conform to the specifications of this Manual when used in accordance with the regulations of operation detailed in this Manual. 2. The manufacturer will repair or replace without charge, at its option, any Analyzer found defective in manufacture within the warranty period, which is twelve (12) months from the date of purchase. - Page 160 Version 1.0 ▪ June 2008 Network Analyzer A333 Technical Support Phone: Phone: +82-32-870-5637 Write: GS Instruments, Co., Ltd. 1385-14, Juan-Dong, Nam-Ku, Incheon, 402-200 Korea Product Information and Technical Assistance: www.gsinstrument.com protek@gsinstrument.com Jason@gsinstrument.com Revision History Date Version Changes 11/2007 Original Copyright ©...
-
Page 161: Appendix 1 - Default Settings Table
Version 1.0 ▪ June 2008 Network Analyzer A333 Appendix 1 — Default Settings Table Below are the default values defined in the process of the initial factory setting. Parameter Description Default Setting Parameter Setting Object Data Saving Type State and Calibration Analyzer Touchstone Data Format Real-Imaginary... - Page 162 Version 1.0 ▪ June 2008 Network Analyzer A333 Sweep Measurement Delay 0 sec. Channel Sweep Range Setting Start / Stop Channel Number of Segments Channel Points per Segment Channel Segment Start Frequency 300 kHz Channel Segment Stop Frequency 300 kHz Channel Segment Sweep Power Level 0 dBm...
- Page 163 Version 1.0 ▪ June 2008 Network Analyzer A333 S-parameter Conversion Trace S-parameter Conversion Function Z: Reflection Trace Trace Display Format Logarithmic Trace Magnitude (dB) Time Domain Transformation Trace Time Domain Transformation Start -10 nsec. Trace Time Domain Transformation Stop 10 nsec. Trace Time Domain Kaiser-Beta Trace...
- Page 164 Version 1.0 ▪ June 2008 Network Analyzer A333 © 2007, 2008 GS Instruments, Co., Ltd.
Need help?
Do you have a question about the Protek A333 and is the answer not in the manual?
Questions and answers