
Related Manuals for TE Connectivity Crimp Quality Monitor II


Summary of Contents for TE Connectivity Crimp Quality Monitor II
- Page 1 Crimp Quality Monitor II Part number 2359600-1 Customer Manual 412-10100 22 SEP 2022 Rev D Original instructions...
- Page 2 Our products are subject to natural wear and aging processes. All rights are retained by TE Connectivity (TE) in case of applications for protective rights. We reserve all rights of disposal, such as copying and transfer rights.
-
Page 3: Table Of Contents
412-10100 Contents Introduction ..............................7 Description ..............................10 Screen description ..........................10 Menu Bar ............................. 10 Control Panel Screen .......................... 11 Help ..............................12 Screen Information ..........................12 Graphing Information ........................... 12 Task Bar .............................. 13 Definitions ............................13 2.8.1 Headroom (and how it affects crimps) ..................... - Page 4 412-10100 Point to Point (P2P) / FFT Sensitivity ....................27 Sample ..............................28 4.10 Calibrate .............................. 29 4.11 Learn ..............................30 Production ..............................32 Basic Screen ............................33 Status ..............................34 Crimp Height ............................35 Work Index ............................36 Peak Force ............................37 P2P ..............................
- Page 5 412-10100 7.1.4 Piezo Sensor (Force Sensor) ......................71 7.1.5 Trigger Sensor (on non-TE terminators)..................71 Maintenance ..............................72 Touch screen cleaning ........................72 Daily maintenance ..........................72 Special handling precautions for systems with the linear encoder installed ........72 Quality control maintenance ........................ 73 Evaluation and repair ...........................
- Page 6 412-10100 SAFETY PRECAUTIONS — AVOID INJURY — READ THIS FIRST! NOTE Keep all decals clean and legible. Replace them when DANGER necessary. Inspect the tool and jaws/dies before each use. Replace any worn or damaged parts. A damaged or DANGER improperly assembled tool can break and strike nearby ELECTRIC SHOCK HAZARD personnel.
-
Page 7: Introduction
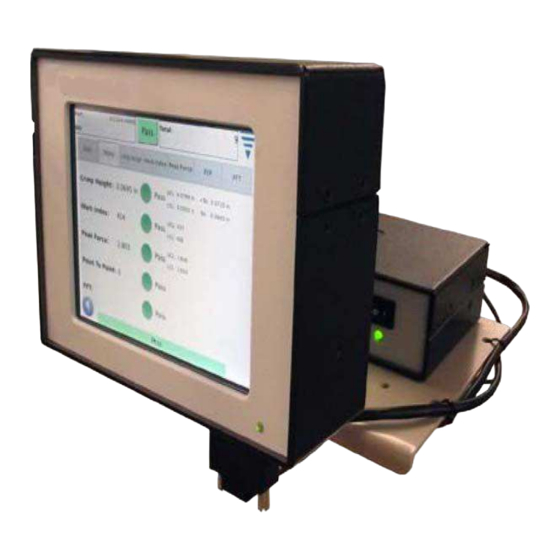
1 Introduction Crimp Quality Monitor II (CQM II, Figure 1) provides immediate inspection of the crimp height and the work curve of a crimp by analysis of data provided by force and position sensors. The sensors can be built into special CQM II applicators or installed into the terminating machine. - Page 8 412-10100 The CQM II was designed for many machines, but when it is installed on an AMP-O-LECTRIC™ Model G Terminating Machine (Figure 2) equipped with the crimp height adjustment motor, the CQM II automatically adjusts the crimp height to keep the process at nominal. The CQM’s operation, functions, screens, and touchscreen inputs are detailed in this document.
- Page 9 412-10100 The specifications for the CQM II are listed in Table 1, Table 2, and Table 3. Table 1: Electrical Operating voltage (DC power supply) 100-240 VAC, 50/60 Hz, 1.5 amps (max.) Host and DAQ (data acquisition) operating voltage 24 VDC Table 2: Ambient operating environment Temperature 5-40°...
-
Page 10: Description
412-10100 2 Description Screen description Many of the screens are designed to walk the operator through the crimping process with a series of arrows and headings. Menu Bar Icons on the menu bar (Figure 3) are used to access the home screen (Work Order Screen), Help, Control Panel, Back Arrow (to go to the previous screen), and a menu collapse arrow. - Page 11 412-10100 Control Panel Screen Table 5: What icons do Icon What it does Refer to Control Panel Control Panel screen Figure 4 Language Selecting the appropriate language Section 6.1 Allows the user to “log in” to the machine, and to “log off” the Login/logoff Section 6.2 machine...
-
Page 12: Control Panel Screen
412-10100 Figure 4: Control Panel screen The screen also contains a back arrow and menu collapse arrow button ( 12 of 74 Rev A... -
Page 13: Help
412-10100 Figure 4). NOTE User access can be set in the Users (icon) portion of the control panel. Help On any screen, touching the help icon displays relevant information from the CQM II manual. Screen Information If you touch a numeric field, a keypad is displayed. The keypad is specific to the information being entered. It displays the allowable ranges for most numeric entries. -
Page 14: Crimp Height
412-10100 The Crimp Quality Monitor II monitors the forces that occur during the crimping process. The forces are the result of forming the crimp profile of the terminal and the compression of the wire strands within the terminal. Headroom is the difference between the peak force of a complete crimp and an empty crimp. -
Page 15: Work Index
412-10100 2.8.3 Work index The work index is a dimensionless value that indicates the relative position of a specified section of the crimp curve while the wire and terminal combination is being compressed. Values from “Learn” crimps that are “Accepted as good” are collected to create a work index history. This is used to calculate a mean value and standard deviation. -
Page 16: Receiving, Inspection, And Installation
NOTE The installation instructions for the Crimp Quality Monitor II are included with the appropriate machine interface kit. For example, if the CQM II is being installed on a bench version of the AMP–O–LECTRIC Model G Terminating Machine, the CQM/GTM Kit is required. -
Page 17: System Settings
412-10100 System settings Touch the system settings icon to display the System Settings screen (Figure 6). This screen is used to set up the basic system configuration. Figure 6: System settings NOTE The System Settings must be configured by the CQM administrator before any CQM settings are modified. Production cannot be run until configuration of the System Settings is complete. -
Page 18: Setup Tab
412-10100 3.4.1 Setup Tab Touch the CQM Settings icon to display the CQM Settings screen (Figure 8). For the Custom selection, the four outputs can be configured to interface to the intended host machine, including the Crimp Enable output. A non-terminated cable is provided for connection to the host machine. Refer to the installation documentation for specifics. -
Page 19: Position Sensor Tab
412-10100 3.4.2 Position Sensor Tab Touch the Position Sensor tab (Figure 9) to select the position sensor that is installed on your terminating machine. Table 6 lists the position sensors that you can select. Figure 9: Position Sensor tab Table 6: Position sensors Sensor Description Linear Encoder... -
Page 20: Force Sensor Tab
412-10100 3.4.3 Force Sensor Tab Touch the Force Sensor tab (Figure 10) to select the force sensor that is installed on the terminating machine. The options are are Piezo Frame and Strain Gauge (base plate). Figure 10: Force Sensor tab 3.4.4 Sensor Calibration Tab If you have the Analog Height sensor, then you must calibrate it. -
Page 21: Learn Tab
412-10100 3.4.5 Learn Tab Touch the Learn tab (Figure 12) to configure the Learn settings. Start with the default setting of 5 crimps while you are gaining experience with the process. You can lower it to 3 crimps when you are confident in your process and the terminals you are using. -
Page 22: Control Limit Tab
412-10100 3.4.6 Control Limit Tab Touch the Control Limit tab (Figure 13) to set the control count. Perform Control Limit Checks: If you select this option, a control count error message is displayed when the number of consecutive control limits is equal to the Control Count. Figure 13: Control Limit Tab 3.4.7 Graphing Tab... -
Page 23: Production Run Setup
412-10100 4 Production run setup Options This is the first screen in the task bar. It is displayed when you touch the home icon on the menu bar. To use the options, select the corresponding radio button. Figure 15: Options Work Order Using a Work Order is optional list, provide additional detail in printed and saved Reports that the CQM II can provide. -
Page 24: Order Size
412-10100 Order Size To use the Order Size counters, select the Specify Total and Batch Sizes radio button. Touch each field (Total Size and Batch Size) to enter a value. Figure 17: Order Size Part You must select a part number. The part number determines the analysis method selections and associated parameters for the product that you want to produce. -
Page 25: Analysis Methods
412-10100 Analysis Methods Once you touch the Analysis icon, you will notice that the number of selections in the task bar increase to provide more choices for editing parameters for the Analysis methods. First, start by choosing the analysis method(s) for the part. Available analysis methods are: Crimp Height (only on TE terminators), Peak Force, Work Index, Point to Point, and FFT (systems with just a force sensor can only use the Peak Force and FFT methods). -
Page 26: Crimp Height
412-10100 Crimp Height If Crimp Height is selected, touch the Crimp Height arrow or the right arrow icon to move to the next task. Enter the specific Crimp Height and Tolerance for the part by touching the appropriate box. For the entry of tolerance, if the tolerance from the manufacturer is +/- 0.002”... -
Page 27: Peak Force (Pf) And Work Index (Wi) Sensitivity
412-10100 Peak Force (PF) and Work Index (WI) Sensitivity Touch the Up and Down arrows to change the sensitivity settings of the Peak Force and Work Index. Press Default to return the setting to the factory default. Default sensitivity settings typically work good for terminals and wire combinations that meet the minimum Head Room criteria of 35% or greater. -
Page 28: Point To Point (P2P) / Fft Sensitivity
412-10100 Point to Point (P2P) / FFT Sensitivity Touch the Up and Down arrows to change the sensitivity settings of the Point to Point and FFT. Press Default to return the setting to the factory default. Adjusting the sensitivity to eliminate problems or to enhance performance for these analysis methods is similar to the prior description for Peak Force and Work Index. -
Page 29: Sample
412-10100 Sample Use the Sample mode to make sample crimps to setup the process. In this task you will install the applicator, load product, and run your initial crimps to set terminal feed and crimp height. The CQM II will graph a crimp curve (provided the force is sufficient) but will not be analyzing the crimp. -
Page 30: Calibrate
412-10100 4.10 Calibrate If the system uses the Piezo Frame sensor, the first step in the Calibrate task is to perform a crimp so the CQM II can set the amplifier gain. Carefully inspect the crimp to ensure its quality. If the Crimp is not to your quality requirements, then you can Reset the gain and try again. -
Page 31: Learn
412-10100 4.11 Learn To learn the process, proceed with crimping the number of terminals required for Learn (as entered in the CQM Settings). Carefully inspect each crimp to ensure its quality. If the Crimp is not to your quality requirements, then you can Reject the crimp and do it again. - Page 32 412-10100 Figure 26: Crimp curve graph Once you have completed all of the Learn crimps, the display will indicate Process Learned. It is recommended to re-learn the process if something dramatically changes in the process such as changing to a new reel of terminals or a different type of wire. It is also advisable to Re-Learn if while in production you experience too many failures that with further inspection meet your quality requirements.
-
Page 33: Production
NOTE The Crimp Quality Monitor II is a PROCESS monitor. It is influenced by many variables that include changes in wire, terminal, applicator, terminal condition, operator, environment, etc. Changes in any of these variables, will affect the process and the process will have to be re-learned. -
Page 34: Basic Screen
412-10100 Basic Screen The basic screen (Figure 28 and Figure 29) provides a visual indication of the Crimp Status History for selected analysis methods. For each analysis method, the results are shown as: Green for a good crimp, red for a failed crimp, Orange for a Control Limit (not a failure but an indication that the Crimp Height is getting close to the tolerance), and white for a crimp that was not analyzed by that method. -
Page 35: Status
412-10100 Status The status screen provides individual status indicators for each selected analysis method as well as data that is relevant to the analysis method. If any one analysis method fails, the overall status of the crimp is a Fail. The colors of the indicators are as previously described in the Crimp Status History on the Basic screen. -
Page 36: Crimp Height
412-10100 Crimp Height The Crimp Height screen provides a crimp history graph showing the tolerance limits and the calculated crimp height for each crimp. To see more points than those shown, simply touch the graph to enter a full screen mode and use the arrow keys to move forward and backward in time. -
Page 37: Work Index
412-10100 Work Index The Work Index screen provides a crimp history graph showing the tolerance limits and the calculated work index calculated for each crimp. To see more points than those shown, simply touch the graph to enter a full screen mode and use the arrow keys to move forward and backward in time. -
Page 38: Peak Force
412-10100 Peak Force The Peak Force screen provides a crimp history graph showing the tolerance limits and the peak force recorded for each crimp. To see more points than those shown, simply touch the graph to enter a full screen mode and use the arrow keys to move forward and backward in time. - Page 39 412-10100 The Point-to-Point (P2P) graph on this screen shows the 50 points of the last crimp that are individually analyzed to ensure a good crimp. If any point is outside the tolerance band, then the result of the analysis is a Failure.
-
Page 40: Fft
412-10100 The Fast Fourier Transform (FFT) graph on this screen shows the component frequencies of the last crimp that are analyzed to ensure a good crimp. The FFT analysis requires five or more to be outside the calculated tolerance for a failure. This screen is useful to observe the component frequencies used in FFT. -
Page 41: Control Panel
412-10100 6 Control panel Touching the Control Panel icon on the main menu screen brings up the control panel. The following control panel tools are to be used by the CQM administrator. NOTE For system settings, refer to section 3.3. For CQM II settings, refer to section 3.4. Figure 37: Control panel Language icon To pick a language, touch the language icon, then select the appropriate language and save it. -
Page 42: Users
412-10100 Users 6.3.1 Add New User First enter the user name. Then enter the user password and then verify the password by entering it again. Choose Add User to finish Figure 38: Adding a new user 6.3.2 Change Password With the user selected from the drop down list, choose Change Password. The user must enter a new password and then verify the password by entering it again. -
Page 43: Permission Settings
412-10100 6.3.4 Permission Settings Permissions are a method to allow or not allow individual users access to certain tasks or actions that can be performed on the CQM II. With the user selected from the drop down list, choose the appropriate radio button to provide the user permission for the various tasks and actions. - Page 44 412-10100 User permissions are grouped by certain tasks or actions. The available selections are listed in Table 7: User permissions. Table 7: User permissions Screen Screen function CQM settings (change) Modify any settings on CQM Settings screens [SCREEN ACCESS] Calibrate screen Calibrate and learn (access) [SCREEN ACCESS] Learn screen Enter a new work order or delete a work order...
-
Page 45: Locale Settings
412-10100 Locale Settings Touch the icon to select the Locale screen. The thousands separator, decimal symbol, time format, date format, and default units selection can be made in this screen. Figure 40: Locale settings 45 of 74 Rev A... -
Page 46: Date/Time Settings
412-10100 6.4.1 Date/Time Settings Touch the icon to select the Date and Time screen. The time and date formats are set in the Locale section of the Control Panel. 6.4.1.1 Date Set the year, month, and day. Then choose SET Figure 41: Setting the date 6.4.1.2 Time... -
Page 47: Reports
412-10100 6.4.2 Reports Touch the icon to select the “Reports” screen. NOTE The reports screen is a very busy screen and it may be easier to navigate by plugging in a USB mouse.) NOTE The reports screen is a spreadsheet that contains past history of production work orders or parts that have been run. Each entry is referred to as an “Instance.”... - Page 48 412-10100 6.4.2.2 Pressing on the Row Pressing on the row for a PRODUCTION RUN will allow the operator to see more detailed information about the crimps in the run (Figure 44). Figure 44: Crimps in a production run “Print Table” Button 6.4.2.3 On each view of the data table it is possible to press the “Print Table”...
- Page 49 412-10100 6.4.2.5 Production Detail View When the detailed data on the production run is displayed each crimp and its results are shown. You will see the Crimp Number, Overall Result, Batch Count, Total Count, Time Stamp, Part Number, Crimp Mode of each individual crimp.
- Page 50 412-10100 6.4.2.5.1.1 Crimp Detail View This view shows all the details for the crimp. The crimp data and the results at the time of the crimp are shown. The data shown is complete. Table 10: Crimps details Table 11: Crimp result data Field Description Instance ID...
- Page 51 412-10100 Table 13: Crimp height history data (only shown for production mode crimps) Field Description Crimp result PASS or FAIL from crimp height analysis Measured crimp height Crimp height value from the crimp height analysis Upper control limit Lower control limit Nominal crimp height Crimp height desired and set in the part Control limit...
- Page 52 412-10100 6.4.2.5.1.2 Statistics View When the “Show Statistics” button is pressed the statistics for the selected production run is displayed. From this screen the statistics report can be viewed, saved, or printed. A summary of the production run is shown. For the Crimp Height, Work Index and Peak Force analysis the statistics are displayed if they are active in this production run.
- Page 53 412-10100 6.4.2.5.1.3 Raw Data Output File When the “Save Raw Data” button is pressed all the data about the selected production run will be saved to a file. The file is a comma delimited file suitable to be viewed in a spreadsheet program like Microsoft Excel. The first and second line shows the Production Run information.
-
Page 54: Report Setup
412-10100 6.4.3 Report Setup Touch the icon to select the Report Setup screen. This mode allows you to format the statistic reports that are generated for printing or saving as a pdf to a USB Flash drive. Touch the Company Name and enter the name you choose. You can import an image, for example your company logo, by touching the Choose File button. -
Page 55: Network
412-10100 6.4.5 Network The CQM can be connected to a network via it's ethernet connection. Currently, the CQM only supports network printing. No other network functionality is supported with the current release. Future versions may offer additional functionality. Someone in your company’s IT organization may need to be involved with setting the CQM network. - Page 56 412-10100 6.4.5.2 Status Tab Displays the current IP address for the CQM. The Restart Networking button should be used whenever the CQM is connected to a different network while it is already powered up, and will cause the CQM to attempt to configure it's IP address if DHCP is enabled. If connected to a network with a DHCP server, such as a corporate network, home internet gateway, or router, the CQM obtains its IP address from the DHCP server.
-
Page 57: Display Settings
412-10100 6.4.6 Display Settings Touch the icon to select the Display Settings screen. You can adjust the display brightness and screen saver time out by touching on the pointer on the slider and dragging it. When the screen saver is active, the display will be dark and the LED on the Host will be amber. Simply touch the display and it will return to the normal operating state. -
Page 58: Calibrate Touchscreen
412-10100 6.4.7 Calibrate Touchscreen Touch the icon to select the Calibrate Touch screen. Calibration of the touch screen is performed at initial build and should not be required unless something happens with the integrity of the touch surface. Choose Calibrate Touch and follow the on screen instructions. -
Page 59: Maintenance
412-10100 6.4.8 Maintenance The Maintenance section is provided for authorized users to see information about the system and to perform data maintenance. 6.4.8.1 About Tab This screen displays the various Licenses for third-party software used in the application. Figure 52: About tab 6.4.8.2 Quit Tab This screen is used to quit the software application. - Page 60 412-10100 6.4.8.3 Version tab This screen displays the various software versions that are currently installed on the CQM. Figure 53: Version tab 60 of 74 Rev A...
- Page 61 412-10100 6.4.8.4 Firmware Update Tab This screen is used to update the firmware on the CQM. Follow the onscreen instructions. NOTE Update the firmware only when instructed to do so by TE personnel. Figure 54: Firmware update tab 61 of 74 Rev A...
- Page 62 412-10100 6.4.8.5 File Operations Tab This screen is used for certain file operations. Follow the on screen instructions. Figure 55: File operations tab 6.4.8.6 Database Operations Tab This screen is used to backup and restore the system database. Choose the appropriate selection and follow the on screen instructions.
-
Page 63: Diagnostics
412-10100 6.4.9 Diagnostics The Diagnostics section is provided for authorized users to monitor the hardware status of the system. 6.4.9.1 Health Monitor Tab The Health Monitor screen displays the internal temperatures of various components within the system. Figure 57: Health Monitoring tab 63 of 74 Rev A... - Page 64 412-10100 6.4.9.2 Host I/O Tab The Host I/O screen displays the status of the modules Inputs and Outputs. Output states can be changed by touching the appropriate icon. NOTE Change output states only when instructed to do so by TE personnel. Figure 58: Host I/O tab 64 of 74 Rev A...
- Page 65 412-10100 6.4.9.3 DAQ I/O Tab The DAQ I/O screen displays the status of the modules Inputs and Outputs. Output states can be changed by touching the appropriate icon. Figure 59: DAQ I/O tab 65 of 74 Rev A...
- Page 66 412-10100 6.4.9.4 Piezo Tab The Piezo screen provides a means to diagnose the Piezo sensor input. NOTE Perform this diagnosis only when instructed to do so by TE personnel. Figure 60: Piezo tab 66 of 74 Rev A...
-
Page 67: Error Log Viewer
412-10100 6.4.9.5 CANOpen Node Tab The CANOpen Node screen provides information regarding the CAN address of the attached modules. Figure 61: CANOpen Node tab 6.4.10 Error Log Viewer The Error Log Viewer provides a list of various errors, system setting changes, etc. that may be useful for diagnosing system problems. -
Page 68: Demo
412-10100 6.4.11 Demo The Demo selection is primarily used for demonstration and training purposes. When placed in the Demo mode, the unit restarts the application utilizing a different database so as to not corrupt the main database. Most all functionality exists in the Demo mode, but a real terminator with sensors is not needed. When you’re on the screens that you would typically perform a crimp, just touch the ‘Virtual’... - Page 69 412-10100 printing, as it may be disabled by default). Printing to printers with these protocols can be configured via the CUPS web interface using a web browser on any PC. To access the CUPS web interface, obtain the CQM's IP address via the Network Status screen, and then browse to the following URL: "http://x.x.x.x:631", where "x.x.x.x"...
-
Page 70: Troubleshooting
412-10100 Features such as color mode, print quality, print resolution, paper tray selection, etc, can be selected on this screen. Usually, these settings can all be left at their defaults. 7 Troubleshooting Table 18: General troubleshooting Problem Corrective action Carefully inspect the crimp. Does it meet your quality criteria? Ensure that the tooling is in optimum condition. -
Page 71: Additional Information For Specific Sensors
412-10100 *Any crimp done on the sample screen is reported as INVALID because it is not analyzed. You want to look at the crimps that are reported as INVALID in LEARN_MODE. Table 20 lists the fields where the status is displayed. -
Page 72: Base Plate Strain Gage (Force Sensor)
412-10100 7.1.3 Base Plate Strain Gage (Force Sensor) Is the correct Force Sensor selected in CQM Settings? Is the cable connected to the DAQ module and the base plate? Check for damaged cable. If it is damaged, replace it. ... -
Page 73: Maintenance
412-10100 8 Maintenance The following procedures have been established to assure the quality and reliability of the CQM. The CQM should be checked daily, and a more detailed inspection should be performed (according to your quality control group) on a regular basis. Touch screen cleaning The front surface of the touch screen should be kept free of dirt, dust, fingerprints and other materials that could degrade optical properties. -
Page 74: Quality Control Maintenance
Go to TE.com and click the Shop TE link at the top of the page. Call 800-522-6752. Write to: CUSTOMER SERVICE (038-035) TE CONNECTIVITY CORPORATION PO BOX 3608 HARRISBURG PA 17105-3608 For customer repair services, call 800-522-6752. 10 Revision summary Revisions to this customer manual include: ...
Need help?
Do you have a question about the Crimp Quality Monitor II and is the answer not in the manual?
Questions and answers