Table of Contents
Advertisement
Quick Links
Advertisement
Table of Contents

Subscribe to Our Youtube Channel
Related Manuals for VeEX RXT-6400


Summary of Contents for VeEX RXT-6400
-
Page 2: Table Of Contents
Table of Contents 1.0 About This User Manual 2.0 Safety Information 3.0 Introduction 3.1 Connector Panels & Test Ports 4.0 RXT Operations 5.0 Ethernet 5.1 Ethernet Setup 5.1.1 Test Port Selection 5.1.2 Port Setup 5.1.3 Measurement Settings 5.1.4 CDR Access 5.1.5 I2C Access 5.1.6 Pre-emphasis 5.2 IP... - Page 3 5.3.2.1 Summary 5.3.2.2 Errors 5.3.2.3 Events 5.3.2.4 Traffic 5.3.2.5 Rates 5.3.2.6 Delay 5.3.2.7 Alarms 5.3.2.8 Signal 5.4 RFC 2544 Conformance Testing 5.4.1 Set up Standard Mode 5.4.1.1 Header Settings 5.4.1.2 Frame Settings 5.4.1.3 Threshold Settings 5.4.1.4 Threshold, Latency, Frame Loss and Burst Settings 5.4.1.5 Starting/Stopping a RFC 2544 Measurement 5.4.2 Results - Standard Mode 5.4.3 Saving RFC 2544 Results...
- Page 4 5.6.1.7 FEC 5.6.1.8 Starting/Stopping a Throughput (Multiple Streams) Test 5.6.2 Throughput Results 5.6.2.1 Viewing Throughput (Multiple Streams) Test Results 5.6.2.2 Global/Aggregate Results 5.6.2.3 Per Stream Results 5.6.2.4 Saving Throughtput (Multiple Streams) Results 5.7 Autoscripting 5.8 Packet Capture 5.8.1 Packet Capture Setup 5.8.2 Packet Capture Results 6.0 Lane BERT 6.1 Lane BERT Set up...
- Page 5 8.3 Saving PCS Results 9.0 Advanced Optical Transceiver Test & Stress Test 9.1 Transceiver Stress Test 9.2 Advanced Optical Transceiver Test 10.0 Warranty and Software 11 Certification and Declarations 12.0 About VeEX Go back to top RXT-6400_Module_Manual Page 5 of 119...
-
Page 6: About This User Manual
(c) Copyright 2020 VeEX Inc. All rights reserved. VeEX, VePAL are registered trademarks of VeEX Inc. and/or its affiliates in the USA and certain other countries. All trademarks or registered trademarks are the property of their respective companies. No part of this document may be reproduced or transmitted electronically or otherwise without written permission from VeEX Inc. -
Page 7: Safety Information
Do not operate the instrument in the presence of flammable gases or fumes or any other combustible environment. VeEX Inc. assumes no liability for the customer's failure to comply with safety precautions and requirements. - Page 8 50% of its capacity. Spare battery packs should be charged and used at least once a year to prevent over-discharge (rotate them regularly). It is recommended to charge and use battery packs at least every three months. Battery packs must not go without recharging (reconditioning) for more than six months.
-
Page 9: Introduction
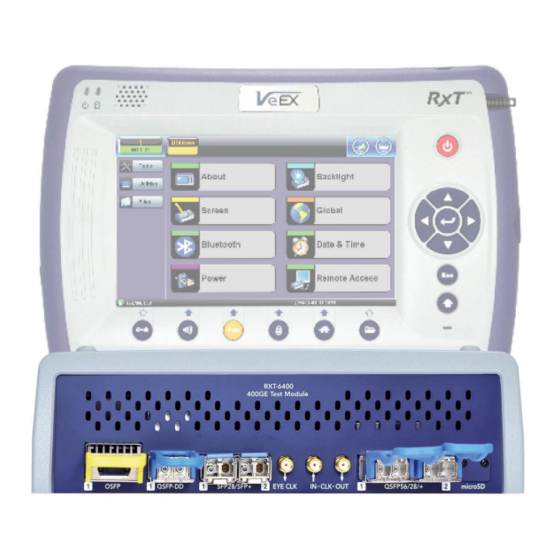
3.0 Introduction The RXT-6400 is the first truly portable 400G test set offering native PAM4, QSFP-DD and OSPF support. Equipped to support all common transceiver form-factors, this module is a perfect complement to the RXT Platform, extending its testing range to 400 Gbps and offering a future upgrade path for all-in-one 10M-to-400GE testing. -
Page 10: Rxt Operations
4.0 RXT Operations 4.1 Basic Operations For information on Basic Operations, Home menu, Launching Test Applications, and other features specific to the RXT-6400 Host Chassis, refer to the RXT-1200 Platform Manual. 4.2 Utilities Refer to the RXT-1200 Platform Manual for information about all Utilities and Tools available. -
Page 11: Ethernet
Ethernet test modes are accessed by selecting the Test Application button at the top of the screen . Tap on a technology group then select a test interface. Depending on interface options purchased, the following selections are possible: Single/dual port combinations present on RXT-6400: Single port 400GE (OSFP) Single port 400GE (QSFP-DD) -
Page 12: Port Setup
5.1.2 Port Setup Port setup or test interface configurations are accessed via the Setup menu located on the Home page. The available configuration settings depend on the interface selected in the Test Mode selection. Select the operation mode and the interfaces that will be used to carry out tests. Once the operating mode and interfaces are selected, independently configure the auto-negotiation, speed, duplex, and flow control settings for each port (where applicable). - Page 13 10 GE Setup 10 GE Port Network Type: LAN Flow Control: Enable/Disable Clock Source: Internal, External (2Mbps, 2MHz, 1.5Mbps, 1.5MHz, 10MHz, 1PPS), RxCLK, GPS1PPS Clock Offset (pmm): 0.0 Link Fault Response: Enable/Disable 40 GE Setup 40 GE Port Network Type: LAN Flow Control: Enable/Disable Clock Source: Internal, External (2Mbps, 2MHz, 1.5Mbps, 1.5MHz, 10MHz, 1PPS), RxFCf, GPS1PPS Clock Offset (ppm): 0.0...
- Page 14 100 GE Setup Setup Clock Source Clock Offset RXT-6400_Module_Manual Page 14 of 119...
-
Page 15: Measurement Settings
100 GE Port 100G port profile: Default Network Type: LAN Flow Control: Enable/Disable Clock Source: Internal, External (2Mbps, 2MHz, 1.5Mbps, 1.5MHz, 10MHz, 1PPS), RxFCf, GPS1PPS Clock Offset (ppm): 0.0 Link Fault Response: Disable/Enable 400 GE Setup 400 GE Port 400G port profile: Default Network Type: LAN Flow Control: Enable/Disable Clock Source: Internal, External (2Mbps, 2MHz, 1.5Mbps, 1.5MHz, 10MHz, 1PPS), RxCLK, GPS1PPS... - Page 16 The measurement and event log settings are configured in this screen. Profile: Last configuration, Lock, Delete, Save, Save as..., Default. Mode: Manual or timed Manual mode: User starts and stops the measurements manually. Timed mode: User defines the duration of the test; after the test is started, the test will run for the configured duration and stop automatically.
-
Page 17: Cdr Access
Go back to top Go back to TOC 5.1.4 CDR Access (100GE Only) CDR Access Enables TX and RX CDR to be turned on Go back to top Go back to TOC 5.1.5 I2C Access I2CAccess Transceiver I2C (MDIO) Register Read/Write Module information, settings, status and control Reconfigure the PHY and monitor status 5.1.6 Pre-emphasis... -
Page 18: Ip Connection
Per-lane PAM4 Pre-emphasis Settings Advanced user can configure PAM4 signal conditioning circuits for each lane, on the host side, to match a transceiver for the best performance Per-lane Pre-taps (1,2,3), Post-tap and Attenuation Can be used to verify/stress transceiver tolerances Go back to top Go back to TOC 5.2 IP 5.2.1 IP Connection... -
Page 19: Status
IPv4 or IPv6 IP Type: PPPoE, IPv4 or IPv6 Profile: Delete, Save, Save as ..., Default IP Address: Static, DHCP (IPv4 only) or AUTO (IPv6 only) Static: The user is required to enter a Local IP, Gateway address, and Subnet. All Static fields can be filled by tapping on the section to access an alphanumeric keyboard Local IP: IPv4/IPv6 address of the test set Gateway:IPv4/IPv6 address of the network gateway... -
Page 20: Trace Route
DHCP: PASS indicates that an IP address has successfully been assigned. IP: PASS indicates that the IP address assigned has been verified to be unique in the network. Gateway: PASS indicates that the gateway IP address is valid. DNS: PASS indicates that the DNS IP address is valid. Go back to top Go back to TOC 5.2.2 Trace Route Trace Route is a common method used to find the route to the destination IP address or URL. -
Page 21: Bert
5.3 BERT 5.3.1 BERT Setup Tap on Advanced Tools (Home Menu) > BERT icon to access BER testing features. (Only Layer 2&3 available) Overview: BER testing at Layer 1, 2, 3, and 4 is supported. The BERT can be configured to use either regular PRBS test patterns, stress patterns (specifically for 10Gigabit Ethernet) or user defined test patterns to simulate various conditions. - Page 22 Ethernet Type I-SID Backbone VLAN ID, Priority, Type Test: Select the test layer to perform the BERT Options are Layer 1 Unframed, Layer 1 Framed, Layer 2, Layer 3, and Layer 4 Frame Type: Select the Ethernet frame type for Layer 2 or Layer 3 802.3 Raw (IEEE 802.3 frame without LLC) - Not available when Layer 3 is selected 802.3 LLC (IEEE 802.3 frame with LLC header) 802.3 SNAP (IEEE 802.3 frame with SNAP header)
- Page 23 MAC Source: Use the default source address of the test set or configure a new or different address. MAC Destination: Configure the destination MAC address of the far-end partner test set or use the ARP or ARP GW keys to determine the MAC address of the destination IP address (ARP) or the Gateway (ARP GW). A valid IP connection needs to be up to use these functions.
- Page 24 BERT Setup - VLAN Tag configuration (Layer 3) Go back to top Go back to TOC MPLS Tab: In the MPLS tab the following parameters are configured: MPLS label: Configurable in the range 16 through 1,048,575 (labels 0 to 15 are reserved). (Composed of 20 bits which allows for the creation of over one million labels).
- Page 25 Go back to top Go back to TOC IP Tab: In the IP tab the user must configure the destination IP address and source address. The user may also configure the following IP header fields: IP Type: IPv4 IP Src and IP Dest: For IP Src, if the IP connection is up, refer to RXT-1200 Platform Manual Chapter 7_Tools>...
- Page 26 Data Tab: User selects a test pattern that will be encapsulated in the Ethernet frame payload (for framed mode). Depending on the test layer, different test pattern options are available. Layer 1 Framed Test Patterns CRPAT: Compliant Random Pattern provides broad spectral content and minimal peaking for the measurement of jitter at component or system level.
- Page 27 RDPAT (Random Data Pattern): Designed to provide energy across the entire frequency spectrum providing good simple BER testing. JTPAT (Jitter Tolerance Pattern): Designed to verify jitter tolerance on the receivers by exposing a receiver's CDR to large instantaneous phase jumps. The pattern alternates repeating low transition density patterns with repeating high transition density patterns.
-
Page 28: Traffic Settings
Go back to top Go back to TOC RX Filter Tab: Allows the user to filter incoming streams. When checked, the incoming traffic flows not matching these criteria will not be considered for these results. MAC Destination address MAC Source address VLAN VLAN Priority VLAN Eligible... - Page 29 Ramp: The selected frame is transmitted at maximum bandwidth according to the selected duty cycle and burst period. Burst: The selected frame is transmitted in a staircase profile according to user selectable step time, number of steps, and maximum bandwidth. Single Burst: Configure the number of frames to be transmitted in the burst along with the bandwidth.
-
Page 30: Error Injection
Count: Configures the error count via a numeric keypad. BERT Setup - Error Injection Error Inj. Function Error Injection After pressing Start, error injection can be enabled by pressing the Error Inj. button on the right side of the screen. Go back to top Go back to TOC 5.3.1.4 Starting/Stopping a BERT Once all configurations have been made, the user can start the BERT test (press the Start icon on the top right section of the... -
Page 31: Results
loopback that is in place. Go back to top Go back to TOC 5.3.2 BERT Results 5.3.2.1 Summary Summary tab: The following results including the Start (ST) and Elapsed (ET) times are displayed: Line Rate (Mbps): Negotiated rate of the interface (10M, 100M, or 1000M). This value is always fixed since it depends on the maximum capacity of the link under test, hence the test interface that is configured. -
Page 32: Events
Go back to top Go back to TOC 5.3.2.3 Events Events tab: A time stamped record or log of anomalies, alarms, test status (start/stop) and test application are displayed. BERT Results - Events Go back to top Go back to TOC 5.3.2.4 Traffic Traffic tab: The following Traffic statistics are displayed: Frame type: Test and non-test frames... - Page 33 Go back to top Go back to TOC Frames tab: The following Frame distribution statistics are displayed in Count (#) and Percentage (%): Received (RX) frames: Total frames Test frames VLAN tagged frames Q-in-Q VLAN stacked frames Non-test frames Transmitted (TX) frames: Total frame - Total # frames transmitted Pause frames: Total number of transmitted and received Ethernet pause flow-control frames BERT Results - Frames...
-
Page 34: Rates
Go back to top Go back to TOC Frame Size tab: The following Frame distribution statistics are displayed in Count (#) and Percentage (%): < 64 bytes frames 64-127 byte frames 128-255 byte frames 256-511 byte frames 512-1023 byte frames 1024-1279 byte frames 1280-1518 byte frames >... -
Page 35: Delay
Go back to top Go back to TOC 5.3.2.6 Delay Delay tab: Delay measures the interpacket gap, start of the frame, and preamble duration. Frame arrival statistics are displayed in tabular format: Current Minimum Maximum Variation (Current) - Interframe delay variation BERT Results - Delay Go back to top Go back to TOC 5.3.2.7 Alarms... - Page 36 BERT Results - Alarms Go back to top Go back to TOC 5.3.2.8 Signal The Signal tab (fiber ports only) displays the Tx (and Rx) optical levels measured by the transceiver. Page 1 displays the level measurement in dBm for the optical signals. Loss of Signal (LOS) and the Saturation levels for optical signals are shown graphically including the level measurement in dBm.
- Page 37 Signal (Page 3) BERT Results - Signal (Page 3) The received signal frequency and offset is measured and performed on the optical interface (Transceivers). Current: Indicates the frequency of the input signal. Offset: Indicates the difference between the standard rate and the rate of the input signal. Min (ppm): Indicates the difference between the standard rate and the minimum deviation detected in the input signal.
-
Page 38: Signal
5.4 RFC 2544 Conformance Testing Overview Setup - Standard Mode Header Settings Frames Settings Threshold Settings Throughput Settings Latency Settings Frame Loss Settings Burst Settings Starting / Stopping a RFC2544 Measurement Results - Standard Mode Status Summary Signal Events Latency / Jitter Frame Loss Burst Saving Results... -
Page 39: Frame Settings
MPLS: MAC, VLAN, MPLS, IP, and Test Pattern Configurations: MAC Header Tab Data Tab: No payload selection is possible. The payload area is populated with a VeEX signature field and other proprietary data. RX Filter Tab VLAN Tab MPLS Tab... -
Page 40: Threshold Settings
To add additional test frames, tap the Add Frame button. Enter the frame size using the numeric keypad and click apply. Press the back button to return to the frames screen. The new custom frame size is displayed (it can be enabled or disabled as needed). RFC 2544 Setup - Frame Settings Go back to top Go back to TOC 5.4.1.3 Threshold Settings... - Page 41 Go back to top Go back to TOC 5.4.1.4 Throughput, Latency, Frame Loss, and Burst Settings The RFC 2544 test suite allows the user to run all four tests, one of the four tests, or a combination of any of the four tests. The user simply has to enable/disable which tests to perform by checking/unchecking a selection box in the respective tab for each test.
- Page 42 Go back to top Go back to TOC Latency tab: User configures the following: Test: Throughput Rate or Custom Rate. The default value is throughput. Throughput rate: Latency test will be performed at the throughput rate found for each of the tested frame sizes. Custom rate: User configures a custom rate in % or Mbps.
- Page 43 of the link is 100Mbps, then the maximum transmit rate will be 90Mbps or 90% of the line rate. Step Size: 1 to 10%. The default value is 10%. The step size is the rate % that the frame loss test will be reduced by in the event of any frame loss. For example if the Max Rate is 100Mbps (or 100%) and frames are lost at this rate, then the transmit rate will be reduced to 90Mbps (or 90%).
-
Page 44: Starting/Stopping A Rfc 2544 Measurement
Go back to top Go back to TOC 5.4.1.5 Starting/Stopping a RFC 2544 Measurement Once all configurations have been made, the user can start the RFC 2544 test (press the Start icon on the top right section of the screen). The following are two scenarios of how to prepare and start the unit for RFC 2544 testing. If testing on the fiber ports, make sure the LASER is turned On before starting the test. - Page 45 Go back to top Go back to TOC Summary tab: The following results including the Start (ST) and Elapsed (ET) times are displayed: Line Rate (Mbps): Negotiated rate of the interface (10M, 100M, or 1000M). This value is always fixed since it depends on the maximum capacity of the link under test, hence the test interface that is configured.
- Page 46 Go back to top Go back to TOC Events tab: A time stamped log of each test is displayed. RFC 2544 Results - Events Go back to top Go back to TOC Throughput tab The Throughput tab displays the maximum throughput rate of the link under test. Results are displayed in graphical and table formats.
- Page 47 RFC 2544 Results - Throughput (Summary Table) RFC 2544 Results - Throughput (Test Log Table) Go back to top Go back to TOC Latency and frame jitter measurements results are displayed in the following formats. Use the drop-down menu to select the Latency format: Graphical: Latency results displayed in line graph form (Latency [us] vs Frame size [bytes]).
- Page 48 Rate (%): Percentage of frames transmitted. Data rate used for latency test. Pass/Fail test status. RFC 2544 Results - Latency (Summary) RFC 2544 Results - Latency (Graphical) RFC 2544 Results - Latency (Test Log) RFC 2544 Results - Latency (Jitter Graphical) RXT-6400_Module_Manual Page 48 of 119...
- Page 49 RFC 2544 Results - Latency (Jitter Summary) RFC 2544 Results - Latency (Jitter Test log) Go back to top Go back to TOC Frame Loss tab: Frame loss displays the percentage of frames not received. Use the drop-down menu to select the Frame Loss format: Summary and Test log tables display test frame length, byte size, frame loss (%) from received traffic, and rate (%) transmitted.
- Page 50 RFC 2544 Results - Frame Loss (Summary) RFC 2544 Results - Frame Loss (Graphical) RFC 2544 Results - Frame Loss (Test log) Go back to top Go back to TOC Burst tab: Burstability (back-back) results are the number of frames successfully transmitted/received at the line rate. It is displayed in the following formats: Summary table: Displays Average Frame Count received for each test frame length Test log table: Displays Average Frame Count and Duration (seconds) for each test frame length...
- Page 51 RFC 2544 Results - Burstability (Summary) RFC 2544 Results - Burstability (Test Log) FEC tab: RFC 2544 Results - FEC Summary RFC 2544 Results - FEC Alarms/Errors RXT-6400_Module_Manual Page 51 of 119...
- Page 52 RFC 2544 Results - FEC Alarms/Errors Lane Details RFC 2544 Results - FEC Alarms/Errors Corr. Symbol Details The FEC Correctable Symbol Breakdown page shows the Symbol Errors per FEC Codeword distribution, which is important to RXT-6400_Module_Manual Page 52 of 119...
-
Page 53: Saving Rfc 2544 Results
benchmark the quality of the transceiver and/or PAM4 signal. KP4 FEC can only correct up to 15 symbol errors per codeword, so rows 1 to 15 show the amount of correctable errors, based on how many bad symbols found in the received codeword. The closer the numbers are to the top, the better the quality and performance of the link. -
Page 54: V-Sam
Overview V-SAM is not supported for 400G as yet. V-SAM (VeEX Service Activation Methodology) is an automated Ethernet service activation test feature conforming to the ITU-T Y.1564 standard, created to address and solve the deficiencies of RFC 2544: • RFC 2544 was limited to test at the maximum throughput line rate for a single service. SAM is able to run multiple... - Page 55 The test is broken down into two phases: Phase 1: Service Configuration test: The services running on the same line are tested one by one to verify the correct service profile provisioning. Phase 2: Service Performance test: The services running on the same line are tested simultaneously over an extended period of time, to verify network robustness.
- Page 56 Go back to top Go back to TOC 5.5.1 V-SAM Setup General (Page 1 and 2) V-SAM Profile: Delete, Save, Save as..., Default, or Last Configuration. # of Services: Select the number of services to run. Up to 8 services can be chosen for a 1 GE interface and up to 10 services can be chosen for a 10 GE interface.
- Page 57 Go back to top Go back to TOC CIR Test Configuration CIR Test Config.: Select Simple Test, Step Load Test, or Simple and Step. Simple Test: Starts the tests at the CIR. Step Load Test: Starts the test below the CIR and continues in steps until it reaches the CIR. Simple and Step Load Test: Step Load Test performs only if the Simple Validation test fails.
- Page 58 that add resiliency and configurable performance levels in the provider backbone network. Both options are available for 1GE Copper/Fiber and 10GE port for all Ethernet tests (Layer 2,3 and 4) - BERT, RFC2544, Throughput, V-SAM. Tap the PBB or MPLS-TP block to configure the settings. All fields are configurable. PBB: Backbone MAC Source Backbone MAC Destination...
-
Page 59: Service Attributes
Go back to top Go back to TOC 5.5.1.2 Service Attributes Bandwidth Profile Parameters The Bandwidth Profile specifies how much traffic the customer is authorized to transmit and how the frames are prioritized within the network. In the Bandwidth table, the user specifies the following bandwidth criteria: CIR: Committed Information Rate. - Page 60 The Policing test fails if the higher traffic rate is allowed through the network. Color Aware: Enable, Disable. When Color Aware is enabled, the Drop Eligible parameter in the VLAN header configuration screen is not available for configuration. If no VLAN is configured for the service traffic, the Color Aware parameter is ignored. CBS and EBS: Committed Burst Size (CBS) and Excess Burst Size (EBS).
-
Page 61: Results
Copying Services Tap on the Copy button on the bottom of the Header or Service Attributes tabs to copy frame parameters specific to that tab to other services. For example, pressing Copy on the Header tab will only transfer header parameters to other services. Go back to top Go back to TOC 5.5.2 Results Results - Config. - Page 62 FTD: Measures the time that the frames can take to travel from source to destination. FDV: Measures the frame jitter. Frame Loss Count: Counts the number of lost frames. Frame Loss Ratio: Ratio of lost frames to the total transmitted frames. CIR Test - Service 1 CIR test: The test passes if all measured values are below the thresholds configured.
- Page 63 Policing test: The test passes if the received traffic rate is at least at the CIR (minus the margin allowed by the FLR) but does not exceed the allowed CIR+EIR. Results - Config. Tests - Summary Summary: The Summary tab displays the status of each service and test as Pass, Failed, Pending, or Disabled. Perf.
- Page 64 The Service # tabs display min, mean, and max values for IR Mbps, FTD, FDV, Frame Loss Count, Frame Loss Ratio (%), Availability, and Errored Frame Count. Pass/Fail/Pending status of each test is displayed on the top of each table. IR Mbps, FTD, FDV, Frame Loss Count, Frame Loss Ratio (%) definitions are listed in the Configuration Test section.
-
Page 65: Throughput Testing
5.6 Throughput Testing (Multiple Streams) Setup General Settings Per Stream Configurations Traffic Settings Error Injection Settings Alarm Injection Settings Summary Starting/ Stopping a Throughput Test Results Viewing Throughput (Multiple Streams) Test Results Global Aggregate Results Per Stream Results Saving Throughput (Multiple Streams) Results Overview: The throughput application (or the multiple streams application) performs the following measurements: throughput performance, frame loss analysis, delay analysis, frame/packet arrival analysis, received traffic type analysis, and received traffic frame size... - Page 66 Page 2: #of Streams: From 1 to 10 streams. # of Streams can be specified either on Page 1 or Page 2. It will be reflected on both pages. Delay Measurement Mode: Disable, Round Trip Delay. Local One way delay measurement, Atomic one way delay, or GPS one way delay are also available depending on the Clock Synchronization device selected in the Setup (home menu) >...
- Page 67 Multiple Streams All streams are configured for the same test layer - if Layer 2 is selected, all streams will be Layer 2 traffic. Go back to top Go back to TOC 5.6.1.2 Per Stream Configurations MAC Setup MAC configuration in the Throughput section features MAC flooding for buffering verification and performance testing of Ethernet switches.
-
Page 68: Error Injection Settings (Per Stream Configuration)
Stream #: Select a stream number to configure. Traffic Flow: Select from Constant, Ramp, Burst, or Single Burst traffic flow. Frame Size (Type): Fixed or Uniform. If uniform is chosen, the user will have to input a minimum and maximum frame size. Frame Size (bytes): If a fixed frame size is chosen, this option is enabled. -
Page 69: Alarm Injection Settings
Go back to top Go back to TOC 5.6.1.5 Alarm Injection Settings Alarm injection can be performed during the test. The type of alarms and alarm injection are configured in the Alarm Injection tab. Once the test is running, alarm injection can be performed by pressing the Alarm Inject button on the right side of the screen. Alarm Injection is available only with 10GE Port Tests. - Page 70 Throughput Test - Summary (VLAN List) Throughput Test - Summary (Port List) Throughput Test - Summary (MPLS List) RXT-6400_Module_Manual Page 70 of 119...
-
Page 71: Fec
5.6.1.7 FEC Throughput Test - FEC Summary Throughput Test - FEC Alarm/Errors Throughput Test - FEC Alarm/Errors Lane Details RXT-6400_Module_Manual Page 71 of 119... - Page 72 Throughput Test - FEC Alarm/Errors Corr. Symbol Details Throughput Test - Skew Go back to top Go back to TOC RXT-6400_Module_Manual Page 72 of 119...
-
Page 73: Starting/Stopping A Throughput (Multiple Streams) Test
5.6.1.8 Starting/Stopping a Throughput (Multiple Streams) Test Once all configurations have been made, the user can start the Throughput test (press the Start icon on the top right section of the screen). The following are three scenarios of how to prepare and start the unit for Throughput testing. If testing on the fiber ports, make sure the LASER is turned On before starting the test. - Page 74 QoS values are based on packet statistic thresholds for roundtrip delay, jitter, frame loss, and IP checksum from the ITU-T Y.1541 standard. Below is a list of IP network QoS class definitions and network performance objectives from Y.1541. "U" denotes "unspecified" or "unbounded" and signifies that no objective was established for this parameter and default Y.1541 objectives do not apply.
- Page 75 Go back to top Go back to TOC The Aggregate screen displays these parameters: Line Rate (Mbps): Negotiated rate of the interface (10M, 100M, or 1000M). This value is always fixed since it depends on the maximum capacity of the link under test, hence the test interface that is configured. Utilization: % of Line Rate.
- Page 76 Loss of Signal (LOS) and the Saturation level for optical signals are shown graphically including the level measurement in dBm. Throughput Results - Global Signal (Page 1) Signal (Page 2) Page 2 displays the Optical module (transceivers) information which includes Vendor name, Part Number and Optical Wavelength. Tap on the Decode button to view additional information on SFP optics.
- Page 77 Go back to top Go back to TOC The Global Alarms screen displays the Current and Total alarm count of all streams: LOS: Loss of Signal LOSync: Loss synchronization Service disruption associated with loss of signal: Current: Duration of the current service disruption Total: Total accumulated duration of the service disruptions Min/Max: Minimum and maximum duration of the service disruption events No.
- Page 78 The Global Traffic screen displays: Frame Type of all streams Traffic Type of all streams Frame size of all streams Throughput Results - Global Traffic Summary Tap on the bar graph for frame and traffic distribution statistics. Frames tab: The following Frame distribution statistics are displayed in Count (#) and Percentage (%): Received (RX) frames: Total frames Test frames...
-
Page 79: Per Stream Results
Traffic Type tab: The following Traffic distribution statistics are displayed in Count (#) and Percentage (%): Layer 2/3 Unicast frames: Number of Unicast frames received without FCS errors. Layer 2/3 Broadcast frames: Number of Broadcast frames received without FCS errors. Broadcast frames have a MAC address equal to FF-FF-FF-FF-FF-FF. - Page 80 Go back to top Go back to TOC The Per Stream Errors screen displays the Current and Total error count of each stream. Bit: Indicates errors related to test pattern (Bit Error or LSS [Pattern Loss]) BER: Bit Error Ratio FCS/CRC: Number of received frames with an invalid Frame Check Sequence (FCS) IP Checksum: Invalid IP Frame Check sequence TCP/UDP Checksum (Layer 4 only)
- Page 81 Go back to top Go back to TOC Service Disruption Test (SDT) Total: Total cumulative service disruption for the duration of the test. Last: Last SDT measured during the test. Min/Max: Minimum and maximum SDT measured during the test. No. of Occurrences: Number of service disruption events (SDTs). No.
- Page 82 Go back to top Go back to TOC The Per Stream Traffic screen displays the frame type and frame size distribution pertaining to each stream. Throughput Results - Traffic per Stream The Per Stream Delay screen displays the frame delay information pertaining to each stream. The Histogram shows the sampling points for the delay.
- Page 83 Throughput Results - Round Trip Delay Histogram One Way Delay Results and Histogram (Table and Graph) Throughput Results - Delay per Stream (One Way Delay) Throughput Results - One Way Delay Histogram Graph Throughput Results - One Way Delay Histogram Table RXT-6400_Module_Manual Page 83 of 119...
- Page 84 Go back to top Go back to TOC The Per Stream Rate screen displays the frame rate and data rate pertaining to each stream. Tap on either dial to see rate details. Throughput Results - Rates per Stream Throughput Results - Rates per Stream (Rate Details) Go back to top Go back to TOC 5.6.2.4 Saving Throughput (Multiple Streams) Results Once the test has been stopped the results can be saved by pressing the Save key on the VePAL’s keypad.
- Page 85 saved and named automatically. Once the results are saved, the user may view or rename the results file by going to Utilities > Files > Saved. For more information on retrieving saved test results, refer to File Management in the TX300S, MTTplus, RXT- 1200, or UX400 platform manuals for more information.
-
Page 86: Autoscripting
5.7 Autoscripting Autoscripting runs BERT and Throughput test profiles in succession. Profiles are configured from the test application or ReVeal software. Autoscripting - BERT Setup Autoscripting Setup File Prefix: Prefix added to name of test results. The default prefix is "Autoscript." If Alarm/Error detected: Choose to Continue or Exit testing if an alarm/error is detected. - Page 87 File Manager - Saved Results Go back to top Go back to TOC RXT-6400_Module_Manual Page 87 of 119...
-
Page 88: Packet Capture
5.8 Packet Capture 5.8.1 Packet Capture Setup The packet capture function can be used to capture packets to Ethernet test ports. The packet capture format is compatible with Wireshark and can be viewed on a PC. Configure the following Capture Mode parameters: Profile: Drop-down selections are Default, Delete, Save, Save As... -
Page 89: Packet Capture Results
Select from the following Filter options: MAC and IP Mode Disable: All IP packets to and from the unit are captured MAC and IP: Only traffic frames matching the MAC and IP source and destination addresses are captured UDP and TCP: Only TCP, Only UDP or both TCP/UDP are captured Press the green Start button to begin packet capture. - Page 90 Destination Protocol Length Info Middle and Lower Sections: Frame details Ethernet frame details Go back to top Go back to TOC RXT-6400_Module_Manual Page 90 of 119...
-
Page 91: Lane Bert
6.0 Lane BERT The Lane BERT test is used for validating the physical interface of the optical module (QSFP28-DD, QSFP28, QSFP+, OSFP). It helps verify the performance and integrity of the optical module by checking bit error and BER per optical lane frequency offset measurement per lane. -
Page 92: Lane Bert Signal
Aggregate and per optical lane BER and bit error count are measured, as well as pattern loss in seconds. Go back to top Go back to TOC 6.1.2 Lane BERT Signal Signal (Page 1-2) The Signal tab (fiber ports only) displays the receiving (RX) and transmitting (TX) optical level measured by the QSFP28, QSFP-DD, QSFP+ or OSFP transceiver. - Page 93 The received signal frequency and offset is measured and preformed on the optical interface. Current: Indicates the frequency of the input signal. Offset: Indicates the difference between the standard rate and the rate of the input signal. Min (ppm): Indicates the difference between the standard rate and the minimum deviation detected in the input signal. Max (ppm): Indicates the difference between the standard rate and the maximum deviation detected in the input signal.
- Page 94 Go back to top Go back to TOC 6.1.3 Aggregate The Aggregate tab displays errors related to the test pattern (Bit Error or Pattern Loss). Aggregate Go back to top Go back to TOC 6.1.4 Lane The Lane tab displays Pattern Loss and Bit Errors for each lane. PCS Results - Alarms/Errors RXT-6400_Module_Manual Page 94 of 119...
- Page 95 Go back to top Go back to TOC 6.1.5 Events A time stamped record or log of anomalies, alarms, test status (start/stop) and test application are displayed. PCS Results - Events Go back to top Go back to TOC RXT-6400_Module_Manual Page 95 of 119...
-
Page 96: Fec
7.0 FEC (400G Only) 7.1 FEC Codeword Symbol Error Distribution Monitor Mode Results Verify/Monitor PAM4 Signal Integrity Codeword Symbol Error distribution PAM4 always has pre-FEC Errors Differentiate between Correctable and Uncorrectable Errors Identify how hard FEC is working Benchmark/Compare transceiver preformances Beyond 15 Symbol Errors per Codeword, the errors become Uncorrectable and start affecting the payload Zero post-FEC Errors Client/Test traffic payload must remain Error Free (no uncorrectable errors) -
Page 97: Results Summary
Go back to top Go back to TOC 7.1.2 FEC Results Summary Results Summary: Tap on the Results>Summary tab to view test results. FEC Results Summary Go back to top Go back to TOC 7.1.3 Alarms and Errors FEC Alarms/Errors RXT-6400_Module_Manual Page 97 of 119... - Page 98 FEC Results Alarms/Errors Lane Details FEC Results Alarms/Errors Corr. Symbol Details RXT-6400_Module_Manual Page 98 of 119...
-
Page 99: Skew
Go back to top Go back to TOC 7.1.4 Skew FEC Skew Go back to top Go back to TOC RXT-6400_Module_Manual Page 99 of 119... -
Page 100: Pcs
8.0 PCS (100G Port 1 Only) 8.1 PCS Setup 8.1.1 Tx Lane Mapping and Skew PCS to CAUI lanes configurable mapping: Defines the alignment markers ID that will be assigned to each lane Default, random or manual setting Receivers must be able to reorder and reassemble any mapping of PCS lanes into single stream Lane Skew generation (up to 16000 bits time) Enter relative delay that will be introduced for the PCS lane pair (CAUI lane) Stresses the de-skew function on the receiver side... -
Page 101: Results
Go back to top Go back to TOC 8.2 Results 8.2.1 Summary PCS Results Summary Go back to top Go back to TOC 8.2.2 RX Lane Skew PCS RX Lane Skew RXT-6400_Module_Manual Page 101 of 119... -
Page 102: Alarms And Errors
Go back to top Go back to TOC 8.2.3 Alarms and Errors PCS Results Alarms and Errors Go back to top Go back to TOC 8.2.4 Events PCS Results - Events RXT-6400_Module_Manual Page 102 of 119... -
Page 103: Saving Pcs Results
8.3 Saving PCS Results Once the test has been stopped the results can be saved by pressing the Save key on the platform's keypad. A window will open giving the option of naming the results file. Enter the desired name for the file and tap apply. The results will be saved. -
Page 104: Advanced Optical Transceiver Test & Stress Test
9.0 Advanced Optical Transceiver Test & Stress Test The Transceiver Stress Test and Advanced Optical Transceiver Test features perform a batch of PASS/FAIL tests to check the health and capabilities of high-speed transceivers. From checking optical signal power levels, Lane BERT (pre-FEC) performance, voltage and frequency swing tolerances, I2C/MDIO registers read/write, pre-emphasis manipulation, all the way to verifying error- free Ethernet Throughput. - Page 105 Stress Test Signal Tab (Page 1 ): Tap on the Signal tab to view Signal Level (RX) Stress Test Signal (Page 1) Stress Test Signal Tab (Page 2 ): Tap on the Signal tab to view Signal Level (TX) Stress Test Signal (Page 2) Stress Test Signal Tab (Page 3 ): Tap on the Signal tab to view Signal Frequency Stress Test Signal (Page 3) RXT-6400_Module_Manual...
- Page 106 Stress Test Signal Tab (Page 4 ): Tap on the Signal tab to view QSFP Optical Module Information Stress Test Signal (Page 4) Stress Test Signal Tab (Page 5 ): Tap on the Signal tab to view QSFP Optical Module Status Stress Test Signal (Page 5) RXT-6400_Module_Manual Page 106 of 119...
- Page 107 Pre-FEC BERT Aggregate Tab: Tap on the Pre-FEC BERT tab and tap Start. The test will show as running. Stress Test Pre-FEC BERT Aggregate Pre-FEC BERT Aggregate Pass: Once the test has finished the screen will show as Pass Stress Test Pre-FEC BERT Aggregate PASS RXT-6400_Module_Manual Page 107 of 119...
- Page 108 Pre-FEC BERT Lane Tab: Tap on the Pre-FEC BERT>Lane tab and tap Start. The test will show as running. Stress Test Pre-FEC BERT Lane Pre-FEC BERT Lane Pass: Once the test has finished the screen will show as Pass Stress Test Pre-FEC BERT Lane Pass RXT-6400_Module_Manual Page 108 of 119...
-
Page 109: Advanced Optical Transceiver Test
Go back to top Go back to TOC 9.2 Advanced Optical Transceiver Test To access the advanced optical transceiver test select OSFP or QSFP-DD port buttons, select Other Functions, then Advanced Optical Transceiver Testing. Setup: The left side of the screen contains all the configuration items. Tap on the different buttons to have access to general Setup, Voltage swing, Pre-FEC BERT, Frequency Offset, Pre-emphasys settings and I2C registers read/write access. - Page 110 Advanced Optical Transceiver Module Histogram Tab: Tap on the histogram tab, can be viewed in Table or Graph form. Advanced Optical Transceiver Histogram Graph Advanced Optical Transceiver Histogram Table RXT-6400_Module_Manual Page 110 of 119...
- Page 111 Voltage Tab: Advanced Optical Transceiver Voltage Pre-FEC BERT Tab: Advanced Optical Transceiver Pre-FEC BERT RXT-6400_Module_Manual Page 111 of 119...
- Page 112 Freq. Offset Tab: Advanced Optical Transceiver Freq. Offset Pre-Emphasis Tab: Tap on the Pre-Emphasis tab to view the TX Pre-equalization settings. To return to the previous screen tap on the red cross. Advanced Optical Transceiver Pre-Emphasis RXT-6400_Module_Manual Page 112 of 119...
- Page 113 I2C Tab: Tap on the I2C tab to view the I2C Access. To return to the previous screen tap on the red cross. Advanced Optical Transceiver I2C Read/Write Go back to top Go back to TOC RXT-6400_Module_Manual Page 113 of 119...
-
Page 114: Warranty And Software
Warranty Period that any Hardware does not conform to this Limited Warranty, Customer’s sole and exclusive remedy, and VeEX’s sole and exclusive liability, shall be for VeEX, at its sole option, to: (1) repair the Hardware at no charge, using new or refurbished replacement parts in accordance with VeEX’s Return Policy;... - Page 115 Limited Software Warranty Subject to the terms of VeEX’s End User License Agreement, VeEX warrants for a period of 90 days from the Start Date that: (i) the media on which the Software is delivered will be free of defects in material and workmanship under normal authorized use consistent with the Product instructions;...
- Page 116 (INCLUDING, WITHOUT LIMITATION, NEGLIGENCE), STRICT LIABILITY OR OTHERWISE, EXCEED THE AMOUNTS ACTUALLY PAID TO VEEX BY CUSTOMER FOR THE PRODUCT THAT IS THE SUBJECT OF SUCH CLAIM. THE FOREGOING LIMITATIONS SHALL APPLY EVEN IF THE ABOVE-STATED LIMITED WARRANTY FAILS OF ITS ESSENTIAL PURPOSE.
-
Page 117: Certification And Declarations
EU market will conform with (EU) 2015/863. VeEX Inc. is committed to comply with RoHS and WEEE Directives to minimize the environmental impact of our products. For more information about RoHS as it relates to VeEX Inc, go to the VeEX web site at www.veexinc.com/ROHS... - Page 118 Go back to top Go back to TOC RXT-6400_Module_Manual Page 118 of 119...
-
Page 119: About Veex
12.0 About VeEX VeEX Inc., the Verification EXperts, is an innovative designer and manufacturer of test and measurement solutions addressing numerous technologies. Global presence through a worldwide distribution channel provides uncompromised product support. Visit us Online at www.veexinc.com for latest updates and additional documentation.
Need help?
Do you have a question about the RXT-6400 and is the answer not in the manual?
Questions and answers