Table of Contents
Advertisement
Quick Links
Advertisement
Table of Contents

Related Manuals for WPA biochrom Biowave S2100


Summary of Contents for WPA biochrom Biowave S2100
- Page 1 Instructions for Biowave S2100 UV/Vis Diode Array Spectrophotometer Biochrom Ltd 22 Cambridge Science Park Milton Road Cambridge CB4 0FJ, UK Tel: +44 (0) 1223 423723 Fax: +44 (0) 1223 420164 Email: enquires@biochrom.co.uk Website: www.wpaltd.co.uk...
- Page 2 Declaration of Conformity Biochrom Ltd Certificate No. 890333 This is to certify that the WPA Lightwave S2100: 80-3000-73 manufactured by Biochrom Ltd. conform to the requirements of the following Directives-: 73/23/EEC & 89/336/EEC Standards to which conformity is declared EN 61 010-1: 2001 Safety requirements for electrical equipment for measurement, control and laboratory use.
-
Page 3: Table Of Contents
CONTENTS INTRODUCTION..................................... 4 CONDITIONS OF SERVICE ................................4 PRINCIPLE OF OPERATION ................................. 5 SPECIFICATIONS................................... 6 CONTROLS......................................8 CUVETTE CHAMBER ..................................9 INSTALLATION & START-UP..............................10 GENERAL OPERATIONS................................12 ................................... 12 EFERENCING (<0.050A)..........................12 EASUREMENT AT EVELS ....................................12 ILUTION ..........................13 ACKGROUND BSORBANCE ORRECTION... -
Page 4: Introduction
Introduction The Biowave is a diode array UV/Vis spectrophotometer that has been specifically designed for the Life Sciences and biotechnology market. Popular methods are pre-programmed into the instrument for ease of use. The Biowave spectrophotometer also offers: - • Instantaneous scanning •... -
Page 5: Principle Of Operation
Cuvette Holder CS003 For other problems please contact our sales office or local authorised dealer in your region. Health & Safety Notice Instruments will only be accepted for repair or re-calibration when accompanied by a signed letter or certificate from the sender to the effect that there is no hazard to health due to biological, chemical or radioactive contamination. -
Page 6: Specifications
4 Specifications Specification S2100 Biowave Optical arrangement Single beam, diode-array (512 pixel) using Rowland Circle optics with flat field corrected concave grating. Wavelength range 200 –820nm Spectral bandpass Resolution/Bandwidth Stray Light <0.1% at 220nm NAI and 340nm NaNO Wavelength Accuracy ±1.5nm Wavelength Better than ±0.6nm... - Page 7 Display 240 x 128 pixel dot matrix LCD Output RS232 to WPA printer for text and graphics RS232 ASCII for PC data logging Light sources Pulsed Deuterium and Tungsten halogen lamps giving life in excess of 15000 hours Sample compartment 40mm pathlength.
-
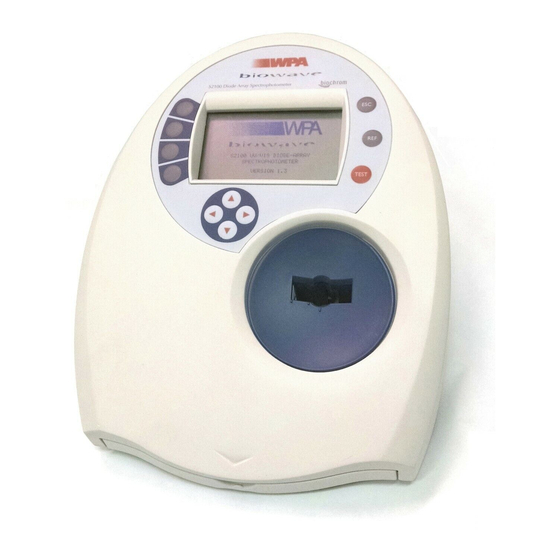
Page 8: Controls
5 Controls Escape key - takes the user back one step or aborts current operation Reference key - zeros instrument Test key - makes a Function measurement keys (1-4) across all - select wavelengths function identified in box. Cursor keys allow Symbols the user to indicate... -
Page 9: Cuvette Chamber
Cuvette Chamber The cuvette holder has been designed to accommodate a variety of cuvette sizes in an accurate and repeatable manner. 40 mm Cuvette Chamber Layout 10mm pathlength cuvettes should be placed here Note: It is important to align the square cuvettes to the far left-hand side of the chamber. -
Page 10: Installation & Start-Up
7 Installation & Start-up Unpack the Biowave spectrophotometer and ensure that you have received the following in good condition: - S2100 Biowave Spectrophotometer Power Lead Starter pack of 10 disposable UV cuvettes Dust cover Instruction manual Warranty Card Place the unit on a level surface, insert the mains cable in the rear socket and then connect to the electricity supply (90-250V 50/60Hz). - Page 11 Failure of one lamp will not affect the other lamp - so if the Deuterium lamp fails you can still make good visible measurements (380 to 825 nm). See section on Servicing & Maintenance Failure in Wavelength Calibration The wavelength calibration is performed by observing the key spectral data from the Deuterium lamp and ensuring that the peak remains in the correct position.
-
Page 12: General Operations
8 General Operations 8.1 Referencing When R is displayed in the bottom left hand corner of the display, it is possible to Reference the instrument by pressing REF. The reference across all wavelengths will be held in the memory until the unit is switched off, or re-referenced. -
Page 13: Background Absorbance Correction
The factor will be used as a multiplier for the value obtained. E.g. If the user has diluted a sample 1:9 sample/diluent, the factor used will 10.000. Concentration = 10.000 * Abs * Factor Where the factor relates to the specific method. 8.4 Background Absorbance Correction Some samples can be turbid and this can affect the readings obtained. -
Page 14: Software Operation
9 Software Operation After the spectrophotometer has performed the self diagnostics press the Cont. Function Key to proceed to the first menu screen. 9.1 Nucleic Acids This Function key displays the choice of Nucleic Acid methods pre- programmed into the instrument. Press the Function key for the desired sample type to bring up a further menu which allows the user to enter the assay conditions. - Page 15 The ratio readings give information about the purity of the sample. The A260/230 reading give a measure of phenol contamination following extraction . The A260/280 ratio measures protein contamination. 9.1.1.1 Programming The program button allows the units of concentration to be changed between µg/µl, µg/ml and pmol/ml and the background correction to be turned on and off using the appropriate arrow keys.
-
Page 16: Protein Methods
The Factor used in the calculations defaults to the values below:- 50.00 µg/ml dsDNA 37.00 µg/ml ssDNA 40.00 µg/ml 33.00 µg/ml Oligo These can be changed – see section 10.1 Protein Methods This gives the user the option of the pre-programmed methods of: •... - Page 17 9.2.1.1 Standard Calibration If the factor of the calibration graph is not known, the calibration graph can be constructed. “Standard” is chosen by using the ←→ keys and pressing Function Key 4 “Accept” On selecting set Standard, the number of replicates will then appear beneath. The calibration values can then be input.
- Page 18 Press Accept to confirm. Once all the standard values are correct press Function Key 4 “All OK”. The cursor then moves to the first Absorbance entry for Std 1. Absorbance values can be entered manually by pressing the Change button and using the cursor keys, as for the standards, or directly, by placing the appropriate standard in the cuvette chamber and pressing TEST (having first taken a valid reference).
- Page 19 2 point : y = a + bx 3 point : y = a + bx + cx INVALID CURVES Because the equation fits a curve exactly to the points, there is a chance that the resultant curve is not valid. If the curve selected contains points of inflection (where the slope changes sign eg maxima and minima) it would give rise to potentially more than one Concentration for a chosen Abs value.
-
Page 20: Direct Uv Absorbance Determination Of Proteins
9.2.2 Direct UV Absorbance determination of Proteins For a rapid, rough estimate of Protein Concentration the Direct UV method is ideal. The method is based upon the Christian Warburg Expression (see Appendix II) . Pressing Program allows units, factors and background absorbance (A status to be changed. -
Page 21: Cell Density Measurement
9.3 Cell Density Measurement The cell density function provided a convenient short cut to cell density measurements. As this is effectively a turbidimetric method, different instruments will tend to give different Absorbance values due to the scattering effect of particles in solution. This cell density function both sets the wavelength of measurement and also provides an auto-correction to bring readings closer to an experimentally established norm. -
Page 22: Other
9.4 Other The “Other” Function Key takes the user to a screen to perform standard spectrophotometric functions. λ 9.5 Single/Multi This function key takes the user to a further menu screen allowing the option of single or multi wavelength measurements. 9.5.1 Single measurement This mode should be used when readout in Absorbance or %Transmission is required for a single wavelength. -
Page 23: Multi Wavelength
You can toggle between Abs and %T by pressing Function Key 1. To avoid accidental changes to the wavelength setting the arrow keys only become functional when “Set λ” is pressed. Use the ↑↓ keys to change wavelength then press “Accept λ” to accept. -
Page 24: Scanning
9.6 Scanning The 512-pixel diode array captures readings from the complete wavelength range each time a measurement is made. The scan displaying this information can be viewed on the graphics display. Two cursors can be moved across the screen (using ←→) to identify the wavelength and reading at a particular point in the spectrum. -
Page 25: Other Methods
9.7 Other methods Up to 99 methods can be user programmed. These enable readout in concentration units, using linear or non-linear calibration curves. The facility for kinetic operation is also included. To select a method, move the cursor to the desired number using the Page up or Page down functions and the arrow keys and then click on “Accept”. - Page 26 Programming a method is simple. To change each selection you need to do the following:- • Position the cursor over the relevant line • Press CHANGE • Use arrow keys to amend the entry • Press ACCEPT to confirm The table below is a summary of the information that can be programmed into each method.
- Page 27 9.7.1.1 Changing Wavelength Use up/down arrows to change the wavelength. Note: The wavelength changes slowly at first and then more quickly dependent upon how long the button is pressed. 9.7.1.2 Calibration 9.7.1.2.1 Standard Calibration If the factor of the calibration graph is not known, the calibration graph can be constructed.
- Page 28 Press Accept to confirm. Once all the standard values are correct, press Function Key 4 “All OK”. The cursor then moves to the first Absorbance entry for Std 1. Absorbance values can be entered manually by pressing the Change button and using the cursor keys as for the standards, or directly, by placing the appropriate standard in the cuvette chamber and pressing TEST (having first taken a valid reference).
- Page 29 INVALID CURVES Because the equation fits a curve exactly to the points, there is a chance that the resultant curve is not valid. If the curve selected contains points of inflection (where the slope changes sign, e.g. maxima and minima) it would give rise to potentially more than one Concentration for a chosen Abs value.
- Page 30 9.7.1.4 Kinetics The kinetics facility allows the user to run a series of measurements at programmed intervals. To program a method to include multiple measurements select:- Selecting “Yes” presents the user with some additional options:- Start Time This is the delay before the first measurement is made. Interval This is the interval between measurements.
-
Page 31: Run A Method
To program the time, place the cursor over the desired selection and press Function Key 4 to change. Use the arrow keys to move between digits and to increase or decrease the value. The interval time is restricted to values above 10 seconds. The maximum period is 59m 59s after completion of the START time. - Page 32 9.7.2.1 Kinetics Run During the kinetics run the screen will initially show the Start Time less time elapsed. Once this reached zero, the first measurement will be taken, followed by more measurements at each selected interval until the End time is reached. Each measurement is displayed on the screen in turn.
-
Page 33: Instrument Set-Up
10 Instrument Set-up 10.1 Set Constants This function changes the factors that are used in the Nucleic Acid calculations. The default factors are initially displayed: Choose the factor to be changed using the ↑↓ keys. Press change. The numeric value is changed using the ↑↓ keys. To move between the figures use the ←→... -
Page 34: Communications
10.2 Communications The Biowave has a bi-directional RS232 port that can be used to connect to a PC or 40-column printer. The communication settings are the same for PC and Printer, but have a different format. They are accessed from the “Set up instrument” then “Communications”... -
Page 35: Set Time/Date
10.3 Set Time/Date The time and date are available in the following formats: - Euro Format Time hh:mm (24 hour clock) Date dd/mm/yy US Format Time hh:mm (24 hour clock) Date mm/dd/yy Click on “Format” to toggle between the two formats. These are retained even if the unit is switched off. -
Page 36: Printing
RTS/CTS Wire in DTR line to the CTS feed from Biowave The WPA S2000P printer from WPA meets all the above specifications. To avoid any possible damage, ensure that both printer and spectrophotometer are switched off prior to connection. There are 2 different print formats dependent upon which mode of operation has been selected. -
Page 37: Connection To Pc
Before either can be used, the correct connection must be established. 12.1 Setting Up the Biowave to a PC Link First connect the Biowave and the PC using a suitable cable, such as WPA part number S2000PC. Connections to the most common PC COM ports are shown in the Table below, together with the necessary connectors. -
Page 38: Servicing And Maintenance
The lamp alignment is also crucial to the correct operation and we cannot guarantee performance to the published specification if lamps other than those from WPA are used. The part numbers for replacement lamps are as follows: - Tungsten Lamp S2000T Tungsten &... -
Page 39: Routine Maintenance
13.4 Calibration WPA can provide a service and calibration for your instrument including the provision of a certificate traceable to international standards. Please contact our sales office for further details. -
Page 40: Ce Marking
Please return the instrument either to WPA or to your local distributor. Whenever an instrument is returned, please ensure that a label indicating your name, address, telephone and extension number is securely attached to... -
Page 41: Health & Safety Certificate And Declaration Of Decontamination Status
Before an instrument can be accepted for repair, service or return to stock this form must be completed and returned to WPA showing that no hazard to health exists to WPA due to Physical, Chemical, Biological or Radioactive contamination of the unit. -
Page 42: Appendix 1 - Calculations
Appendix 1 – Calculations Nucleic Acids dsDNA Results for dsDNA µg/mL = Factor * A * Dil Factor Results for dsDNA µg/µL = Factor * A * Dil Factor Results for dsDNA pmol/mL = (Factor*1000/No base pairs * 2 * 330) * A Dil Factor The default value for the Factor is 50 for µg/ml and 0.050 for µg/µL The size is measured in No of Base Pairs (kB) -
Page 43: Protein Uv Absorbance Method
The concentration of Oligonucleotides has been based upon an estimate of the Molar Extinction Coefficient according to the following formula:- ε ≅ 10000 * (1.5A+0.71C+1.2G+0.84G) Where the values for A,C,G,T are number of bases. )/ ε Concentration in pmol/ml = (A * 10 Protein UV Absorbance method Results for mg/ml = 1.55 * A... -
Page 44: Appendix 2 -Connecting To Hyperterminal And Downloading Results
ppendix 2 -Connecting to HyperTerminal and downloading results Windows 95 or 98 (or NT users) Open HyperTerminal program under Program Manager “Accessories”. Double Click on icon “Hypertrm” You will be asked for a suitable name - e.g Biowave and an icon. Once this is set up you can click on this icon and the settings will be loaded correctly. - Page 45 Select the correct COM port (which will be used to receive the Biowave data) under “Connect Using” and then OK. Now set up the COM port: -...
- Page 46 Set the settings as above then press OK. To capture data, select Transfer - Capture Text. You will be asked for a file name - e.g. Biowave.txt. Then Press START. Pressing PRINT on the S2100 will send data to the PC (ensure that PC is selected under Communication).
- Page 47 Importing Into Excel (or similar spreadsheet program) Open Excel™ and open the data file (*.txt); the following screen will be displayed:- Choose Delimited (if not already chosen) and press NEXT. Select comma, then NEXT...
- Page 48 To create a graph of the data (if scan data) use the graph facility in Excel. You will need to re-arrange the columns (wavelength first, Absorbance (or %T) second). WPA has set up an Excel file (sample.xls) to import the data and display Spectra. This can be obtained from our sales office and e-mailed to you or put onto a disc.
- Page 49 The PC format is designed to be compatible with most Windows spreadsheet software including LOTUS 123™ and MS EXCEL™. Windows 3.11 Open the Terminal emulator and under the “Settings” menu, run down to “Communications” and set the following parameters. COM1/COM2 Depending on which port you are using.
- Page 50 Format 3 Dd,mm,yy,hh,min, method no, name, sample number or ref, elapsed time in mm/ss, value, repeat for other values , delta A/min, correlation coefficient, display, units Format 4 dd,mm,yy,hh,mm,sample no or ref, value, units, wavelength, value, units, wavelength, value, units, wavelength , value, units, wavelength Format 5 dd,mm,yy,hh,mm,method no, name, Std,value,Abs, Std,value,Abs, Std,value,Abs, etc...
Need help?
Do you have a question about the biochrom Biowave S2100 and is the answer not in the manual?
Questions and answers