
Related Manuals for WPA LIGHTWAVE II


Summary of Contents for WPA LIGHTWAVE II
- Page 1 LIGHTWAVE II & LIGHTWAVE II USER MANUAL Biochrom Ltd Tel: +44 (0)1223 423723 22 Cambridge Science Park Fax: +44 (0)1223 420164 Cambridge support@biochrom.co.uk CB4 0FJ England www.biochrom.co.uk...
- Page 2 Biochrom Ltd Certificate No. 890333 Declaration of Conformity This is to certify that the Lightwave II and Lightwave II UV/Visible Spectrophotometers part numbers: 80-3003-72 / -73 / -74 & 80-3004-60 / -61 / -62 manufactured by Biochrom Ltd. conform to the requirements of the following Directives-: 73/23/EEC &...
-
Page 3: Table Of Contents
TABLE OF CONTENTS ESSENTIAL SAFETY NOTES ............................ 4 Unpacking, Positioning and Installation ....................4 INTRODUCTION................................5 Your spectrophotometer ..........................5 Sample handling tips ............................ 5 Keypad and display ............................6 Software style..............................7 THE APPLICATIONS FOLDER ..........................8 1: Single Wavelength – Abs and %T ......................9 2: Concentration............................ -
Page 4: Essential Safety Notes
ESSENTIAL SAFETY NOTES There are a number of warning labels and symbols on your instrument. These are there to inform you where potential danger exists or particular caution is required. Before commencing installation, please take time to familiarise yourself with these symbols and their meaning. Caution (refer to accompanying documents). -
Page 5: Introduction
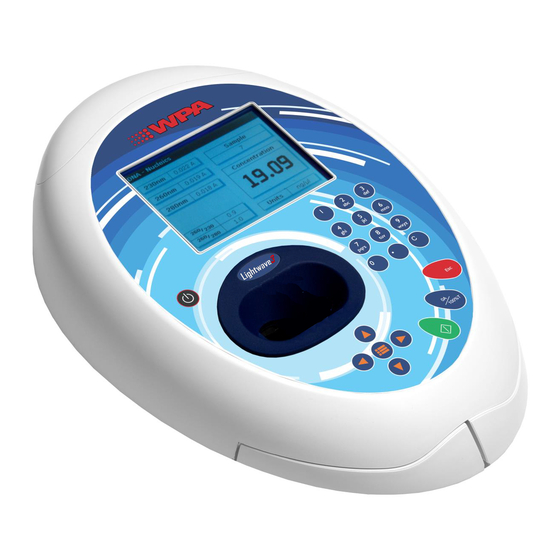
Your spectrophotometer Your spectrophotometer is a simple-to-use UV/Visible instrument with a CCD array detector (1024 pixels). It has no moving parts, which is the basis of the rapid scanning operating system. The look and operation of the Lightwave II and II are identical;... -
Page 6: Keypad And Display
Keypad and display The back-lit liquid crystal display is very easy to navigate around using the alphanumeric entry and navigation arrow keys on the hard wearing, spill proof membrane keypad. On/off key Alphanumeric keys Arrow keys Escape/Cancel Set reference View options Enter selection/take measurement Action On/off key... -
Page 7: Software Style
Options (select using key pad numbers) View parameters for the experiments. Print the results. 3,4,5,6 Described in the application. Define the sample number you wish to start from. Save the parameters as a method to a defined folder name with a defined method name. Toggle auto-print on/off. -
Page 8: The Applications Folder
THE APPLICATIONS FOLDER SUMMARY: Function Key pad number Description Absorbance or %T (transmission) at a single user defined wavelength. Concentration measurement at a single wavelength based on a simple Factor entered or calculated from a single standard. Wavelength scan between two user defined wavelengths. Range 200-950 nm, with user configurable peak finding function. -
Page 9: 1: Single Wavelength - Abs And %T
1: Single Wavelength – Abs and %T This makes simple absorbance (A) and % transmission (%T) measurements on samples, measuring the amount of light that has passed through a sample relative to a reference (this can be air). The procedure is as follows: Step 1 Set wavelength by using keypad numbers or left and right arrows. - Page 10 Options (select using key pad numbers) 1. Return to parameters screen (step 1 above). 2. Print result via selected method. 3. Toggle between Absorbance and %T mode. 4. Print graph – greyed out if no data are available. 7. Sample number – add a prefix to the sample number and reset the incrementing number to the desired value.
-
Page 11: 2: Concentration
2: Concentration This makes simple concentration measurements on samples, by measuring the amount of light that has passed through a sample relative to a reference (this can be air). Concentration is obtained by multiplying the measured absorbance at a specific wavelength by a factor. The factor may be known in advance, or may be calculated by the instrument by measuring a standard of known concentration. - Page 12 Step 6 (if using standard mode) Insert the reference. Press 0A/100% key. This will be used for all subsequent samples until changed. Press to display the Run Standard screen. Run the standard by pressing Press cancel to return to the measure screen. Step 7 Insert the sample and press The concentration of the sample is displayed.
-
Page 13: 3: Wavescan
3: Wavescan An absorption spectrum can be obtained from your instrument, enabling simple identification of peak height and position. The procedure is as follows: Step 1 Set start wavelength by using keypad numbers or left and right arrows. Press the down arrow key. Step 2 Set end wavelength by using keypad numbers or left and right arrows. - Page 14 Options (select using key pad numbers) 1. Return to parameters screen (step 1 above). 2. Print result via selected method. 3. Toggle between Absorbance and %T mode. 4. Displays Peak Detection Parameter Screen. See description below. 5. Manually adds a peak position to the peak table in the results screen at the position set by the cursor.
- Page 15 Add Peak... (Shortcut button 5) Adds a used defined peak at the current cursor position. The entry is then display in inverse colouring to discriminate between user defined peaks and auto-detect peaks. When the cursor is positioned over the user defined peak a legend “User Defined Peak”...
-
Page 16: 4: Simple Kinetics
4: Simple Kinetics Kinetics studies, where the change in absorbance needs to be followed as a function of time at a fixed wavelength, can be readily performed. Reagent test kits are routinely used for the enzymatic determination of compounds in food, beverage and clinical laboratories by measuring NAD / NADH conversion at 340 nm. - Page 17 Step 7 Units: The user can enter a text string up to 8 characters long. To access a list of pre-defined units press the Options key and then use the left/right arrows (µg/ml, µg/µl, pmol/µl, mg/dl, mmol/l, µmol/l, g/l, mg/l, µg/l, U/l, %, ppm, ppb, conc or none). These units can also be edited once OK is pressed.
- Page 18 Options (select using key pad numbers) 1. Return to parameter 1 screen (step 1 above). 2. Print data on the results screen via selected method. 3. Print all the data. 4. Set the t position (starting point for the slope and dA calculation) at the current cursor position.
-
Page 19: 5: Standard Curve
5: Standard Curve The construction of a multi-point calibration curve from standards of known concentration to quantify unknown samples is a fundamental use of a spectrophotometer; this instrument has the advantage of being able to store this curve as a method, using up to 9 standards. To include a zero concentration standard, include this in the number of standards to be entered and enter 0.00 for concentration;... - Page 20 Standards screen Step 8 Enter the concentration values by using the keypad numbers and the up and down arrows to move between the different standard boxes. Range 0.001 to 9999. Step 9 Press Next to enter the Calibration screen. If any duplicate or non-monotonic (increasing entries) are present the unit will beep and highlight the incorrect entry Press Back...
- Page 21 Calibration Screen (replicates on) This shows the calibration values and allows standards to be measured. Step 10 Insert the reference. Press 0A/100% key. This will be used for all subsequent samples until changed. Step 11 Press to display the replicate entry boxes. Use C to clear previously stored results before measuring.
- Page 22 Options (select using key pad numbers) 1. Return to parameters screen (step 1 above). 2. Print result via selected method. 3. Toggle graph on/off. Displays calibration graph, cursors give values for last measured sample. 7. Sample number – add a prefix to the sample number and reset the incrementing number to the desired value.
-
Page 23: 6: Multiple Wavelength
6: Multiple Wavelength This makes up to 5 absorbance measurements on the same sample. The procedure is as follows: Step 1 Select the number of wavelengths. Press the down arrow. Step 2 Enter the first wavelength using either the number keys or the left and right arrows. -
Page 24: 7: Absorbance Ratio
7: Absorbance Ratio This makes simple absorbance ratio measurements on samples, measuring the amount of light that has passed through a sample relative to a blank (this can be air) at two wavelengths. The procedure is as follows: Step 1 Enter the first wavelength by using the keypad numbers or the left and right arrows. - Page 25 Results Screen Step 10 Insert the reference. Press 0A/100% key. This will be used for all subsequent samples until changed. Step 11 Insert sample and press Repeat step 11 for all samples. The absorbance at selected wavelengths is measured and the ratio between wavelengths 1 and 2 is calculated (both corrected by the background wavelength value if this was selected).
-
Page 26: Favourites And Methods Folders
FAVOURITES AND METHODS FOLDERS These folders are the storage locations for any user modified Applications (Methods) that are saved in the Options menu. Both are accessible from the home folders page. Favourites: This folder enables the user to quickly select any frequently used Methods. Up to 9 Methods may be stored in the folder. -
Page 27: Utilities Folder
UTILITIES FOLDER Summary Function Keypad number Description Set correct time and date Select preferred language and number format Printer/output options Select screen layout (themes) and history Adjust screen contrast & brightness Re-name folders Serial number and software version Spectro Blocks/Sudoku Version 2.3 Page 27... -
Page 28: Utilities
Utilities 1: Date and Time The procedure is as follows: Enter the day using the keypad numbers or left and right arrows. Press the down arrow. Enter the month as above. Press the down arrow. Enter the year. Press the down arrow. Enter the hour. -
Page 29: 4: Preferences
4: Preferences Sets user preferences The procedure is as follows: Select games function. This determines whether the games folder is displayed or not. Options are yes or no. Press the down arrow. Define the screen layout of folders. Options are either a grid format (default) or a list. -
Page 30: 7: About
7: About Displays the instrument serial number and software version. Press OK to close the window and return to the Utilities folder 8: Games 1: Spectroblocks Classic block dropping game. Follow the instructions! Press Cancel to return to the Utilities folder without storing the settings. Version 2.3 Page 30... - Page 31 2: Su Doku Can be set up as Computer mode (50 preset games) or User mode (enter your own pattern) Use the cursors to select the square and the key pad to enter a number. Invalid numbers cannot be entered. Cells can be locked (or unlocked) by using the decimal point.
-
Page 32: Accessories Installation
ACCESSORIES INSTALLATION Printer installation 1. REMOVE THE POWER CABLE FROM THE INSTRUMENT. Turn the instrument over and remove cap head screws from positions A and B using the Allen key provided. 2. Turn the instrument back over and lift the accessory cover vertically upwards to remove. - Page 33 Switch the instrument on and go to utilities/instrument/preferences and select the Built- in printer. Version 2.3 Page 33 Accessories and Maintenance...
-
Page 34: Loading / Changing The Printer Paper
Loading / changing the printer paper 1. Lift off the paper cover. Lock the platen and turn the knob to feed the paper 2. Feed in the paper. Sometimes it helps if the platen lock is released. 3. Paper gripped. 4. -
Page 35: Bluetooth Accessory Installation
Bluetooth accessory installation 1. REMOVE THE POWER CABLE FROM THE INSTRUMENT. Turn the instrument over and remove the cap head screws from positions A and B using the Allen key provided. 2. Turn the instrument back over and lift the accessory cover vertically upwards to remove. - Page 36 Note the slots in the accessory cover, designed to engage with the Bluetooth accessory PCB 6. Lower the accessory cover vertically downwards onto the instrument, engaging the PCB in the slots. 7. Invert the instrument and replace the cap head screws at A and B.
-
Page 37: Print Via Computer
PVC (Print Via Computer) is a small application running under Windows 2000™ or Windows XP™ to enable a Biowave II or Lightwave II to transfer data into a PC environment. From there the user has a selection of choices, the data can be both printed or saved (in a variety of formats). PVC is capable of supporting several instruments simultaneously, limited only by hardware and the speed of the host system. -
Page 38: Accessories
ACCESSORIES USB cable source locally Built-in printer accessory 80-3003-84 Bluetooth accessory 80-3003-96 MAINTENANCE After Sales Support Support agreements that help you to fulfil the demands of regulatory guidelines concerning GLP/GMP are available. • Calibration, certification using filters traceable to international standards •... -
Page 39: Specification And Warranty
SPECIFICATION AND WARRANTY Wavelength range 190 - 1100 nm Monochromator Flat grating Wavelength calibration Automatic upon switch on Spectral bandwidth 5 nm (3nm Lightwave II ± 2 nm Wavelength accuracy Wavelength reproducibility ± 1 nm Light sources Pulsed xenon lamp Detector...
Need help?
Do you have a question about the LIGHTWAVE II and is the answer not in the manual?
Questions and answers