Table of Contents

Related Manuals for Summit Technology PowerSight PS5000

Summary of Contents for Summit Technology PowerSight PS5000
- Page 1 User’s Manual PowerSight PS5000 Summit Technology, Inc. 2246 Monument Blvd Pleasant Hill, CA 94523 Tel: 1-925-944-1212 support@powersight.com www.powersight.com Rev for FW 8.08 / SW 4.22 Copyright 2022 by Summit Technology...
- Page 2 IEC61010-1:2001 for a 1000V input rating measurement category III, pollution degree II, double insulated electronic device. Model PS5000 is manufactured by Summit Technology, Inc in the U.S.A. The standard warranty period is 12 months from date of purchase. We encourage you to advise us of any defects of design or manufacture of any of our products.
-
Page 3: Table Of Contents
Table of Contents Introducing PowerSight ............. 8 Connecting to PowerSight ............9 Voltage Test Leads ..................9 Current Probes ..................10 Connections to PowerSight ..............12 Introduction to Power Delivery Configurations ........ 14 Connecting to Single-phase Power ............16 Connecting to 120 V Outlet Adapter Box ..........17 Connecting to Multiple Single-phase Loads ........ - Page 4 Measurement Types ..............52 Voltage Measurements ................52 Voltage Measurements in PowerSight ..........54 Voltage Measurements in PSM-A............55 Current Measurements ................56 Current Measurements in PowerSight ..........58 Current Measurements in PSM-A............59 Imbalance Measurements ............... 60 Imbalance Measurements in PSM-A ............ 61 Power Measurements ................
- Page 5 Changing the Power Measurement Mode in PowerSight ....90 Changing the Power Measurement Mode in PSM-A ......91 Defining Input Ratios ................91 Changing Input Ratios in PowerSight ..........93 Changing Input Ratios in PSM-A ............93 Voltage & Current Waveforms ..........94 Introduction ....................
- Page 6 Introduction ....................134 Generating a Report ................134 Viewing a Report ..................137 TestPlan Manager in PSM-A ..........139 What is TestPlan Manager ..............139 How Does it Work? ................. 139 Opening an Existing TestPlan in PSM-A ........... 140 Create a New TestPlan in PSM-A ............141 Using TestPlan Manager with Powersight ........
-
Page 8: Introducing Powersight
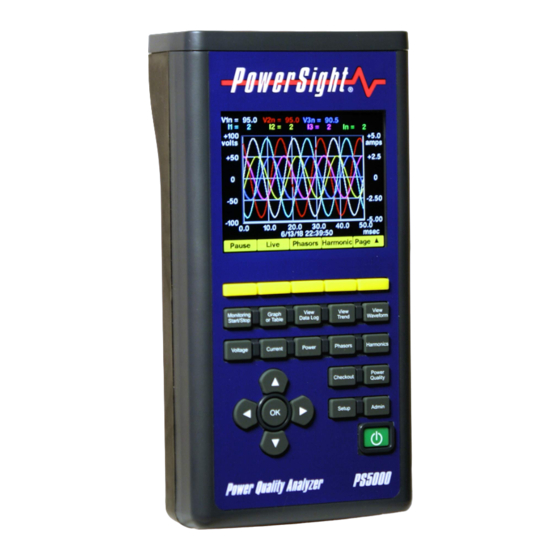
Introducing PowerSight The PS5000 is the premier member of the PowerSight line of compact, versatile, easy-to-use power quality analyzers. It provides the most Efficient and Error Free solution for your power study needs. New with PS5000: 3.5 inch Graphics Display ... -
Page 9: Connecting To Powersight
Connecting to PowerSight Voltage Test Leads A Deluxe Voltage Probe set consisting of four leads is included with each PowerSight. Each of the voltage test leads is 6 feet (2 meters) long, with safety banana jacks at one end and safety plunger clamps at the other end. -
Page 10: Current Probes
Summit Technology also sells a fused voltage lead set (order DFV). The safety advantage of fused leads is that if a short occurs through the insulation of a lead to ground, the fuse in the handle should quickly blow out, preventing the lead from vaporizing in an explosion of molten metal. - Page 11 The HA5 offers two advantages over the HA1000, but these advantages come at a cost. Its advantages are that the HA5 is a very small size (5.25 2.00 1.35 inches) and second, it offers much greater sensitivity since it reads currents from 20 milliamps to 5 amps (as compared to the HA1000 measuring 1 - 1,000 amps).
-
Page 12: Connections To Powersight
You must use added caution when connecting an FX series current probe around exposed conductors and bus bars since you must pull the tube around the conductor and thus get your hands and arms closer to it than when using HA series clamp-on type current probes. - Page 13 Current probes plug into the top end of PowerSight, just above the voltage inputs. Each current probe is labeled (I , or I ) and each jack is similarly labeled (I , or I ). When plugging a current probe into PowerSight, the flat side of the plug should be facing upwards so the label is readable.
-
Page 14: Introduction To Power Delivery Configurations
120V, 240V, 480V, 600V, 4160V, or 12,500V. In most of the world, phase-to-phase service is usually supplied as 381V, 5,716V, or 11,431V. Summit Technology has voltage probes for direct connect to all of these services. Refer to... - Page 15 figure 7 for how to connect to a delta power service. When there is no access to measuring one of the currents, figure 8 presents the 2 current approach for measuring power. This approach is also useful for measurement of an open delta circuit as described in Connections to an Open Delta Circuit (2PT/3CT)figure Although phase-to-phase is the normal voltage measurement...
-
Page 16: Connecting To Single-Phase Power
Connecting to Single-phase Power Figure 2 presents the basic connections to a single-phase system. sure to follow the safety warnings of the previous sections before making the connections. Clamp your phase 1 current probe onto the "Hot" wire. Make a metallic connection to neutral with the V voltage lead. -
Page 17: Connecting To 120 V Outlet Adapter Box
connections to PowerSight are as shown in figure 2, V will be some relatively large number like 120 volts and V will be a small voltage like 3 volts. If you then reverse the ground and neutral leads, V will now read slightly less, like 117 volts. If "hot" and "neutral"... -
Page 18: Connecting To Multiple Single-Phase Loads
Note: The 120ADPa is rated for continuous duty of up to 15 Arms. Do not exceed this continuous load. To evaluate the power usage of an appliance, simply plug the appliance into the top of the 120 V Outlet Adapter Box after the other connections have been made and verified. -
Page 19: Connecting To Split-Phase (Two Phase) Power
In this configuration, the voltage, current, and power of each load can be displayed directly or graphed on your PC using our PSM-A software. Connecting to Split-Phase (Two Phase) Power Fig 5 shows the recommended connections to a split-phase system as found in commercial and residential facilities, when measuring the supply to two single phase... -
Page 20: Connecting To Three-Phase Four-Wire (Wye) Power
change the measurement mode to phase-phase, V will be the hot-to-hot voltage that serves the high-power appliance. Connecting to Three-Phase Four-Wire (Wye) Power Figure 6 presents the recommended connections to a three-phase system with voltages referenced to neutral, a "phase-neutral" or “three-phase four-wire wye”... -
Page 21: Connecting To Three-Phase Three-Wire (Delta) Power
Connecting to Three-Phase Three-Wire (Delta) Power Figure 7 presents the recommended connections to a three-phase system with voltages referenced to each other instead of to neutral. This is a "delta", "phase- phase", or “three- phase three-wire” configuration. Be sure to follow the safety warnings of the previous... -
Page 22: Connecting To Three-Phase Four-Wire Delta Power
A variation of delta is “four-wire” (or “center-tapped”) delta (see figure 1D). In this configuration, if the main interest is in measuring phase-neutral voltage, then connect the neutral voltage to the neutral input for more accurate voltage readings Connecting to Three-Phase Four-Wire Delta Power Figure 6 presents the recommended connections to a three-phase delta system where a neutral is provided from the center of one of the phases. -
Page 23: Connections Using 2 Current Approach
Connections Using 2 Current Approach In the previous sections, the approach used to measure power has been based on determining the power of each phase and then summing them to get the total power. The 2 current approach (figure 8) allows you to determine the total power from... -
Page 24: Connections To A 3 Ct / 3 Pt Metering Circuit
this approach because he can save the cost of one current probe when buying a system in order to measure total power. Another motivation occurs in situations where one of the phases cannot be measured due to accessibility. This approach is also called the “2 wattmeter approach” because it mimics how two single-phase wattmeters can be used to measure total three-phase power. - Page 25 the voltage delivered to the load exceeds the 1000Vrms rating of PowerSight and you do not have other high voltage probes. A typical metering circuit showing PowerSight connected is shown in figure 9. This circuit has three CTs and, if higher voltage is present, may...
- Page 26 5 amp range. The HA5 is best for this. The HA1000 or HA100 may be acceptable, depending on the current level. Once the current probes are attached, it is best to set the input ratios for each of the current probes (see the Setting Input Ratios section).
-
Page 27: Connections To A 2 Ct / 2 Pt Metering Circuit
Connections to a 2 CT / 2 PT Metering Circuit Figure 10 shows recommended connections to a metering circuit with only 2 CTs or 2 PTs. This type of metering circuit may be preferable when cost is an issue (less instrument transformers are used) or when metering a delta... -
Page 28: Connecting To Line-To-Dc (Ldc) Converter Accessory
Connections to a 2CT / 2PT Metering Circuit section. For current connections, connect the phase 1 and phase 3 probes as shown in figure 10 and attach the phase 2 current probe to the phase 2 CT. You will not need to operate in the 2 Current Probe mode of power measurement since there are 3 currents being monitored. - Page 29 The LDC also comes with in- line fuse assemblies plugged into the stackable plugs. These red assemblies contain 1000V fuses. They provide protection if a short should occur in the LDC. The two voltage leads that would normally be plugged into PowerSight are plugged into the loose...
-
Page 30: Measuring Multiple Parallel Conductors
red charging indicator near the jack will light up if everything is operating and connected properly. Note: If a fuse is burned out or missing, it will appear that there is no voltage at the source. Verify that the fuses are working properly before assuming that the source is dead. - Page 31 2. Start monitoring for 10 seconds or so and then stop monitoring (see the Starting Data Logging Stopping Data Logging sections). 3. Press the [Current] key and then the [More] key four times to view the average current for phase 1 (which is actually just one of the conductors of one of the phases).
-
Page 32: Measuring Currents Below The Range Of The Current Probe
Measuring Currents Below the Range of the Current Probe A problem with measuring smaller currents arises when the current to be measured is below the range of the current probe. In such cases, the current may not be read or the reading may be inaccurate. -
Page 33: Turning Powersight On
Turning PowerSight On Connecting to Power Although PowerSight comes with Li-ion rechargeable batteries, those batteries are intended to keep PowerSight functioning during limited power failures and to allow quick measurements without the bother of always having to find a 120 Vrms source. When fully charged, the batteries can power the unit for up to 12 hours. -
Page 34: Turning Powersight On
(or when PowerSight is connected to the LDC4 or LDCm accessory). The internal batteries are not to be replaced by the user. Only batteries provided by Summit Technology are to be used in PowerSight. Turning PowerSight On... -
Page 35: Communicating With Powersight
Communicating with PowerSight Introduction The PS5000 uses Bluetooth wireless communications and USB to communicate with your PC. USB has been added for ease of use and quickly connecting to the PowerSight without the needing to pair to a PC. Although USB maybe easier, Bluetooth add a method that is safer. -
Page 36: Connecting Via Bluetooth (Windows 7/8/10/11)
See the “Getting Started Manual for Bluetooth Meters” Manual for a more detailed look on installing Bluetooth adapters, installing the PSM-A software and other information on getting the meter communicating with your computer. (Windows 7/8/10/11) Connecting Via Bluetooth With Windows 7/8/10/11, you will have to find the small Bluetooth icon that shows up at the bottom right of your computer or go to the Devices screen by navigating to: Control Panel\Hardware and Sound\Devices and Printers. - Page 37 2. Press the + button to add a Bluetooth device. 3. Select “Bluetooth” in the Add a Device Window 4. Double click on the meter you want to connect to 5. Either enter the Pairing code of “0000” or if asked if the PIN matches the meter, just press Connect.
- Page 38 6. Once windows finishes, go back to the Bluetooth & other devices window and you should see your meter. On the right of the page (or at the bottom on some computers” find the blue link that says “more Bluetooth Options” and click on it.
-
Page 39: Connecting Via Usb Cable (Windows 7/8/10/11)
8. Open up PSM-A and click on the “Click to Connect” button at the top middle of the screen. 9. Change the Serial Port to the one assigned by Bluetooth and press “Connect”. (Windows 7/8/10/11) Connecting Via USB cable To connect Via the USB port at the bottom of the PS5000 meter, you will need a USB cable that is capable of transferring Data (not the charge-only type cables). -
Page 40: Using Removable Memory Cards
Using Removable Memory Cards Introduction Your meter has adequate internal memory storage for most normal operating situations. However, the ability to use a removable memory card has several significant advantages: extra storage for very long monitoring sessions faster transfer of data from meter to computer ... -
Page 41: Downloading Data Via Memory Card
Generally, any SD memory card that is from 64 MB through 32 GB in size will work in the meter. If it does not, the meter will display “Incompatible Format”. The meter will not write over existing files and pictures on the memory card, so memory cards from cameras etc can be used when needed. - Page 42 4. Click on the folder with your meter’s serial number, you should then see 1 or more folders named by time & date in the format of “YrMoDy_HrMnSc”. These names are based on when the data inside was first started/created. For example, if your data log started on 10/13/2021 at 2:01:25 pm, you would have a folder with the name;...
-
Page 43: Verifying Connections Using Powersight (Surestart Tm )
Verifying Connections Using PowerSight (SureStart Importance of Verifying Connections and Wiring After connecting to power, it is wise to check that everything is connected correctly and that the wiring of the facility is correct. There are two primary methods for doing this. You may either send waveforms from PowerSight to your PC and visually check that all connections are correct and all signal levels and shapes appear correct (see the... - Page 44 SureStart is a patented technology developed by Summit Technology that does a better job of identifying connection and setup problems than you can expect an expert to do. To use the...
-
Page 45: Identifying The Power System
results. Alternatively, you can use your PC to visually checkout if all connections are accurate. To do this, refer to the section on “Verifying Connections using PSM-A”. The SureStart feature briefly reports its findings in four groups of information. These are: ... -
Page 46: Error Summary
the [Setup] key to do so or use PSM-A to change the data logging setup. The bottom line of the display tells the specific voltage type of the general system that has been detected. For instance, a typical display is “277 / 480 V (p-n, p-p)”. This means the nominal voltages present are 277 Vrms phase-neutral and 480 Vrms phase-phase. - Page 47 reasonable, PowerSight assumes that they are connected to the correct phases. Thus, if the voltages are rotated to the right one position, but the current probes are connected correctly, PowerSight will report that the current probes are rotated left one position. Although assuming that the voltage connections are not rotated identifies the phases incorrectly, the total power will be correct and the individual...
- Page 48 the cable properly or that it is not fully seated into its jack within PowerSight. Probe backwards. The current probe that is identified is probably backwards. Just turn it around and clamp it on the conductor. Probe switched. The identified probes seem to be switched. Simply trade their connections.
-
Page 49: Checking Connections Using Psm-A
Checking Connections using PSM-A The PowerSight Manager Advanced (PSM-A) software can be used to visually determine if the system connections and levels are correct. You can use PSM-A to analyze the connections to the meter by either capturing a waveform on the meter and downloading it with PSM-A, or by connecting to PSM-A and using the “Waveforms &... -
Page 50: Checking I Phase Sequence - Using Psm-A
Next either click on the “A” button or uncheck the Voltage phases and check the current phases. Verify that the current measurements are what you expect and are in the correct phase sequence (should be the same sequence as voltage) Last, either click on the “V&I”... -
Page 51: Checking Phase Lag Angle - Using Psm-A
Checking Phase Lag Angle – Using PSM-A When viewing the voltage and current waveform of a given phase, you will notice a timing relationship between the two waveforms (refer examples below). The point at which the current reaches its peak may lead or lag the peak of the voltage by as much as 90 degrees (90 degrees at 50 Hz... -
Page 52: Measurement Types
Measurement Types Voltage Measurements Voltage is the difference in electromotive potential between two points. Simply stated, it is the force that generates current flow and to measure voltage, two points of connection are required. In AC circuits, this force, measured in volts, usually varies continuously and always reverses direction. - Page 53 the mean of the square of the instantaneous voltage over one Vrms cycle of the fundamental frequency: When measuring DC voltage, the RMS value is the same as the DC value. Voltage crest factor is the ratio of peak voltage of a cycle over the ...
-
Page 54: Voltage Measurements In Powersight
Voltage Measurements in PowerSight PowerSight performs all commonly desired voltage measurements. When in phase-neutral measurement mode, the RMS (root mean square) voltage between V the V , and V input jacks is displayed by simply pressing [Voltage] key. Also displayed on the Voltage screen is the Fundamental Frequency and Voltage imbalance. -
Page 55: Voltage Measurements In Psm-A
If a connection is not made to the V input, PowerSight will find the neutral point between all the phases in doing its phase-neutral measurements. Voltage Measurements in PSM-A The consumption data log can record maximum, minimum, and average RMS voltage for each phase for each logging period. The summary values at the top of the screen are the maximum, minimum, and average of all the values shown on the screen. -
Page 56: Current Measurements
The measurements of voltage presented on PowerSight can also be displayed in PSM-A by using the remote-control feature. In addition, our ReportWriter software will present maximum, minimum, and average voltage of each phase during any one or two intervals of time set by the user. If two time intervals are chosen, it will report the percent change and the actual change between the two intervals. - Page 57 The instantaneous current is simply the current passing through a point at an instant of time. When the current is graphed over time, the graph is called the current waveform. The peak current, is the highest instantaneous current over a period of time. A measure that changes continuously is of limited use.
-
Page 58: Current Measurements In Powersight
When we speak of a current transient, we are speaking of an instantaneous current that exceeds a trigger level. An absolute trigger level is an instantaneous level that includes the underlying periodic waveform. A relative trigger level is an instantaneous level that has the underlying periodic waveform removed. -
Page 59: Current Measurements In Psm-A
When measuring DC current, the RMS value is the same as the DC value. To set PowerSight for reading DC currents, refer to the section on Setting Measurement Modes. Remember that you need to have a DC current probe (DC2000 or DC600) in order to read DC current. -
Page 60: Imbalance Measurements
measurement mode, the average RMS current of each phase for each second will be displayed and recorded each second. The measurements of current presented on PowerSight can also be displayed in PSM-A by using the remote-control feature. In addition, our ReportWriter software will present maximum, minimum, and average current of each phase and neutral during any one or two intervals of time set by the user. -
Page 61: Imbalance Measurements In Psm-A
Basically, this approach finds the average of the readings of the three phases and then finds how far away each of the phases is from this average. The phase with the largest deviation from the average is used for the final calculation, which is simply dividing this maximum deviation by the... -
Page 62: Power Measurements
Power Measurements There are three basic interrelated measurements of power: True power Apparent power Reactive power Apparent power is defined as the sum of the products of the RMS currents and their associated RMS voltages: ... -
Page 63: Power Measurements In Psm-A
Total true power (watts or KW), total reactive power (VAR or KVAR), and total apparent power (VA or KVA) measurements are available by simply pressing [Power] key to show True Power (Watts). To see VA or VAR, press the yellow soft key for [VA] or [VAR] when on the Power screen. -
Page 64: Power Factor Measurements
In addition, our ReportWriter software will present maximum, minimum, and average true power and apparent power of each phase and of all phases during any one or two intervals of time set by the user. If two time intervals are chosen, it will report the percent change and the actual change between the two intervals. - Page 65 equal to the cosine of the angle of phase lag of the current. No amount of harmonic filtering will raise this power factor, because it has no relationship to harmonics. True power factor is 1.00 for a purely DC system. Displacement power factor is actually not a power factor measurement.
-
Page 66: True Power Factor Measurements In Powersight
Maximum true or displacement power factor Minimum true or displacement power factor Average true or displacement power factor Present true or displacement power factor Maximum, minimum, average, and present total true power factor can also be measured. Finally, a measurement related to DPF is displacement phase angle. -
Page 67: Displacement P.f. And Phase Measurements In Powersight
Phase lag can be shown to give an indication if current may be leading or lagging voltage. While on the TPF screen, press the yellow soft key [Phs Lag] to show the lag angle. You can also press the soft key [Sequence] to show the phase sequence for voltage and current. -
Page 68: Energy Measurements
If trending data is being recorded and PowerSight is operating in phase-phase voltage measurement mode, the average total true power factor for each second will be displayed and recorded each second. Phase lag angle is most easily determined by viewing a waveform and then clicking on the phasor diagram icon. -
Page 69: Energy Measurements In Powersight
Estimated energy consumed per month Estimated energy consumed per year The real energy consumed is the amount of energy actually consumed during a period of time such as since monitoring started or during a specific week. For instance, if the sum of the KWH of each cycle totals to 5 KWH after 10 minutes of monitoring, then the energy consumed during the monitoring session is 5 KWH. -
Page 70: Energy Measurements In Psm-A
consumed is displayed by pressing [View Data Log], then pressing the yellow soft key [Page] then pressing the soft key [Energy]. This will show the current accumulated energy in Kilowatt Hours or the energy accumulated during the last logging session. Energy Measurements in PSM-A PSM-A presents all commonly desired energy measurements. -
Page 71: Cost Measurements
Cost Measurements The cost of energy consumed is defined as the product of the KWH rate energy consumed times the user-defined rate: $= PowerSight presently uses a simple single rate price system. Useful measurements and estimates of cost are: ... -
Page 72: Cost Measurements In Powersight
Cost Measurements in PowerSight PowerSight performs all commonly desired true cost of energy measurements. When monitoring consumption, the actual cost of energy consumed is displayed by pressing [View Data Log] then pressing the yellow soft key [Page] then pressing the soft key [Cost]. -
Page 73: Demand Period Measurements
Demand Period Measurements Utilities typically evaluate energy usage over fixed increments of time, such as 15-minute intervals. These time intervals are called “demand periods.” The average power consumed during each demand period is called the “demand” of that period. Typically, the utility will look for the demand period with the greatest demand over a period of time, such as a month, and call this the “peak demand period”. -
Page 74: Frequency Measurements In Powersight
waveform is called a cycle and is usually expressed in degrees (360 degrees to complete one cycle). Some frequency measurements of interest are: Present frequency Maximum frequency Minimum frequency Average frequency The present frequency is the average frequency of all of the cycles of the most recent second. -
Page 75: Frequency Measurements In Psm-A
PowerSight to various signals without concerning himself with the source of the frequency measurement. It is important to monitor frequency at installations where the frequency may vary. If an instrument makes the wrong assumption about the fundamental frequency, all voltages, currents, powers, etc. - Page 76 elapsed time of monitoring time remaining to fill consumption log record capacity of log number of records used in log time and date that monitoring started programmed start time and date of monitoring programmed stop time and date of monitoring The present time and date is the time and date of the clock inside PowerSight used for creating timestamps for the records of the log...
-
Page 77: Time And Capacity Measurements In Powersight
The number of records used in the log is a display of how many records have been saved since logging began. When displayed, it will always be accompanied by the record capacity of the log. The time and date that monitoring began is the internal clock reading of when monitoring began. -
Page 78: Time And Capacity Measurements In Psm-A
Time and Capacity Measurements in PSM-A The Data Setup window allows you to review and change many of the time and capacity measurements. The time capacity of the consumption log, the record capacity of all the logs and the programmed start and stop time of monitoring (if one exists) can be reviewed and changed. - Page 79 The fundamental frequency is the first harmonic. It is discussed in Frequency Measurements section. The harmonic frequencies are the frequencies that are multiples of the fundamental frequency. For instance, the 7 harmonic of 60 Hz is 7 60 420Hz .
-
Page 80: Harmonic Measurements In Powersight
K factor is a derivative of calculating THD where the frequency is given extra weight. Each harmonic current amplitude is divided by the total RMS current, multiplied by the harmonic number, then squared, and then summed over the first 50 harmonics. ... -
Page 81: Harmonic Measurements In Psm-A
Harmonic Measurements in PSM-A The consumption data log can record the average THD-F of each phase of voltage and each phase of current for each logging period. The summary values at the top of the screen are the average of all the values shown on the screen. When viewing a consumption waveform, transforming it into a harmonic graph presents a bar chart showing the relative magnitude of each of the first 50 harmonics. -
Page 82: Dips (Sags) Measurement
makes great sense to measure it in RMS. This allows for simple comparison to the voltage or current levels before and after the swell has occurred. For this reason, swells and inrush are measured in RMS. For highest accuracy, PowerSight calculates the RMS of each ½... - Page 83 PowerSight allows for setting two types of thresholds for detecting these high-speed events. Absolute transient thresholds look for any instant in which the voltage or current exceeds a certain absolute magnitude. This can be helpful to capture voltage events that may pierce the dielectric of a capacitor or breakdown a semiconductor switch.
-
Page 84: Measurement Modes
Measurement Modes Introducing Measurement Modes PowerSight performs so many measurements that it is quite a challenge to keep the instrument easy to use. Often, you make measurements on one general type of system. There is no need to complicate your task by PowerSight asking you to make the same choices over and over. - Page 85 On occasion, you may wish to measure phase-phase voltages in a wye system if the equipment that you are monitoring bridges two hot voltages (like a single- phase air conditioner running at 240 V). In a perfectly balanced three-phase system, the phase-neutral voltage is equal to the phase-phase voltage divided by the square root of 3 (Vpn=Vpp/1.732).
-
Page 86: Changing The Voltage Measurement Mode In Powersight
Changing the Voltage Measurement Mode in PowerSight To determine which voltage measurement mode PowerSight is in, simply press the [Setup] key of PowerSight and press the [Down Arrow] key until you reach “Voltage Mode”. To change the voltage measurement mode from what is displayed, press the [Right Arrow] key and then press [Up Arrow] or [Down Arrow] keys to select the desired... -
Page 87: 50/60/400Hz Vs Dc Vs Variable Frequency
50/60/400Hz vs DC vs Variable Frequency There are 3 frequency measurement modes in the PS5000: Variable Frequency from 22 – 200 Hz Variable Frequency from 360 – 440 Hz DC Circuit These modes allow making measurements on virtually any power system in the world. -
Page 88: Changing The Frequency Measurement Mode In Powersight
range and for this, the DC Circuit mode is used to assume the frequency is fixed or 0hz. This assumption of the time required to measure the inputs allows for accurate readings in DC systems and systems in which only higher harmonics are present (as with rectified signals). -
Page 89: Always Positive Power Versus Negative Power Allowed
To change the frequency measurement mode using PSM-A, either go to the Monitoring Setup menu, click on the Freq Mode drop- down box, select the mode that you wish to operate in, and then send the new setup to the connected PowerSight meter or operate in Remote Control mode and press the key combinations described above. -
Page 90: Changing The Power Measurement Mode In Powersight
measurement mode. In this mode, positive and negative power readings for each phase are accepted and are combined to find the net power usage. Depending on the result, positive or negative power, energy, and cost results may be displayed. When negative power measurements are allowed, it is necessary to have all current probes connected properly. -
Page 91: Changing The Power Measurement Mode In Psm-A
Changing the Power Measurement Mode in PSM-A To determine the power measurement mode using PSM-A, connect PowerSight to PSM-A and then either go to the Monitoring Setup menu and read what appears in the Power Mode box or operate in Remote Control mode and press the key combinations described above. - Page 92 scaled appropriately. PowerSight then records primary values, although it is connected to the secondary. There are other instances where input ratios are valuable. If a large current is carried by 2 or more parallel conductors, you can clamp onto 1 conductor, enter in the ratio (for instance 4 total conductors to 1 measured conductor) and thereby record the total power without clamping around all the conductors.
-
Page 93: Changing Input Ratios In Powersight
Changing Input Ratios in PowerSight To view the input ratios in PowerSight, press the [Setup] key then press the [Down Arrow] key until you get to the “Input Ratios” option. To change the ratios, press the [Right Arrow] key then select either the Voltage ratios or Current Ratios then press [OK]. -
Page 94: Voltage & Current Waveforms
As an example, suppose you wish to record the primary of a permanently installed CT while clamped onto the secondary with your I current probe. Select the “Source” box for “I ”. If the ratio of the CT is 600 : 5, simply enter “600” in the Source box and “5” in the Input box. - Page 95 captured due to some characteristic of the waveform. Triggered waveforms are discussed in later sections. Whenever a set of consumption waveforms is manually recorded by PowerSight, all 3 voltages and all four 4 currents are recorded for 50 milliseconds. This time-coincident snapshot of 7 waveforms is called a "waveform set".
-
Page 96: Receiving Stored Consumption Waveforms
When the PowerSight is connected to PSM-A, you can also capture a waveform set at any given moment by clicking on “Communications” then clicking on “Waveforms & Connections”. This will open up the waveform graph and automatically take a new waveform and open it. A waveset captured this way is immediately stored in the PC and shown on the screen. -
Page 97: Viewing Consumption Waveforms
Viewing Consumption Waveforms To select a waveform set to view, at the main menu, click on “Data Analysis”, then “View Consumption Data”, or click on “File” and then “View Data”. This will result in the View Sessions Data screen being shown. In the “Instant Waveforms”... - Page 98 section to learn more about available presentation and analysis features. You can easily transform any waveform into either a graph of harmonic data or a view the raw data for each harmonic. To view the harmonic graph (“frequency domain” representation), click on the Harmonics icon. You have the choice of viewing the amplitudes of individual harmonics as either RMS amplitudes (Vrms or Arms) or as a percentage of the magnitude of the fundamental harmonic (the fundamental is always 100% as...
- Page 99 to its associated voltage will be similar. The data graphs on the left of the phasor display show the actual degrees of all voltages and currents in relation to the phase 1 voltage and show the phase angle between the voltage and current of each phase. You can also see the Phasors from the PS5000 display itself in real time.
- Page 100 Once you are done customizing your graph, you can save the graph as an image and print it or import it into a report for demonstration.
-
Page 101: Monitoring Power Consumption
Monitoring Power Consumption Introduction When PowerSight is first turned on, it operates like a reporter, describing what it sees. New measurements are generated each second that replace old measurements. Old measurements are discarded. These are the “present” values that are displayed as you press various keys. -
Page 102: Basic Consumption Data Logging
This is the act of recording summarizing information once every logging period. With PowerSight, the logging period is set by the user, whereas the measurement updating period is always once per second. This ensures that you don’t miss valuable information related to the actual power used and the maximums and minimums present. - Page 103 have that installed when you receive your unit, so you are ready to begin logging under general circumstances. The default data logging setup is: Logging period = “3” minutes. This means that every 3 minutes, a new record is created that includes all the variables that are requested by the setup.
- Page 104 current in phase 1 current in phase 2 current in phase 3 current in neutral true power in phase 1 true power in phase 2 true power in phase 3 true power total ...
-
Page 105: Receiving The Data Logging Session From Powersight
or stop time, refer to the Custom Consumption Data Logging chapter. Receiving the Data Logging Session from PowerSight To receive a consumption data log from PowerSight, the PowerSight unit must be connected to a computer running PSM-A. At the main menu of PSM- A, the green “Connected to XXX”... -
Page 106: Viewing The Data Logging Session In Psm-A
Viewing the Data Logging Session in PSM-A To view any of our file types from your data logging session in PSM-A, you will first have to download the data from the meter either via Bluetooth, USB or SD card. After the data is downloaded and saved to your PC, you can view your sessions under “Data Analysis”... -
Page 107: Viewing The Data Logging Session On Powersight
Viewing the Data Logging Session on PowerSight To view your current or recent data log from the PowerSight meter, press the [View Data Log] key. From here you can view the Maximum, Minimum, and Average measurements for Voltage, Current, Power, Power Factor, Frequency, and many more. -
Page 108: Presentation Of The Graph In Psm-A
Presentation of the Graph in PSM-A It is important to us to allow you to work with and manipulate the various graphs and waveform presentations in PSM-A. We try to make the features that accomplish this look and feel the same throughout the program so you can handle all waveforms and graphs in the same way as much as possible. -
Page 109: Reading Graphs And Waveforms
Normally, the color of the signals is set automatically by PSM-A to give good color contrast on a color monitor. However, that contrast may not stand out on your monitor or on your color printer or especially with your black and white printer. - Page 110 measurement is. When the graph combines different types of measurements (such as when displaying voltage and current) there will be a vertical name and metric on the left side and a different one on the right side of the graph. 4) The horizontal axis is usually time.
- Page 111 If it is an energy (kWH), it is the final point shown (the energy consumed during the time displayed). b) For a consumption waveform, the summary for a specific signal is the RMS value and crest factor of the signal. The power and power factor of the phase or phases is also...
-
Page 112: Zooming And Panning
Zooming and Panning Perhaps the most powerful tool of graphical analysis is zooming. This feature allows you to expand an area of interest of a graph or waveform so that it fills the screen. It also allows you to trim off areas that you don’t want displayed (for instance, you may only want one... - Page 113 repetitive peaks. The example on the right does a good job of focusing in on this area of particular interest. The example on the previou page showing the full log has several features of interest highlighted. Notice that the cursor is positioned near the center of the display.
-
Page 114: Custom Data Logging
The collection of choices that are made on how to operate is called a “setup” file. You can use the “default” setup file, supplied by Summit Technology or you can create, store, and retrieve your own. Starting Data Logging There are several methods to initiate data logging. -
Page 115: Stopping Data Logging
and time will be stored in the unit, until a new date and time are written over it. This is a great way to synchronize several PowerSights to start logging at the same time, so their data logs can be synchronized. It is also a great way to log for a specific number if minutes or hours or days or whatever when combined with the mode of stopping data logging at a specific date and time. -
Page 116: Setting The Data Logging Period
continually and always have the most recent data available for analysis. Setting the Data Logging Period One of the most important settings is the choice of logging period. This is the length of time between the creation of data records. This has no effect on the measurement rate or the sampling rate. -
Page 117: Setting Measurement Types
recommend logging ALL variables even if you do not need them for this test. You can also change the logging period from the keyboard of your meter. Click on [Setup] key, then use the [Down Arrow] keys to select the “Logging Period” option. Press [OK] to make changes to the current logging period then press [OK] again to accept. -
Page 118: Setting Measurement Modes
You can also see how long 1 data log will last on the SD card. The SD card has a lot more memory capacity than the meter so it can contain 65,535 records max, per each log. When combined with the log STOP mode set to “Don’t Stop”, when the meter reaches this record count, it will stop logging automatically then start a new log on the card. -
Page 119: Loading Data Setups From The Memory Card (Sd Card)
To retrieve the setup from a file, click on the “Monitoring Setup” button on the main menu, then select the “View Stored Data Setup” button. This will open up the windows dialog box to choose a saved data setup file. To view the connected meter’s data setup, you can choose “View Meter’s Data Setup”... -
Page 120: Saving Data Setups To The Memory Card (Sd Card)
them, it will ask again if you wish to load a data setup from the memory card. This functionality makes it easy to load multiple setups onto an SD card to support a test plan including multiple locations and involving multiple meters. Saving Data Setups to the Memory Card (SD Card) It is beneficial to store a copy of the present data setup onto the SD card to document how a monitoring session was set up. -
Page 121: Monitoring Swell/Dip/Inrush
Monitoring Swell/Dip/Inrush Introduction The three general areas of power quality analysis are in investigating on-going harmonic content, analyzing temporary changes in RMS voltage and current levels, and in analyzing instantaneous high-speed (non-RMS) voltage and current transients. Swells (also known as surges), dips (also known as sags), and current inrushes are temporary changes in RMS values that are outside of a norm. -
Page 122: Swell/Dip Event Log
If thresholds are set, swell/dip monitoring begins when consumption monitoring begins and continues without interruption. While monitoring is in progress, a green “Monitoring” box is seen at the bottom right corner of the display. It will flash on and off each second to assure you that monitoring is in progress. - Page 123 ending with the first ½ cycle that did not exceed the trigger threshold and was followed by 1 second of not passing the trigger threshold. The swell/dip event log can be displayed by PSM-A in three ways: text record, one line per event ...
-
Page 124: Swell/Dip Rms Graph Log
Swell/Dip RMS Graph Log Each record of the Swell/Dip RMS graph log is a recording of the RMS level of the signal starting 2 cycles before the trigger threshold is passed and continuing for 48 cycles or until the first ½ cycle that did not exceed the trigger threshold and was followed by 1 second of not passing the trigger threshold. -
Page 125: Setting The Swell/Dip Trigger Thresholds In Psm-A
The waveforms can be graphed in order to better understand the swell/dip event. Important information is at the top. The signal name, the timestamp of when the event occurred, the magnitude of the event, and the duration of the event are listed. In addition, moving the cursor over the graph results in the voltage (or current) of that point being displayed in the heading. - Page 126 The second type of triggering is Fixed Trigger Level. This is where the user applies the values for voltage and/or current for the meter to trigger on. This is also the only mode that will look for current events as you will manually tell the meter what threshold to trigger on.
-
Page 127: Monitoring High-Speed Transient Events
It should be noted that you generally will not want to select the neutral current, I , if you are also triggering on other currents. This is because the neutral current is typically much smaller than the other phase currents and needs to have different trigger thresholds. -
Page 128: Transient Event Log
There are two types of recordings of high-speed transient events: Transient Event Logs Transient Event waveforms. Each of these recordings will be discussed at length in next two sections. The fact that the PS5000 evaluates the high-speed transients every 8 µsecs on every input channel means that no transients lasting more than 8 µsec are missed and precise measurement of their characteristics is available. -
Page 129: Transient Event Waveforms
Timestamp Signal affected Peak value Duration. The “timestamp” records the date and the time that the event began, to the nearest microsecond. The “signal affected” is simply the name of the signal that had was triggered, such as “V ”. -
Page 130: Setting The Transient Trigger Thresholds In Psm-A
over the graph results in the instantaneous voltage (or current) of that point being displayed in the heading. Whatever is seen can be zoomed-in on and can be printed. Setting the Transient Trigger Thresholds in PSM-A Event monitoring is setup with the Monitoring Setup in PSM-A. To do so, go to “Monitoring Setup”... - Page 131 A perfect sine wave has a peak instantaneous value of its RMS level times the square root of two. For instance, the normal peak instantaneous voltage of a 120Vrms circuit is 120x1.414= 170V. This means that a perfect 120Vrms sine wave will reach +170V and -170V once during each cycle.
-
Page 132: Allocating Memory Within Powersight
When all the trigger levels are set correctly, you may save the data setup to a file or to a connected PowerSight. Allocating Memory within PowerSight Allocation of memory in the PS5000 is very flexible. If one type of measurement or area of analysis is of no interest, its storage can be eliminated. - Page 133 continue to log past the capacity of the meter until the data log record count reaches 65,535 records. At this point the meter will automatically stop recording and automatically start recording again, creating a new file on the card while starting over in the internal memory.
-
Page 134: Reportwriter Software
ReportWriter Software Introduction PSM-A comes with a ReportWriter Software program. The ReportWriter software provides concise reports to summarize and document findings. Comparison reports are excellent for presenting before/after comparisons of power usage and projected cost. Separate logs can be compared or sections of the same log can be compared for this analysis. - Page 135 also edit or remove authors by selecting them in the top dialog box then pressing either the “Edit Author” button or the “Remove Author” button. After you press “Proceed” you will see the “ReportWriter Titles and Data Source” screen. Here you will create a Report Title then choose between doing a summary report or...
- Page 136 want to compare equal “before” and “after” timeframes. When you are done entering the information, click on “Proceed”. The next screen is the “ReportWriter Variables” screen. Each measurement type that can be included in the report has its own checkbox. They are organized in a matrix that allows ease of locating a specific signal and ease in...
-
Page 137: Viewing A Report
The last screen is the ReportWriter Presentation. Here you will select what type of graphs you want, the type of file the report will create, and be able to edit the look of the graphs in the report. You can select from “Half-Page Graphs” which will put 2 graphs per page, “Full-Page Graphs”... - Page 138 information about the source of the “before” data and separate information about the source of the “after” data. After the source information is the main body of the report. Each measurement type is listed in the first column. The “Before” column is the one number summary for the measurement type for the “before”...
-
Page 139: Testplan Manager In Psm-A
TestPlan Manager in PSM-A What is TestPlan Manager TestPlan Manager is a new way to organize your multi-point power quality testing. TestPlan Manager allows you to create a Testplan for multiple systems or for 1 system with multiple test points, load it into PowerSight, then quickly test and gather the data via SD card. -
Page 140: Opening An Existing Testplan In Psm-A
The idea is to organize multiple meters or multiple test points, store the files in predetermined locations on the SD card, then with TestPlan Manager, and download those tests from 1 or more cards easily and efficiently. For example, say you had 9 motors you needed to test, each needing their... -
Page 141: Create A New Testplan In Psm-A
Create a New TestPlan in PSM-A Open TestPlan Manager, then start filling in the required fields. These fields will be used to create the test plan file name. 1. Enter “Test Plan ID”. This is the unique name for the test plan. - Page 142 organized by the specific name of each piece of equipment (i.e. the Equipment ID) rather than by the test plan, since the test plan identifiers may be different each time you test the same equipment. For example: You monitor the performance of motors at a facility and reevaluate them twice a year.
- Page 143 circuits and 3 loads on each branch circuit could have one-line level identifiers of 1-0-0(the main entrance), 1-1-0(1 branch), 1-2-0(2 branch), 1-1-1 (1 load of 1 branch), 1-1-2 (2 load of 1 branch), 1-2-1 (1 load of 2 branch), etc e.
- Page 144 o. Test Type: (Optional) the type of test being done for that test point. p. Comment: (Optional) any other relevant details for that test point. 6. Next is to print your TestPlan. This is useful to give those doing the individuals doing the test point a detailed list of the points and any comments relevant to their particular tests.
-
Page 145: Using Testplan Manager With Powersight
Using TestPlan Manager with Powersight Once all the PowerSight meters have their SD cards loaded with the TestPlan, it is time to get them out into the field to start testing. TestPlan Manager in PowerSight makes it easy to apply the right test to the right test point, eliminating mistakes. -
Page 146: Retrieving The Testplan Data In Psm-A
Retrieving the TestPlan Data in PSM-A What TestPlan Manager does best is makes the retrieval and organizing of your test plan data quick and easy. With normal tests, after you are finished, you would connect to the meter via Bluetooth or USB, or you would insert your SD card and manually navigate to your data files and copy them to your PC. - Page 147 5. A window will open showing any drives of your computer that can have data for the test plan. 6. Make sure that your SD card is selected for the source. Then make sure that the correct destination drive is selected, normally the C: drive, then click “OK”.
-
Page 148: Opening Testplan Data In Psm-A
header section. This automatic routing of every test file saves you time and eliminates a source of error. b. Each data file was re-named to the name in the “Destination Filename” entry for that test point. This automatic re-naming saved you time and eliminated a source of error. -
Page 149: Setup Functions
In order to calibrate the meter, you need access to highly accurate 120.0 V, 1000.0V, 1000A, and four highly accurate calibrated HA1000 current probes. The calibration is done in sequence. The current probes must all be plugged in. To calibrate the PS5000, press [Setup] key then press the [Down Arrow] Key until you see the “Calibration”... -
Page 150: Administrative Functions
The Data Setup option under the [Setup] key allows you to view the meters current setup, set the setup to default, or load a data setup stored on an SD card. To review the Logging Period of the PS5000, press [Setup] key, then press the [Down Arrow] Key. - Page 151 Firmware revision level (what level of software is active within PowerSight) Hardware revision level (what level of hardware compatibility it is). Boot revision level (what level of bootloader is active within PowerSight) Digital Processing revision level (algorithms used for measurement) ...
-
Page 152: Other Functions Within Psm-A
Bluetooth or sound, setting the language of the meter and the date format. Use the [Down Arrow] key then [OK] to select an option then use the arrow keys and [OK] to make the changes. Other Functions within PSM-A Introduction In addition to the many power analysis functions of PSM-A that have been presented in previous chapters, there are several other functions available. -
Page 153: Locating And Installing Software And Firmware
Locating and Installing Software and Firmware A tradition of PowerSight models is that the products continue to improve and as they improve, those enhancements and features are made available to users who elect to stay under our enhanced warranty. Our PSM-A software continues to improve and is available for download via the web. -
Page 154: Setting Up Administrative Features Of Powersight Via Psm-A
“Firmware Upgrade” pop up window. It should be populated with the firmware version for you to upgrade to. If it has not, you can press the “Change” button to navigate your PC to find the upgrade files. Press the “Install New Firmware” button to start the installation process. -
Page 155: Putting It All Together (Monitoring For The First Time)
Settings window will pop up. The present personal greeting, date and time will be displayed. Simply make any changes that you wish and then click “Set New Date Time” to apply the computers date and time to the meter, or “Set New Greeting” to apply the greeting changes to the meter. - Page 156 time and location and then PowerSight can be transported to the site of logging. The first step is to set up or check the parameters for logging. 1. Review the chapter Communication with PowerSight to ensure that Bluetooth communications are established between the PC operating system and the meter after the meter is turned 2.
-
Page 157: Troubleshooting & Frequently Asked Questions (Faq)
You can either use a USB data cable to tether to the meter or buy a Bluetooth Adapter from Summit Technology (order BTA). This adapter will plug into one of your USB ports. Other brands will likely work, but cannot be guaranteed to work with PowerSight. - Page 158 4. Why doesn't my PowerSight read Voltage/Current correctly? There are many reasons why PowerSight may not be reading voltage or current. First, check that you have all the voltage and current leads connected correctly. Then if that doesn't solve your problem, check that the frequency mode of the PowerSight is in the correct mode for your situation.
- Page 159 main menu of PSM-A then go to “View Meter’s Data Setup”. The “Details” button is where you can see how long the given study type will take to fill up. You can also press the [Monitoring Start/Stop] key, and if currently logging, it will show the time to fill log on the display.
-
Page 160: Frequency Analysis Option
11. How often should I have my PowerSight calibrated? We recommend that you have the PowerSight calibrated once every year. We also recommend that all voltage and current probes be sent in with the unit for calibration. 12. Can I use other manufacturers’ current probes with PowerSight? Unfortunately, no. -
Page 161: Overview Of The Keypad Functions
Hz to 100,000 Hz are obtained from PSM-A. Voltage amplitudes of a few millivolts riding on 480V systems can be accurately measured with this option. Similarly, very small high frequency currents can be detected. Since high frequency current has a dramatic heating effect compared to low frequency current, it is important to know if there are high frequency components riding on the power-line. -
Page 162: Compatibility Guide
Although we attempt to make all products and accessories compatible, there are limitations to what devices and versions can work well together. The PS5000 must be used with PSM-A software of at least the 4.2 series. Compatibility of the PS5000 with Summit Technology accessories is as follows:... - Page 163 Accessories PS5000 120ADP-a not compatible (use 120ADP-a) 120ADP (discontinued) 15KVP 5KVP 5KVP (version with ext. not compatible (use new version) box) CAS3 CASW CHG1 Yes, for Euro 220V standard CHG2 not compatible CHG3 not compatible CHG4 Yes, for US 120V standard not compatible COMM DC600...
-
Page 164: Specifications
Specifications* Size 3.88” (9.86cm) Wide 7.72” (19.61cm) Long 1.58” (4.01cm) Deep in Hand-held region, 2.14” (5.44cm) deep at the top end Weight 1.1 pound (0.5 kg) Operating Range 0 - 50 degrees C (32 - 122 degrees F) Relative humidity to 70% (non-condensing) Meets mechanical shock requirements of MIL-PRF 28800F for a class 1 (harshest) environment... - Page 165 Measure Rate: Measure every cycle of every input. Frequency Response: dependent on current probe attached. With HA1000: no de-rating of accuracy for harmonics through 3900 Hz) Frequency Range: DC, 22 - 200 Hz, 360 – 440 Hz fundamental frequency DC and 22 - 4500 Hz included in RMS 22 - 3900 Hz for harmonic measurements Accuracy: 0.25%...
Need help?
Do you have a question about the PowerSight PS5000 and is the answer not in the manual?
Questions and answers