
Related Manuals for Feasa S2


Summary of Contents for Feasa S2
- Page 1 Feasa LED Spectrometer User Manual for Feasa S2 Spectrometer Feasa Enterprises Ltd, Holland Road, National Technology Park, Castletroy, Limerick, Ireland. www.feasa.ie Email: sales@feasa.ie Rev. 1.4 Date: November, 2020...
-
Page 2: About This Manual
Feasa reserves the right to revise this document or withdraw it at any time without prior notice. This manual is written for the Feasa LED Spectrometer version S2. -
Page 3: Table Of Contents
Feasa LED Spectrometer Table of Contents About this Manual..............2 Introduction................6 Safety Instructions..............7 Physical Layout...............8 Power Requirements:...............8 USB Port Control..............9 Serial Port Control (RS232)............9 Trigger Port Control............10 Connecting the Patch Cord to the Spectrometer......11 Spectrometer Block Diagram...........12 Spectrometer Front End Software..........13 Spectrometer Definitions............14... - Page 4 Connecting the Patch Cord to the Spectrometer......57 Setup Spectrometer No 1 / Master........61 Setup Spectrometer No 2 / Slave No 1........64 Setup Spectrometer No 3 / Slave No 2........67 Summary of Setup Procedure..........70 Operating the S2 Spectrometer in Daisy Chain Mode:....71 Capture Dark..............71 Capture the Bus..............72...
- Page 5 Feasa LED Spectrometer Retrieving the Data.............72 Specifications................75 Ordering Information.............76 Error Messages..............77 OverRange................77 UnderRange...............77 Error: light signal not stable..........77 Timeout Occurred...............77 Capture Dark Error.............77 Warranty................78...
-
Page 6: Introduction
Traceable measurements can be obtained for Luminous Flux (Lumens), Luminous Intensity, Luminance and Wavelength. The Feasa Led Spectrometer is compatible with all Feasa Led Analysers to ensure production setup meets customer requirements. LED test and measurement functions have been incorporated into the Spectrometer so that minimum data processing is required. -
Page 7: Safety Instructions
Feasa LED Spectrometer Safety Instructions Safety precautions should be implemented when testing LEDs. Care should be taken to avoid adverse effects on the human eye caused by light stimulation. Eye protection should be worn especially when testing high power LEDs. -
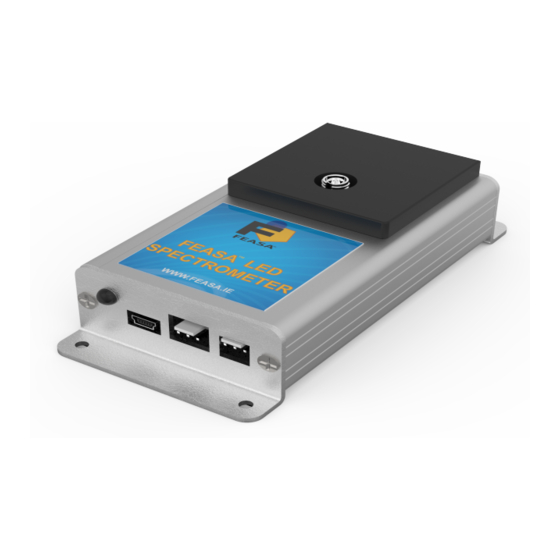
Page 8: Physical Layout
This shows the layout of the Connectors viewed from the edge of the board. Figure 1a shows the physical layout of the Feasa S2 Led Spectrometer Front Panels. Figure 1b shows the physical layout of the Feasa S2 Led Spectrometer Rear Panels. -
Page 9: Usb Port Control
Feasa LED Spectrometer USB Port Control Connect the LED Spectrometer to the PC using the supplied USB cable. Power is supplied through the USB Cable so there is no need to plug in the Power cable. The installed Software Driver will configure the USB Port automatically. -
Page 10: Trigger Port Control
When the Trigger is activated there is a 1.5ms +/- 0.1ms delay before the light capture begins. The commands must be transmitted through the USB or Serial Port of the Led Analyser. The Feasa Terminal program can be used to perform this task. -
Page 11: Connecting The Patch Cord To The Spectrometer
Feasa LED Spectrometer Connecting the Patch Cord to the Spectrometer Remove the protective end caps from the patch cord. Using the surface cleaner sachet wipe provide, clean both ends. This wipe is suitable for one time use only. For periodic cleaning, use isopropyl and lint free wipes. -
Page 12: Spectrometer Block Diagram
The Spectrometer is connected to a PC using a USB cable in this example but the RS232 Interface can also be used. The Feasa Spectrometer Software, running on the PC, is used to control the Spectrometer and display the results. -
Page 13: Spectrometer Front End Software
Feasa LED Spectrometer Spectrometer Front End Software Figure 11. The Feasa Spectrometer Software is used to configure and make measurements with the Spectrometer. The Spectrometer must be connected to a PC with a USB cable before running this software. Click on the Connect/Disconnect icon to connect the Spectrometer. -
Page 14: Spectrometer Definitions
Feasa LED Spectrometer Spectrometer Definitions Peak Wavelength The Peak Wavelength is the wavelength where the spectrum reaches its highest intensity i.e the maximum power as emitted by a LED. This point is shown in the graph below and is labeled peak. -
Page 15: Dominant Wavelength
Feasa LED Spectrometer Spectrometer Definitions Dominant Wavelength The dominant wavelength of a colour is defined on the 1931 CIE Chromaticity diagram. straight line is drawn from the White Point (co-ordinates 0.33,0.33) through the point whose co-ordinates represent the colour being tested and is extended to the edge of the diagram. The point where the line intersects the edge is the Dominant wavelength of the colour being measured. -
Page 16: Correlated Colour Temperature Cct
Feasa LED Spectrometer Spectrometer Definitions Correlated Colour Temperature CCT Correlated Colour Temperature is a measure of how warm or cool the light given off by a white LED appears. Warm colours appear tinged with yellow while cool colours are tinged with blue and appear whiter to the observer. -
Page 17: Luminous Flux - Lumen (Lm)
Feasa LED Spectrometer Spectrometer Definitions Luminous Flux – Lumen (lm) The lumen is the unit of the total luminous flux emitted by a LED. This is the total amount of visible light emitted by the LED in all directions. The lumen is characterized by the response of the human eye to the different wavelengths of visible light. -
Page 18: Luminous Intensity -Candela (Cd)
Feasa LED Spectrometer Spectrometer Definitions Luminous Intensity -Candela (cd) The luminous intensity (in candelas) is a measure of wavelength weighted power emitted by a Led in a particular direction (how bright the beam in a particular direction is). Candelas are measured using a calibrated Luminous Intensity Head (CDxx) Figure 17 which is used to collect all the available light and present it at a measurement port. -
Page 19: Luminance - Candella Per M (Cd/M )
Luminance is thus an indicator of how bright the surface will appear. The Feasa Luminance Head has been specifically designed to measure the Luminance/Radiance and colour of Automotive Displays. -
Page 20: Command Structure
Feasa LED Spectrometer Command Structure There are a number of commands that can be used to control the Spectrometer. In general they can be divided up into five distinct groups:- Capture – capture the Colour, Intensity and Spectral data of the LED's Get Data –... -
Page 21: Capture - Capture Led Wavelength And Intensity Data
Feasa LED Spectrometer Capture Mode Capture - Capture LED Wavelength and Intensity Data Transmit Receive capture Description This command instructs the Spectrometer to capture and store the Wavelength and Intensity data for the LED that is being measured. The Spectrometer automatically determines the correct settings to capture the LED data. -
Page 22: Capture####### - Capture Led Data For A Specific Integration Time
Feasa LED Spectrometer Capture Mode Capture####### - Capture LED Data for a specific Integration Time Transmit Receive capture####### Where: ####### represents the integration time in microseconds from 100uS to 4000000uS. Description This command instructs the Spectrometer to capture and store the Wavelength and Intensity data for the LED that is being measured. -
Page 23: Cc - Capture Led Data For A Predetermined Integration Time
Feasa LED Spectrometer Capture Mode CC – Capture LED Data for a predetermined Integration Time. Transmit Receive Description This command instructs the Spectrometer to capture and store the Wavelength and Intensity data for the LED that is being measured. It uses the predetermined Integration time as set by... -
Page 24: Get Data Commands
Feasa LED Spectrometer Get Data Commands The get data commands are used to read out the Colour, Intensity and Spectral data stored by the capture command. The data from the last capture command remains in memory until a new capture command is issued or the power is removed from the Spectrometer. -
Page 25: Getaverage - Get The Number Of Readings That Are Averaged
Feasa LED Spectrometer Get Data Mode GetAverage - Get the number of readings that are averaged Transmit Receive GetAverage Where: ### represents the number the range 001 – 450. Description This command instructs the Spectrometer to return the number of captures to take before averaging the results. -
Page 26: Getcapturetime - Get The Led Capture Time
Feasa LED Spectrometer Get Data Mode getCaptureTime - Get the LED Capture Time Transmit Receive getcapturetime XXXXX us Where: xxxxx represents the time in usec to capture the LED data. Description This command is used to get the Capture time (Integration time) of the LED being measured. -
Page 27: Getsignallevel - Intensity As A Percentage Of The Range
Feasa LED Spectrometer Get Data Mode getSIGNALLEVEL - Intensity as a percentage of the Range Transmit Receive getsignallevel iii.i % Where: iii.i% represents the intensity value in percentage terms This 3 digit number is in the range 001 – 100. 000% and represents no Intensity or under range(i.e. the LED is off) and 999% will represent over range or the LED is too bright. -
Page 28: Getcct - Get Correlated Color Temperature
Feasa LED Spectrometer Get Data Mode getCCT - Get Correlated Color temperature Transmit Receive getcct XXXXX ±0.yyyy Where: xxxxx represents the correlated colour temperature of the LED source. ± 0.yyyy represents the distance the LED is from the Plankian locus (Delta E) -
Page 29: Getdominantwavelength - Get The Dominant Wavelength
Feasa LED Spectrometer Get Data Mode getDominantWavelength - Get the Dominant Wavelength Transmit Receive getdominantwavelength XXX.XX Where: xxx.xx represents the dominant wavelength of the LED in nanometers. Description This command is used to get the value of the Dominant Wavelength for the LED being measured. -
Page 30: Getgai - Get The Gamut Area Index Of The Led
Feasa LED Spectrometer Get Data Mode getGAI Get the Gamut Area Index of the Led Transmit Receive getgai xxx.xx Where: xxx.xx represents the Gamut Area Index of the LED. Description This command is used to get the Gamut Area Index of the LED being measured. -
Page 31: Getluminousflux - Get The Lumen Value
Feasa LED Spectrometer Get Data Mode getLuminousFlux Get the Lumen value Transmit Receive getluminousflux X.XXXXXE-XX lm Where: x.xxxxE-xx Luminous flux (in lumens) is a measure of the total amount of light a lamp puts out. Description This command is used to get the Lumen value of the for the LED being measured. -
Page 32: Getluminousintensity - Get The Millicd Value
Feasa LED Spectrometer Get Data Mode getLuminousIntensity Get the milliCD value Transmit Receive getluminousintensity X.XXXXX Where: x.xxxxx The luminous intensity (in candelas) is a measure of how bright the beam in a particular direction is. Description This command is used to get the Luminous Intensity (candela) value of the LED being measured. -
Page 33: Getluminance - Get The Cd/M Value
Feasa LED Spectrometer Get Data Mode getLuminance Get the cd/m value Transmit Receive getluminance cd/m Where: .xxxxx Luminance is often used to characterize emission or reflection from flat, diffuse surfaces. Luminance levels indicate how much luminous power could be detected by the human eye looking at a particular surface from a particular angle of view. -
Page 34: Getpeakwavelength - Get The Peak Wavelength
Feasa LED Spectrometer Get Data Mode getPeakWavelength Get the Peak Wavelength Transmit Receive getPeakWavelength XXX.XX Where: xxx.xx represents the Peak wavelength of the LED in nanometers. Description This command is used to get the value of the Peak Wavelength for the LED being measured. -
Page 35: Getpower - Get The Radiant Power Of The Led
Feasa LED Spectrometer Get Data Mode getPower Get the Radiant Power of the LED Transmit Receive getPower XXXX.XXX Where: xxxx.xxx represents the Radiant Power emitted by the LED in Watts. Description This command is used to get the value of the Radiant Power for the LED being measured. -
Page 36: Getspectralwidth - Get The Spectral Width Of The Led
Feasa LED Spectrometer Get Data Mode getSpectralWidth - Get the Spectral width of the Led Transmit Receive getSpectralWidth XXX.xx nm Where: xxx.xx represents the Spectral width (Full width half maximum) of the LED in nanometers. Description This command is used to get the value of the Spectral Width for the LED being measured. -
Page 37: Getxy - Get The Xy Chromaticity Of The Led
Feasa LED Spectrometer Get Data Mode getxy Get the xy Chromaticity of the Led Transmit Receive getxy 0.XXXX 0.YYYY Where: 0.xxxx represents the x Chromaticity of the LED. 0.yyyy represents the y Chromaticity of the LED. Description This command is used to get the xy Chromaticity of the LED being measured. -
Page 38: Get1960Uv - Get The Cie 1960 Uv Chromaticity Of The Led
Feasa LED Spectrometer Get Data Mode get1960uv - Get the CIE 1960 uv Chromaticity of the Led Transmit Receive get1960uv 0.uuuu 0.vvvv Where: 0.uuuu represents the u Chromaticity of the LED. 0.vvvv represents the v Chromaticity of the LED. Description This command is used to get the CIE 1960 uv Chromaticity of the LED being measured. -
Page 39: Get1976Uv - Get The Cie 1976 U'v' Chromaticity Of The Led
Feasa LED Spectrometer Get Data Mode get1976uv - Get the CIE 1976 u'v' Chromaticity of the Led Transmit Receive get1976uv 0.uuuu 0.vvvv Where: 0.uuuu represents the u' Chromaticity of the LED. 0.vvvv represents the v' Chromaticity of the LED. Description This command is used to get the CIE 1976 u'v' Chromaticity of the LED being measured. -
Page 40: Getspd - Get The Spectral Data Of The Led
Feasa LED Spectrometer Get Data Mode getSPD Get the Spectral Data of the Led Transmit Receive getSPD www.ww s.sssss (Multiple) Where: www.ww represents the wavelength of the Spectral data in nanometers. s.sssss represents the Optical Power normalized to 1. Description This command is used to get the spectral data for the LED being measured. -
Page 41: Getcri - Get The Colour Rendering Index Of The Led
Feasa LED Spectrometer Get Data Mode getCRI Get the Colour Rendering Index of the Led Transmit Receive getCRI XXX.XX (Multiple) Where: XXX.XX represents the CRI data of the LED Description This command is used to get the CRI data for the LED being measured. -
Page 42: Getcqs - Get The Colour Quality Scale Of The Led
Feasa LED Spectrometer Get Data Mode getCQS - Get the Colour Quality Scale of the Led Transmit Receive getCQS XXX.XX (Multiple) Where: XXX.XX represents the CQS data of the LED Description This command is used to get the CQS data for the LED being measured. -
Page 43: Getbaud - Get The Baud Rate
The default Port settings of the Analyser are 57,600, 8 Data bits, 1 Stop bit and No Parity. It can also be seen on the comment section of the Feasa terminal window. Example: To get the baud rate of the Analyser transmit the command getbaud to the Analyser. -
Page 44: Important Information For Programmers
Feasa LED Spectrometer Set Commands IMPORTANT INFORMATION for Programmers set / put Commands The Set / Put commands are used to adjust various settings in the Spectrometer such as Intensity, Exposure and offsets. The Set commands are written to the on-board Flash. -
Page 45: Set Commands
Feasa LED Spectrometer Set Data Mode Set Commands Setcustomtime####### - set a specific Integration time Transmit Receive Setcustomtime####### Putcustomtime####### Where: ####### represents the Integration Time in uSec from 100uS to 4Sec. 100us = 0000100 3Sec = 30000000 Description setcustomtime allows the user to set a predetermined Integration time for the Spectrometer. -
Page 46: Setpwm# - Enable/Disable Pwm Capture Mode
Feasa LED Spectrometer Set Data Mode SetPWM# - Enable/Disable PWM capture mode Transmit Receive SetPWM# PutPWM# Where: # represents the 1 or 0. 1 = PWM capture mode ON 0 = PWM capture mode OFF Description Pulse-Width-Modulated(PWM) LED's are switched on and off rapidly to save power and to control Intensity. -
Page 47: Setaverage### - Set The Number Of Readings To Average
Feasa LED Spectrometer Set Data Mode SetAverage### - Set the number of readings to average Transmit Receive SetAverage### PutAverage### Where: ### represents the Fiber Number in the range 001 – 450. Description This command allows the user to adjust the number of captures(readings) to take before averaging the results. -
Page 48: Setwaverangemin###.## - Set Minimum Wavelength
Feasa LED Spectrometer Set Data Mode SetWaveRangeMin###.## - Set minimum wavelength Transmit Receive SetWaveRangeMin###.## PutWaveRangeMin###.## Where: ###.## represents the minimum wavelength to be measured. Description This command allows the user to set the value of the minimum wavelength to be measured. -
Page 49: Setwaverangemax###.## - Set Maximum Wavelength
Feasa LED Spectrometer Set Data Mode SetWaveRangeMax###.## - Set maximum wavelength Transmit Receive SetWaveRangeMax###.## PutWaveRangeMax###.## Where: ###.## represents the maximum wavelength to be measured. Description This command allows the user to set the value of the maximum wavelength to be measured. -
Page 50: Setwaveresolution#.# - Set The Wavelength Resolution
Feasa LED Spectrometer Set Data Mode SetWaveResolution#.# - Set the wavelength resolution Transmit Receive SetWaveResolution#.# PutWaveResolution#.# Where: represents the wavelength resolution and is a value in the range 0.1nm – 9.9nm. Description This command allows the user to adjust the wavelength resolution of the spectrum to be measured. -
Page 51: Setbaud - Change The Baud Rate
The command getbaud will return the set baud rate. It can also be seen on the comment section of the Feasa terminal window. Test times are improved by increasing the baudrate from the default to higher values and this can be further enhanced by decreasing the latency (windows default 16) to latency of 1. -
Page 52: Command Summary
Feasa LED Spectrometer Command Summary COMMAND DESCRIPTION Capture Capture LED Color and Intensity Data - Auto Range Capture##### Capture Colour and Intensity – specified Integration Time getAverage Get the value of the number of readings to average getCaptureTime Get the Integration time... -
Page 53: External Trigger Mode
Feasa LED Spectrometer Trigger Mode External Trigger Mode: The following pages list the commands that are required to implement the Trigger Function. These commands must be transmitted through the USB Port of the Spectrometer. The Feasa Terminal program can be used to perform this task. -
Page 54: Settriggertime##### - Set The Trigger Integration Time
Feasa LED Spectrometer Trigger Mode SetTriggerTime##### – Set the Trigger Integration Time Transmit Receive settriggertime##### Description This command sets the Integration time of the Trigger function. The Integration time is a 5 digit number and is specified in milliseconds. The minimum Integration time is 100 microseconds (0000001) and the maximum is 4 seconds. -
Page 55: Setaverage01 - Set The Number Of Measurements To 1
Feasa LED Spectrometer Trigger Mode SetAverage01 – Set the number of measurements to 1 Transmit Receive setaverage01 Description This command instructs the Spectrometer to set the number of measurements to 1. In order for the Trigger function to operate within the Integration time the Average must be set to 01. -
Page 56: Measurement Sequence
Feasa LED Spectrometer Trigger Mode Measurement Sequence Enabletrigger ! send command to the spectrometer ! responses from the spectrometer settriggertime00025 setaverage01 High-to-low transition on the Trigger input Pin 1 Capturing..getluminousflux 0005.018 lm getcct 04621 +0.0340 Trigger Error Messages OverRange This message is displayed if the Spectrometer is saturated by too much light. -
Page 57: Daisy Chain Setup
Feasa LED Spectrometer Daisy Chain Mode Daisy Chain Setup: Connecting the Patch Cord to the Spectrometer Remove the protective end caps from the patch cord. Using the surface cleaner sachet wipe provide, clean both ends. This wipe is suitable for one time use only. - Page 58 Feasa LED Spectrometer Daisy Chain Mode Using the Daisy Chain cable provided, connect the OUT port of the 1st Spectrometer to the IN port of the 2nd Spectrometer. Connect the OUT port of the 2nd Spectrometer to the IN port of the 3 Spectrometer.
- Page 59 Feasa LED Spectrometer Daisy Chain Mode Each Spectrometer except the first (master) Spectrometer must be powered by 5V DC@200mA. A power cable (LA-PWR-02) is supplied with each Spectrometer. Power and communication are supplied to the first (master)Spectrometer via USB. Therefore, no power cable is required for this Spectrometer.
- Page 60 Feasa LED Spectrometer Daisy Chain Mode NOTE: Before attempting to use the Daisy Chain Mode please ensure the Spectrometers are connected and powered as per the steps outlined above. Understanding the Daisy Chain Bus Daisy chaining is a method used to communicate with multiple LED Spectrometers via a single computer port.
-
Page 61: Setup Spectrometer No 1 / Master
Feasa LED Spectrometer Daisy Chain Mode Setup Spectrometer No 1 / Master 1.00 Open the Feasa Terminal Program. (version 2.7.0 or greater) 1.01 Using the drop down menu located on the top toolbar, select the ‘DaisyChain On’ option. 1.02 Enter the 4 digit Serial of the first (master) Spectrometer as prompted. - Page 62 Feasa LED Spectrometer Daisy Chain Mode 1.04 Cover the aperture of the SPxx sphere connected to the master Spectrometer. Ensure no light is entering the device. 1.05 In the Terminal command bar, type the command CAPTUREDARK and press the return key. An OK response is returned on completion of the capture dark.
- Page 63 Feasa LED Spectrometer Daisy Chain Mode 1.13 Determine a suitable fixed integration time for production. The auto capture command (CAPTURE) may be too slow to be used in production. To avoid this an individual, fixed integration time can be set on each Spectrometer.
-
Page 64: Setup Spectrometer No 2 / Slave No 1
Feasa LED Spectrometer Daisy Chain Mode Setup Spectrometer No 2 / Slave No 1 2.00 Type the command BUSFREE in the command bar and press the return key. An OK response is returned on completion. This command is used to deactivate any active Spectrometers on the Daisy Chain bus. - Page 65 Feasa LED Spectrometer Daisy Chain Mode 2.03 Cover the aperture of the SPxx sphere connected to the second (slave1) Spectrometer. Ensure no light is entering the device. 2.04 Type the command CAPTUREDARK in the command bar and press the return key. An OK response is returned on completion of the capture dark.
- Page 66 Feasa LED Spectrometer Daisy Chain Mode 2.11 Determine a suitable fixed integration time for production. The auto capture command (CAPTURE) may be too slow to be used in production. To avoid this an individual, fixed integration time can be set on each Spectrometer.
-
Page 67: Setup Spectrometer No 3 / Slave No 2
Feasa LED Spectrometer Daisy Chain Mode Setup Spectrometer No 3 / Slave No 2 3.00 Type the command BUSFREE in the command bar and press the return key. An OK response is returned on completion. This command is used to deactivate any active Spectrometers on the Daisy Chain bus. - Page 68 Feasa LED Spectrometer Daisy Chain Mode 3.03 Cover the aperture of the SPxx sphere connected to the second (slave2) Spectrometer. Ensure no light is entering the device. 3.04 Type the command CAPTUREDARK in the command bar and press the return key. An OK response is returned on completion of the capture dark.
- Page 69 Feasa LED Spectrometer Daisy Chain Mode 3.11 Determine a suitable fixed integration time for production. The auto capture command (CAPTURE) may be too slow to be used in production. To avoid this an individual, fixed integration time can be set on each Spectrometer.
-
Page 70: Summary Of Setup Procedure
Feasa LED Spectrometer Daisy Chain Mode Summary of Setup Procedure Master Spectrometer: Open Feasa Terminal. Turn Daisy Chain mode ON. Press Connect. When prompted, enter the serial number of the first (master) Spectrometer. Enter the GETSTATUS command to verify active Spectrometer. -
Page 71: Operating The S2 Spectrometer In Daisy Chain Mode
Feasa S2 Spectrometer using the daisy chain function. As an example, a Daisy Chain bus of 3 x S2 Spectrometers will be used. There are 3 Spectrometers in the example bus: 1 x Master unit (example serial number S301) ... -
Page 72: Capture The Bus
Place the Sphere over the Leds to be tested. When the parts are powered up, light will enter the SPxx Spheres. A capture can now be made. In the command line bar in the Feasa Terminal program, enter the command BUSFREE. An OK response is returned. - Page 73 Spectrometer is returned. NOTE: A wide range of ‘GET’ commands are available. These can be used to retrieve measurement data from the Feasa Spectrometer. Poll the second (slave1) Spectrometer to verify the Capture has completed. To do this: Enter the command BUSCES302.
- Page 74 Type the command GETXY in the command bar and press the return key. An XY chromaticity value for the active Spectrometer is returned. NOTE: A wide range of ‘GET’ commands are available. These can be used to retrieve measurement data from the Feasa Spectrometer. Back to Index...
-
Page 75: Specifications
Feasa LED Spectrometer Specifications OPTICAL Spectral Range 380nm to 780nm Resolution 0.1nm Integration Time 100µsec to 4sec ACCURACY Luminous Flux 10% (with calibrated Integrating Sphere) Power (Watts) xy Chromaticity ±0.005 Peak Wavelength ±1nm REPEATABILITY Wavelength ±0.5nm Chromaticity xy ±0.0007 Intensity <... -
Page 76: Ordering Information
Part No.: SP13, SPL3, SP14, SP16 SP23, SP24, SP25, SP26 SP8025, SP8035, SP8045 Feasa Luminance Head Part No: LU01, LU02, LU04, LU07 Feasa Luminous Intensity Head Part No: CD02, CD04, CD08 Feasa Patch Cord Part No: FP02 Back to Index... -
Page 77: Error Messages
Feasa LED Spectrometer Error Messages OverRange This message is displayed if the Spectrometer is saturated by too much light. This can occur with very bright LEDs or if the Custom Exposure Time is too long. If the Enable Custom Exposure Tick-Box is selected then set the exposure value to the minimum value of 100 uSec and try again. -
Page 78: Warranty
3. Feasa does not warrant that the operation of Feasa products will be uninterrupted or error free. If Feasa is unable, within a reasonable time, to repair or replace any product to a condition as warranted, customer will be entitled to a refund of the purchase price upon prompt return of the product to Feasa.
Need help?
Do you have a question about the S2 and is the answer not in the manual?
Questions and answers