Table of Contents
Advertisement
Quick Links
Advertisement
Table of Contents

Related Manuals for Heal Force Real-Time PCR


Summary of Contents for Heal Force Real-Time PCR
- Page 1 Real-Time PCR Detection System User Manual (For X960A/X960B)
-
Page 2: Table Of Contents
Contents Introduction P3 How to use this manual Instructions on Safety and Use P4 Considerations for Use Section I - Instrument Installation P6 Locating the Instrument P8 Installation of Instrument P9 Connection of Instrument Section II - Instrument Appearance and Internal Components P10 Overview P11 Construction &... - Page 3 Section V - Test Introduction and Description P33 Software Connection to Instrument P34 New Project File P40 Specific Test Procedure P50 Test Considerations Section VI - Other Function Introduction P52 Grade Calculation and Retrieval P53 Auxiliary TM Value Calculator P54 Logs Recording and Retrieval P55 Other Internal Operational Functions...
-
Page 4: P3 How To Use This Manual
Introduction How to use this manual About this manual This manual is intended to solve your any question and technical problem in installation, operation and maintenance of this equipment, and provides instructions on proper installation, use and maintenance of this instrument. Safety Cautions Before installation, use and maintenance of this instrument, read and observe any cautions and considerations in this guide to ensure normal operation of the equipment and user's... -
Page 5: Instructions On Safety And Use
Instructions on Safety and Use Considerations for Use Operation Safety ● The power supply for this instrument must be earthed reliably. A three-pole plug is provided for this instrument, with the additional pole connected to earthing wire, which shall be used with an earthed power socket. Before connecting power supply, ensure it meets the voltage requirement for this instrument, and make sure rated load of the power socket is not lower than the load requirement for this instrument. - Page 6 enter the instrument to prevent any damage to it. ● Immediately switch off the power supply, stop test and contact your supplier or any professional service personnel in any of the following cases: 1) Any reagent, water or other liquid enters the instrument. 2) The instrument falls down from an elevation or the enclosure is damaged.
-
Page 7: Section I - Instrument Installation
Section I - Instrument Installation Locating the Instrument This instrument must be located properly after being unpacked. Place the packing case upright in horizontal position, cut off the packing strip around the case and the adhesive tape sealing the case. Take out the accessories of the case and store them in a secure place for future use. - Page 8 Risk of personal injury! Unless you have been trained properly, do not attempt to lift the instrument or any heavy component of it. Lifting the packing case in any improper way may cause ache in or permanent injury to body, or fall of the instrument. Lift or move the instrument with proper handling tool or in a correct way.
-
Page 9: P8 Installation Of Instrument
Installation of Instrument Place the instrument on a testing platform and then take out the power cable provided along with it. Connect the power cable by inserting the plug at one end of the cable into the socket at the rear of the instrument, and inserting the plug at the other end into a power socket earthed properly. -
Page 10: P9 Connection Of Instrument
Connection of Instrument Connect PC to the instrument Connect laptop to the instrument... -
Page 11: Section Ii - Instrument Appearance And Internal Components
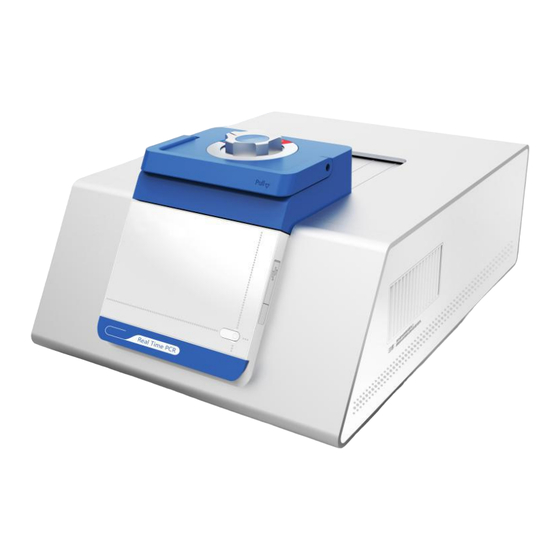
Section II - Instrument Appearance and Internal Components Overview ① Knob ② Lid ③ Handle ④ USB Port ⑤ Pad Tray ⑥ Operation Indicator LED ⑦ Power Switch ⑧ Power Socket & Fuse ⑨ Air Outlet ⑩ 232 Interface ⑪ LAN Port ⑫... - Page 12 Construction & Function The lid is operated with a sliding guide to a range as customized by the user. As shown in the figure at the right side, you switch the knob to the point UNLOCK and slide the lid backwards to load the test tube into the instrument, and then close the lid by sliding it forwards and switch the knob to a proper...
- Page 13 Turn pad tray down clockwise to a position at an angle of 90° to the enclosure to open the tray, and then place a pad on the tray. For this instrument, the tray moves in a range between 0°~90° to the enclosure; do not move the tray out of this range to prevent damage to the instrument.
- Page 14 To ensure a safe and reliable testing procedure, place this instrument on a flat platform, and reserve areas of at least 30cm wide around the four sides of it, so as to make sure proper ventilation heat dissipation. Do not place any object (e.g. paper, plastic film) at the air inlet to prevent it from being absorbed in and thereby permanent damage to the fan or...
-
Page 15: Performance Properties
Section III - Instrument Description and Performance Properties Instrument Description [Product Name] Real-time fluorescence quantitative PCR unit [Product Model] X960A X960B [Construction] It consists of power module, control module, driver module, display module, heated lid module, sample base module, camera module, light source module, and optical fiber module. - Page 16 Instrument Performance Indicators Product Name: Real-Time Fluorescence Dosing PCR Unit Product Model: X960A X960B Compatible OS: Windows XP/VISTA/Windows 7 Bits: 32/64 32/64 Minimum Memory: 512M 512M Display Unit: 256MB 256MB CPU: Pentium IV 1.6GHZ or higher Overall Dimensions: 590mm (L)*442mm (W)*285mm (H) Weight: 28.5kg 28.7kg...
- Page 17 Heating Rate: ≥5℃/s (45℃—99℃) ≥5℃/s (45℃—99℃) Cooling Rate: ≥5℃/s (45℃—99℃) ≥5℃/s (45℃—99℃) At constant 95 ℃ within At constant 95 ℃ within Temperature Control 10s:±0.4℃ 10s:±0.4℃ Uniformity: at constant 55 ℃ within at constant 55 ℃ within Temperature Accuracy: ≤±0.1℃ (45℃≤T≤95℃) ≤±0.1 ℃...
-
Page 18: Section Iv - Use And Installation Of Software
Section IV - Use and Installation of Software Installation Instructions Preparations Items to be prepared: instrument, PC, and connecting wires Installation Environment Note: A genuine edition of windows XP/VISTA/7/10 shall be used, or otherwise any compatibility error may occur. Shut down any anti- virus software running in the computer during installation to prevent any false alarm (which shall be ignored if occurring). - Page 19 Computer Setting (Win 7) Display Setting: 1. Navigate to Start > Control Panel. Select "Power Options" in Control Panel. Select "Change when the computer sleeps" in the window...
- Page 20 4. Select "Never" under "Turn off the display" in the window Select "Never" under "Put the computer to sleep". 5. Return to the window in Step 3 and click on "Personalization" button.
- Page 21 6. Click on "Screen Saver" at the lower right corner. Single click 7. Select "None" from the drop down list in the dialog box.
- Page 22 Start Installation Step 1: Access the setup package from the flash disk provided. Step 2: Double click on the setup file and choose a proper installation language. Step 3: Read the pre-installation instructions. Step 4: Choose a destination folder to install the program.
- Page 23 Step 5: Choose name of the folder to be created under start menu. Step 6: Choose whether to create a shortcut on desktop. Step 7: Confirm any information before installation Step 8: Install the program.
- Page 24 Step 9: Finish the setup wizard, and check whether RealGen is running; check the option and click on Finish. Step 10: Open page of RealGen. Step 11: Click on Yes for automatic connection. Step 12: If it is indicated that there is no available computer to connect, check whether the computer has been started and the network is operated...
- Page 25 Overview of User Interface Interface Overview Toolbar - File: Load Test: Load a finished test file for display and analysis. Export Test: Export a finished test for data storage. Load Project: Load a finished project file to start a test. Export Project: Export a loaded project for data storage.
- Page 26 Toolbar - Control: Disconnect: Disconnect the program from the instrument Connect: Manually connect the program to the instrument by entering its IP address (the default is "192.168.1.6”"). Pause: Pause operation of the project, which will be resumed in 5 minutes if no operation has been performed.
- Page 27 Project Wizard Interface: New Project: Create a new project for test. Project Management: Open a project list and manage any project in it, and operate or modify a project. Open Test File: Open a test file list and manage any test file, and load or delete a file. Instrument List: Open an instrument list, and connect or rename any instrument in it.
- Page 28 New Project = Basic Settings Project Name: Name the project to be saved. Creator: Specify a creator for the project, and save it by pressing ENTER. This option can be left blank. Reviewer: Specify a reviewer for the project, and save it by pressing ENTER. This option can be left blank.
- Page 29 Channel Selection: Select channels required for current test. At least one channel is required. Cross-Interference: Call cross-interference setting page to compensate interference between multi-channel tests. General Settings: Call general setting page to perform some basic settings.
- Page 30 New Project - Sample Settings Import: Import sample settings saved already. Export: Export any sample information edited already for test next time. Standard: Mark a certain hole position as Standard for a known concentration. This option should be used along with sample concentration. Negative: Negative comparison type Positive:...
- Page 31 Gene Name: Identify the project for the hole position Sample Name: Identify the sample for the hole position Housekeeping Gene: Identify housekeeping gene for current test Standard Sample: Identify standard sample in contrast group for current test Project Group: Divide projects into different groups...
- Page 32 New Project - Sample Settings Import: Import any program setting file saved already Export: Export a program setting file edited currently Low-Temperature Storage: For storage at low temperature upon completion of test Solution Curve: Enable solution curve function Save: Save current project file upon completion of test Operate: Operate any project file saved when the instrument is connected and idle.
- Page 33 Analysis Interface Introduction It is used for analysis of test result after completion of test, including baseline setting, threshold analysis, outcome analysis, solubility curve, and quantitative analysis.
- Page 34 Section V - Test Introduction and Description Software Connection to Instrument Step 1: Power the instrument on, and connect it to a PC by cabled or wireless means. Open the program when the instrument beeps, and the following information should displayed.
- Page 35 New Project File Click on New Project in project wizard dialog box. Enter basic setting page. Choose and enter proper settings and then click on Next.
- Page 37 As required by the test, choose and mark desired hole positions for each test type. In case of absolute quantitative test, hole position must be marked, or otherwise standard curve will be unavailable, and there are at least three standard samples in gradient. You may import any existing hole setting file.
- Page 38 In case of relative quantitative test, gene and sample for each desired hole shall be identified, and housekeeping gene and reference sample shall be marked for the test. When necessary, project groups can be identified for distinction. Upon completion, click on Next...
- Page 39 Button Function Description: Add a temperature point Change parameters for the temperature point chosen Set the selected temperature point as cycle start point Set the selected temperature point as cycle end point Delete a temperature point chosen Change cycle number. Change or specify cycle number by dragging from a temperature point to an end point.
- Page 40 Temperature: Temperature set for a temperature point. Time: Duration for a temperature point Temperature variation: Increase temperature variation for each cycle, which will be reflected to the point in each cycle. Gradient Width: Modular gradient can be used, and the whole module temperature will be distributed in gradient.
- Page 41 Created or changed temperature control program. The small blue point indicates the fluorescence strength in the agent finally collected at current temperature point. Import existing temperature control program export a compiled temperature control program Set whether low-temperature storage is enabled and the storage temperature. This option is disabled by default.
- Page 42 Specific Test Procedure Locate reagent First align the mark on the knob with point unlock, and then slide heated lid to put sample reagent into Hole 96 and then close the lid; rotate the knob clockwise to a proper position to run the program for testing.
- Page 43 Running Program A project file can be run by either of two ways: 1.Click on Control > Run to run a project file saved in a folder. 2.Choose project management in project wizard and then choose the target program and right-click on Run. After being started, the software module will display module information, lid information and estimated time.
- Page 44 After being started, the software module will display the increasing fluorescence variation for current project. When solubility curve is contained in the project, the software module will display current temperature variation. When solubility curve is contained in the project, the software module will display current fluorescence variation.
- Page 45 To view detailed output data for the fluorescence point, move the cursor to a point on the curve to pop up a box indicating detailed parameters. Upon completion of test, the test file will be automatically saved to the directory as set for the project. Test results are classified into result with CT value, absolute quantitative result with standard curve, relative...
- Page 46 Test Analysis Operations Principle and Application of Quantitative PCR Real-Time Quantitative PCR is a method which adds fluorescence radical to PCR reaction system and perform real-time monitor of the whole PCR process by using fluorescence signals, and carry on quantitative analysis on the unknown template through s standard curve.
- Page 47 In analysis interface logarithm curve, logarithm curve drawing is available and baseline can be re-positioned to achieve a more suitable CT value. Baseline Baseline is a straight line along which fluorescence signals vary slightly in the first several cycles of PCR amplification reactions. In analysis interface, you can choose different channels, and make analysis by manually...
- Page 48 In this table you can view CT and TM values of a certain curve and other result information. CT Value Means the cycles which fluorescence signals in each PCR reaction tube undergo to reach the Threshold value as set. According to a research, CT value of each template is in a linear relation to the logarithm of initial copies of this template.
- Page 49 Absolute Quantitative Analysis - Standard Curve: Absolute Quantitative Analysis is available when standard samples are contained in test analysis and proper concentration in three or more gradients has been set for them. The standard curve can be imported or exported in the interface. Parameters Related to Standard Curve Standard samples are required in real-time absolute quantitative PCR test.
- Page 50 Relative Quantitative Analysis - Analysis Method: As the most classic relative quantitative analysis, it is mostly used in release of test report or result. Relative quantitative analysis is available when gene and sample names are specified in test analysis and housekeeping gene and standard samples have been set.
- Page 51 Absolute light intensity in solubility analysis: Where solubility test is contained in initial test, the software will draw absolute light intensity for current solubility test, and the testing personnel will visually observe variation of fluorescence intensity during test. Relative light intensity in solubility analysis: As determined from the absolute light intensity above, fluorescence value variation trend is...
- Page 52 Instructions on Amplification Curve Determine whether an amplification curve is acceptable based on the following: Clear knee points, particularly distinctive low-concentration sample exponential phase. Parallel amplification curve as a whole, flat baseline without rise, and distinctive low-concentration sample exponential phase. Slope of exponential phase in direct proportion to amplification efficiency - the more slope, the higher amplification efficiency.
- Page 53 ● Suction head used in test shall be put in waste jug containing sodium hypochlorite of 1%, and reject it after sterilization with other waste. ● The test platform and all test appliances shall be disinfected with sodium hypochlorite of 1%, alcohol of 75% or UV lamp. ●...
- Page 54 Section VI - Other Function Introduction Grade Calculation and Retrieval About Grade Functions Click on "Grade" from main menu to access View Grade page. For convenience of user, the software provides a grade table for user's retrieval. Upon entry of central temperature and gradient width, the software will automatically calculate specific temperature value for each column and helps to ensure accurate test result.
- Page 55 Auxiliary TM Value Calculator About TM Value Calculation Click on "TM" from main menu to access TM Calculation page. Enter a value and then click on "Calculate" to output the result. The program is furnished with an embedded TM value calculator for user's access when necessary.
- Page 56 Logs Recording and Retrieval About Logs Click on "Logs" from the main menu to access Logs page and view test operation logs. Facilitate management of test history records by user and retrieval of related test history records.
- Page 57 Other Internal Operational Functions Chinese-English Toggle Button Click on Tool > Chinese or English to change the language. Load test data. Click on “File > Load Test” in main menu. In the popup dialog box, select the target data (in format of .jgtest) stored previously to load.
- Page 58 After loading the data, you can perform relate test analysis on the loaded data. Real-Time Modification to Operation Parameters During operation of the program, double click on a temperature segment to modify a parameter in the popup dialog box. Modification can be made only by double clicking on a temperature segment currently not in operation, or otherwise a message box will...
- Page 59 Manufacturer: Heal Force Group - Hangzhou Jingle Scientific Instrument Company Limited Address: Floor 4, Building #1, 16, the Third Xiyuan Road, Sandun Town, Xihu District, Hangzhou, Zhejiang Province Telephone: (0571)89905515 Facsimile: (0571)89905515 - 802 Postal Code: 310000 Email:shanghai@healforce.com Web: www.healforce.com...
Need help?
Do you have a question about the Real-Time PCR and is the answer not in the manual?
Questions and answers