Table of Contents
Advertisement
Quick Links
Cell Master
MT8212B
An Integrated, Handheld Multi-function Base Station Test Tool for
Greater Flexibility and Technician Productivity
S331D
Site Master
SiteMaster
MS2712
MS2711D
SiteMaster
SpectrumMaster
Spectrum Master
SpectrumMaster
MS2712
MT8212A
Cell Master
CellMaster
MS2712
CellMaster
™
User's Guide
Advertisement
Table of Contents

Related Manuals for Anrtisu Cell Master MT8212B


Summary of Contents for Anrtisu Cell Master MT8212B
- Page 1 Cell Master ™ MT8212B An Integrated, Handheld Multi-function Base Station Test Tool for Greater Flexibility and Technician Productivity S331D Site Master SiteMaster MS2712 MS2711D Spectrum Master SpectrumMaster MS2712 MT8212A Cell Master CellMaster MS2712 User’s Guide SiteMaster SpectrumMaster CellMaster...
- Page 2 WARRANTY The Anritsu product(s) listed on the title page is (are) warranted against defects in materials and workmanship for one year from the date of shipment. Anritsu's obligation covers repairing or replacing products which prove to be defec- tive during the warranty period. Buyers shall prepay transportation charges for equipment returned to Anritsu for warranty repairs.
- Page 4 For Chinese Customers Only YLYB...
-
Page 6: Table Of Contents
Table of Contents Chapter 1 - General Information Introduction ........1-1 Description . - Page 7 Chapter 3 - Getting Started Introduction ........3-1 Power On Procedure .
- Page 8 Chapter 8 - High Accuracy Power Meter Introduction ........8-1 Power Measurement .
- Page 9 Chapter 15 - Interference Analyzer Mode Introduction ........15-1 Interference Analysis .
-
Page 10: Chapter 1 - General Information
Chapter 1 General Information Introduction This chapter provides a description, performance specifications, optional accessories, pre- ventive maintenance, and calibration requirements for the Cell Master™ model MT8212B. Throughout this manual, the term Cell Master will refer to the MT8212B. Model Frequency Range MT8212B Cable and Antenna Analyzer Mode: 25 to 4000 MHz... -
Page 11: Printers
Chapter 1 General Information Option 43 cdmaOne/ CDMA2000 1xRTT Demodulator · Option 50 T1/E1 Analyzer · Option 62 EVDO - RF Measurements · Option 63 EVDO Demodulator · Printers The following printers and printer accessories can be used with the MT8212B Cell Master: 2000-1214 HP DeskJet Printer, Model 450 w/Interface Cable, Black Print ·... -
Page 12: Optional Accessories
Chapter 1 General Information Optional Accessories Part Number Description 1N50C Limiter, N(m) to N(f), 50W, 10 MHz to 18 GHz 42N50-20 Attenuator, 20 dB, 5 Watt, DC to 18 GHz, N(m)-N(f) 42N50A-30 Attenuator, 30 dB, 50 Watt, DC to 18 GHz, N(m)-N(f) SC7179 Variable Attenuator, DC to 2 GHz, 0~90 dB, N(m)-N(f) ICN50... - Page 13 Battery Charger, NiMH, w/ Universal Power Supply 40-168 AC/DC Adapter 806-141 Automotive Cigarette Lighter/12 Volt DC Adapter 800-441 Serial Interface Cable 2300-347 Software Tools 10580-00089 Cell Master MT8212B User’s Guide 10580-00106 Cell Master MT8212B Programming Manual 10580-00107 Cell Master MT8212B Maintenance Manual...
- Page 14 Chapter 1 General Information Optional Accessories, continued Power Monitor (Option 5) RF Detectors The Anritsu 5400 and 560 Series Detectors use zero-biased Schottky diodes. Measurement range is –55 dBm to +16 dBm using single cycle per sweep AC detection, auto-zeroing with DC detection during the frequency sweep.
-
Page 15: Performance Specifications
Chapter 1 General Information Performance Specifications Performance specifications are provided in Table 1-1. All specifications apply when cali- brated at ambient temperature after a five minute warm up. Typical values are given for ref- erence, and are not guaranteed. Table 1-1. Performance Specifications (1 of 7) Cable and Antenna Analyzer Frequency Range:... - Page 16 Chapter 1 General Information Table 1-1. Performance Specifications (2 of 7) Sweep Time: £1.3 seconds, full span; £ 50 mseconds to 20 seconds, zero span Resolution Bandwidth (–3 dB): 100 Hz to 1 MHz in 1-3 sequence ± 5% Accuracy Video Bandwidth (–3 dB): 3 Hz to 1 MHz in 1-3 sequence ±...
- Page 17 Chapter 1 General Information Table 1-1. Performance Specifications (3 of 7) Bias Tee (Option 10A) Voltage: +12 to +24 Vdc (variable in 1V steps) Power Maximum: 6W, steady state High Accuracy Power Meter (Option 19, with PSN50 Power Sensor) Sensor: Measurement Range: –30 to +20 dBm Frequency Range:...
- Page 18 Chapter 1 General Information Table 1-1. Performance Specifications (4 of 7) Dynamic Range: 80 dB, 25 MHz to 2 GHz 60 dB, >2 GHz to 3 GHz Output Impedance: Interference Analysis (Option 25) Audible tone - identify interference type Strength of the Interferer RSSI Spectrogram Channel Scanner (Option 27)
- Page 19 Chapter 1 General Information Table 1-1. Performance Specifications (5 of 7) EVDO: Idle and active power versus time graph cdmaOne and CDMA2000 1xRTT Demodulator (Option 43) Residual Rho: ³0.98 for RF input from +20 dBm to –48 dBm Rho Accuracy: ±0.01 for r ³0.9 Code domain power (CDP): Accurate to within ±1.5 dB above –20dB for RF input...
- Page 20 Chapter 1 General Information Table 1-1. Performance Specifications (6 of 7) DS0 Channel Access Tone Generator Frequency: 100 Hz to 3000 Hz Level: –30 to 0 dBm, 1 dB steps Audio Monitor: Manually select channel 1-24 VF Measurement: Frequency: 100 Hz to 3000 Hz, ±2 Hz Level: –40.0 to +3.0 dBm, ±0.2 dBm ITU-T G.821 Analysis: Errored seconds, error free seconds, severely errored...
- Page 21 Chapter 1 General Information Table 1-1. Performance Specifications (7 of 7) ITU-T G.821 Analysis: Errored seconds, error free seconds, severely errored seconds, unavailable seconds, available seconds, degraded minutes EVDO Demodulator (Option 63) Rho Accuracy: ±0.02 for 0.9<r<1 Code Domain Power Display: Demodulation from –80 dBm to +15 dBm Code Domain Power (CDP): ±1 dB when >...
-
Page 22: Preventive Maintenance
Chapter 1 General Information Preventive Maintenance Cell Master preventive maintenance consists of cleaning the unit and inspecting and clean- ing the RF connectors on the instrument and all accessories. Clean the Cell Master with a soft, lint-free cloth dampened with water or water and a mild cleaning solution. -
Page 23: Instacal Module
Chapter 1 General Information InstaCal Module The Anritsu InstaCal module can be used in place of discrete components to calibrate the Cell Master. The InstaCal module can be used to perform an Open, Short and Load (OSL) or a FlexCal calibration procedure. Calibration of the Cell Master with the InstaCal takes approximately 45 seconds (see Calibration, page 3-2). - Page 24 Chapter 1 General Information Table 1-2. Anritsu Service Centers UNITED STATES GERMANY SOUTH AFRICA ANRITSU COMPANY ANRITSU GmbH ETECSA 490 Jarvis Drive Konrad-Zuse-Platz 1 12 Surrey Square Office Park Morgan Hill, CA 95037-2809 Muenchen 81829 330 Surrey Avenue Telephone: (408) 776-8300 Germany Ferndale, Randburg, 2194 FAX: 408-776-1744...
-
Page 25: Chapter 2 - Functions And Operations
Chapter 2 Functions and Operations Introduction This chapter provides a brief overview of the Cell Master functions and operations, provid- ing the user with a starting point for making basic measurements. For more detailed infor- mation, refer to the specific chapters for the measurements being made. The Cell Master is designed specifically for field environments and applications requiring mobility. - Page 26 Chapter 2 Functions and Operations Battery Illuminates when the battery is being charged. The indicator automatically shuts Charging LED off when the battery is fully charged. External Illuminates when the Cell Master is being powered by the external charging Power LED unit.
-
Page 27: Display Overview
Chapter 2 Functions and Operations Display Overview Figure 2-2 illustrates some of the key information areas of the MT8212B display in cable and antenna analyzer modes. TITLE BAR SWEEP DATA TIME POINTS CALIBRATION STATUS CURRENT MENU MESSAGE AREA Figure 2-2. MT8212B Distance-To-Fault Display Overview Figure 2-3 illustrates some of the key information areas of the MT8212B display in Spec- trum Analyzer mode. -
Page 28: Front Panel Overview
Chapter 2 Functions and Operations Front Panel Overview The Cell Master menu-driven user interface is easy to use and requires little training. Hard keys on the front panel are used to initiate function-specific menus. There are four function hard keys located below the status window: Mode, Frequency/Distance, Amplitude and Measure/Display. -
Page 29: Function Hard Keys
Chapter 2 Functions and Operations Function Hard Keys MODE Opens the mode selection box (below). Use the Up/Down arrow key to select a mode. Press the key to implement. ENTER Measurement Mode Freq - SWR Return Loss Cable Loss - One Port DTF - SWR Return Loss Power Monitor (External Detector) -
Page 30: Keypad Hard Keys
Chapter 2 Functions and Operations Keypad Hard Keys This section contains an alphabetical listing of the Cell Master front panel keypad controls along with a brief description of each. More detailed descriptions of the major function keys follow. The following keypad hard key functions are printed in black on the keypad keys. These keys are used to enter numerical data as required to setup or per- form measurements. -
Page 31: Soft Keys
Chapter 2 Functions and Operations The following keypad hard key functions are printed in blue on the keypad keys. This key is used to adust the brightness of the color display. Use the Up/Down arrow key and ENTER to adjust the display brightness. AUTO Automatically scales the status window for optimum resolution in cable SCALE... -
Page 32: Cable And Antenna Analyzer Mode
Chapter 2 Functions and Operations Cable and Antenna Analyzer Mode The following section explains the hard keys and soft keys available when the Cell Master is set to cable and antenna analyzer mode. MODE=Return Loss: FREQ/DIST AMPLITUDE MEAS/DISP Resolu- SOFTKEYS: tion Single Bottom... - Page 33 Chapter 2 Functions and Operations FREQ/DIST AMPLITUDE MODE=DTF: MEAS/DISP Resolu- SOFTKEYS: tion Single Bottom Sweep Trace DTF Aid Math Trace Overlay Fixed More On/Off Loss Select Trace Prop Cable List Window Page Page Back Down Back Bottom List Delete Trace Delete Traces Figure 2-7.
- Page 34 Chapter 2 Functions and Operations FREQ/DIST Displays the frequency and distance menu depending on the measurement mode. Frequency The frequency and distance menu for cable and antenna analyzer measurements Menu provides for setting sweep frequency end points when mode is selected. Se- Freq lected frequency values may be changed using the keypad or Up/Down arrow key.
- Page 35 Chapter 2 Functions and Operations ues for Relative Propagation Velocity and Nominal Attenuation in dB/m or dB/ft @ 1000 MHz, 2000 MHz and 2500 MHz.) The custom cable folder can consist of up to 49 user-defined cable parameters uploaded via the Handheld Software Tools program.
- Page 36 Chapter 2 Functions and Operations MARKER Choosing MARKER in cable and antenna analyzer freq and dist mode causes the soft keys, below, to be displayed and the corresponding values to be shown in the message area. Selected frequency marker or distance marker locations may be changed using the keypad or Up/Down arrow key.
- Page 37 Chapter 2 Functions and Operations — Opens the selected marker parameter for data entry. Press Edit ENTER when data entry is complete or ESCAPE to restore the pre- vious value. — Places the selected marker at the peak be- Peak Between M3 & M4 tween marker M3 and marker M4.
- Page 38 Chapter 2 Functions and Operations In cable and antenna analyzer mode, pressing the SYS key displays the follow- ing System menu soft key selections: System Options Application Options Clock Self Test Printer Mode Hour Status Units Minute Change Date Format Language Month English...
- Page 39 Chapter 2 Functions and Operations — Enter the year (2003-2036) using the Up/Down arrow key or Year the keypad. Press ENTER when data entry is complete or ESCAPE to restore the previous value. — Returns to the top-level SYS menu. Back —...
-
Page 40: Spectrum Analyzer Mode
Chapter 2 Functions and Operations Spectrum Analyzer Mode The following section explains the hard keys and soft keys available when the Cell Master is set to Spectrum Analyzer mode. MODE=SPECTRUM ANALYZER: FREQ/DIST AMPLITUDE SOFTKEYS: Center Level Span Scale Edit Atten/ Start Preamp Shift... - Page 41 Chapter 2 Functions and Operations On/Off MODE = SPECTRUM ANALYZER: Select Method Standard Antenna MEAS/DISP Select Center Custom Freq Antenna SOFTKEYS: Band- Auto width Channel Trace Manual Span Zoom Measure Measure Back Auto Channel Hold Trigger Back Measure Manual Field Detec- Strngth tion...
- Page 42 Chapter 2 Functions and Operations FREQ/DIST Choosing FREQ/DIST in Spectrum Analyzer mode causes the soft keys, below, to be displayed and the corresponding values to be shown in the message area. ¾ Sets the center frequency of the Spectrum Analyzer. Enter a value Center using the Up/Down arrow key or keypad, press ENTER to accept, ESCAPE to restore previous value.
- Page 43 Chapter 2 Functions and Operations AMPLITUDE Choosing AMPLITUDE in Spectrum Analyzer mode causes the soft keys, below, to be displayed and the corresponding values to be shown in the message area. — Activates the amplitude reference level function. Valid refer- Ref Level ence levels are from +20 to –120 dBm.
- Page 44 Chapter 2 Functions and Operations — Returns to the previous menu level. Back — Activates a menu of trace related functions. Use the corresponding Trace soft key to select the desired trace function. — Displays and holds the maximum responses of the input sig- Max Hold nal.
- Page 45 Chapter 2 Functions and Operations — Allows selection of either % of power or dB Down. Method — Allows entry of the desired % of occupied bandwidth to be mea- sured. — Allows entry of the desired power level (dBc) to be measured. —...
- Page 46 Chapter 2 Functions and Operations — Select AM, Narrow Band FM (300 ms de-empha- AM/FM Demod sis), Wide Band FM (50 ms de-emphasis), USB or LSB. — Turns AM/FM Demodulation on or off. On/Off — Select either Demod Type FM Wide Band FM Narrow demodulation.
- Page 47 Chapter 2 Functions and Operations — Displays the closest channel to the marker fre- Marker To Channel quency in the edit box. Entering a different channel number will cause the marker to go to that channel. — Places the selected marker at the frequency with the Marker To Peak maximum amplitude value.
- Page 48 Chapter 2 Functions and Operations — Makes the center frequency of the Cell Marker Freq To Center Master equal to the frequency of the selected marker. — Places the selected marker at the fre- Peak Between M3 & M4 quency with the maximum amplitude value between marker M3 and marker M4.
- Page 49 Chapter 2 Functions and Operations — Returns to the previous menu. Back — Returns to the previous menu. Back — Set multiple user defined lower limits, and can be Multiple Lower Limits used to create a lower limit mask for quick pass/fail measurements. A lower limit will result in a failure when the data falls below the limit line.
- Page 50 Chapter 2 Functions and Operations In Spectrum Analyzer mode, pressing the SYS key displays the following Sys- tem menu soft key selections: System Options Application Options Clock Self Test External Printer Freq Hour Status Bias Units Minute Change Impedance Date Format Language Month...
- Page 51 Chapter 2 Functions and Operations — Returns to the top-level SYS menu. Back — Displays a menu of supported printers. Use the Up/Down arrow Printer key and ENTER key to make the selection. — Select the unit of measurement (metric or English). Units —...
- Page 52 Chapter 2 Functions and Operations — Pressing this soft key immediately changes the language used to Language display messages on the Cell Master status window. Choices are English, French, German, Spanish, Chinese, and Japanese. The default language is English. 2-28...
-
Page 53: Power Meter (Internal) Mode
Chapter 2 Functions and Operations Power Meter (Internal) Mode Selecting from the mode menu causes the soft keys, described be- Power Meter (Internal) low, to be displayed and the corresponding values shown in the message area. MODE=POWER METER: FREQ/DIST AMPLITUDE MEAS/DISP SOFTKEYS: Center... - Page 54 Chapter 2 Functions and Operations — Returns to the previous menu level. Back ¾ Opens a menu of soft keys used to select the signal stan- Signal Standard dard to be used. For more information on signal standards, refer to Appendix ¾...
- Page 55 Chapter 2 Functions and Operations In Power Meter mode, pressing the SYS key displays the following System menu soft key selections: System Options Application Options Clock Self Test External Printer Freq Hour Status Bias Units Minute Change Impedance Date Format Language Month English...
- Page 56 Chapter 2 Functions and Operations — Returns to the top-level SYS menu. Back — Displays a menu of supported printers. Use the Up/Down arrow Printer key and ENTER key to make the selection. — Select the unit of measurement (metric or English). Units —...
- Page 57 Chapter 2 Functions and Operations — Pressing this soft key immediately changes the language used to Language display messages on the Cell Master status window. Choices are English, French, German, Spanish, Chinese, and Japanese. The default language is English. 2-33...
-
Page 58: Power Monitor (External Detector) (Option 5)
Chapter 2 Functions and Operations Power Monitor (External Detector) (Option 5) Selecting from the mode menu causes the soft keys, de- Power Monitor (External Detector) scribed below, to be displayed and the corresponding values shown in the message area. MODE=POWER METER: AMPLITUDE SOFTKEYS: Units... - Page 59 Chapter 2 Functions and Operations In Power Monitor mode, pressing the SYS key displays the following System menu soft key selections System Options Clock Self Test Printer Hour Status Units Minute Change Date Format Language Month English On/Off Back Location Year Quality Back...
- Page 60 Chapter 2 Functions and Operations — Enter the year (2003-2036) using the Up/Down arrow key or Year the keypad. Press ENTER when data entry is complete or ESCAPE to restore the previous value. — Returns to the top-level SYS menu. Back —...
-
Page 61: High Accuracy Power Sensor Mode (Option 19)
Chapter 2 Functions and Operations High Accuracy Power Sensor Mode (Option 19) Selecting from the mode menu causes the soft keys, described High Accuracy Power Sensor below, to be displayed and the corresponding values shown in the message area. MODE=HIGH ACCURACY POWER SENSOR FREQ/DIST AMPLITUDE MEAS/DISP... - Page 62 Chapter 2 Functions and Operations — Changes the channel increment step size when the Channel Increment Up/Down arrows are used to select the channel number. ¾ Returns to the previous menu. Back AMPLITUDE Choosing the AMPLITUDE key causes the soft keys, below, to be displayed and the corresponding values to be shown in the message area or scale menu de- pending on the measurement mode.
-
Page 63: Transmission Measurement Mode (Option 21)
Chapter 2 Functions and Operations Transmission Measurement Mode (Option 21) Selecting from the mode menu causes the soft keys, described Transmission Measurement below, to be displayed and the corresponding values shown in the message area. MODE = TRANSMISSION MEASUREMENT FREQ/SPAN AMPLITUDE BW/SWEEP Band-... - Page 64 Chapter 2 Functions and Operations FREQ/DIST Pressing the FREQ/DIST key in Transmission Measurement mode activates a menu of frequency-related choices in the active function block. Use the corre- sponding soft key to select the desired function, explained below. Use the key- pad or Up/Down arrow key to change or enter values shown in the edit box.
- Page 65 Chapter 2 Functions and Operations AMPLITUDE Pressing AMPLITUDE in Transmission Measurement mode activates a menu of amplitude-related functions. — Activates the amplitude reference level function. A specific ref- Ref Level erence level can be entered using the keypad or Up/Down arrow key. Press ENTER to accept the reference level value.
- Page 66 Chapter 2 Functions and Operations MEAS/DISP Pressing MEAS/DISP in Transmission Measurement mode activates a menu of bandwidth- and sweep-related functions. Use the corresponding soft key to se- lect the desired function. — Activates a menu that allows the resolution and video Bandwidth bandwidths to be either coupled automatically to the span (Auto) or manually adjustable (Manual).
- Page 67 Chapter 2 Functions and Operations A ® B — Moves the currently displayed trace into the Trace B buffer. A - B ® A — Subtracts Trace B from Trace A and displays the result as Trace A. A + B ® A — Adds Trace B to Trace A and displays the result as Trace A.
- Page 68 Chapter 2 Functions and Operations — Places the selected marker at the frequency Peak Between M1& M2 with maximum amplitude value between marker M1 and M2. — Places the selected marker at the fre- Valley Between M1 & M2 quency with minimum amplitude value between marker M1 and M2. —...
- Page 69 Chapter 2 Functions and Operations — Selects whether the measurement will fail if the Upper / Lower Limit data is above the limit line or below the limit line, as indicated in the mes- sage area of the display. — Returns to the previous menu level. Back —...
- Page 70 Chapter 2 Functions and Operations In Transmission Measurement mode, pressing the SYS key displays the follow- ing System menu soft key selections: System Options Application Options Clock Self External Test Printer Freq Hour Status Bias Units Minute Change Impedance Date Format Language Month...
- Page 71 Chapter 2 Functions and Operations — Returns to the top-level SYS menu. Back — Displays a menu of supported printers. Use the Up/Down arrow Printer key and ENTER key to make the selection. — Select the unit of measurement (metric or English). Units —...
- Page 72 Chapter 2 Functions and Operations — Pressing this soft key immediately changes the language used to Language display messages on the Cell Master status window. Choices are English, French, German, Spanish, Chinese, and Japanese. The default language is English. 2-48...
-
Page 73: Interference Analyzer Mode (Option 25)
Chapter 2 Functions and Operations Interference Analyzer Mode (Option 25) The Interference Analyzer option provides several different ways to determine the nature and source of an interfering signal. Selecting from the mode menu Interference Analyzer causes the soft keys, described below, to be displayed and the corresponding values shown in the message area. - Page 74 Chapter 2 Functions and Operations Volume Speaker Tone On/Off MODE=INTERFERENCE ANALYZER: MEAS/DISP SOFTKEYS: Spectrum Back Spectro- gram Signal Strength Sweep Interval RSSI Time Span Signal Time Auto Interval Save Setup Time Cursor Span Freq Auto Band- Scale Measure Data width Time Cursor Log Data...
- Page 75 Chapter 2 Functions and Operations FREQ/DIST — Sets the frequency at the center of the display. Frequencies can be Center entered in units of GHz, MHz, kHz or Hz. When the center frequency is en- tered, the labeling below the grid shows the center frequency and the span in the most appropriate units based on the value.
- Page 76 Chapter 2 Functions and Operations — Sets the input attenuator manually from 0 to 51 dB. Choose a Manual value that does not overload the instrument. — Sets the value of the input attenuator so that it is dynamically Dynamic coupled to the input signal and turns the preamp on or off based on the overall signal conditions across the entire frequency range of the instru- ment.
- Page 77 Chapter 2 Functions and Operations — Time Span sets the total time that will be taken to fill the Time Span waterfall display, from 0 to 4320 minutes (72 hours). Enter the number us- ing the Up/Down arrow key or use the keypad and select the appropriate soft key for days, hours, minutes, seconds, milliseconds or microseconds.
- Page 78 Chapter 2 Functions and Operations Up/Down arrow key or use the keypad and select the appropriate soft key for minutes, seconds, or milliseconds. — Time Span sets the total duration of measurements. This Time Span value can be set from 1 minute to 7 days. A setting of zero (MANUAL ) can also be entered if no limit on the time span is desired.
- Page 79 Chapter 2 Functions and Operations — Returns to the previous menu level. Back — Detection brings up a group of choices that change how the Detection instrument deals with the multiple RF measurements that are made for each display point. —...
- Page 80 Chapter 2 Functions and Operations — Selects the M4 marker parameter and opens the Markers second level menu with M4 highlighted. — Turns off all markers. All Off — Press to access additional marker functions: More — Selects the M5 marker parameter and opens the M5 marker second level menu with M5 highlighted.
- Page 81 Chapter 2 Functions and Operations — Returns to the previous menu level. Back NOTE: If either marker M3 or marker M4 is off, the Peak and Valley functions above are executed across the entire span. LIMIT Pressing the LIMIT key activates a menu of limit related functions. Use the cor- responding soft key to select the desired limit function.
- Page 82 Chapter 2 Functions and Operations Next Segment — Edit or view the parameters of the next segment. If the next segment is off when this button is pressed, the starting point of the next segment will be set equal to the ending point of the current segment (if the current segment is on).
- Page 83 Chapter 2 Functions and Operations — Enter the minute (0-59) using the Up/Down arrow key or Minute the keypad. Press ENTER when data entry is complete or ESCAPE to restore the previous value. — Enter the month (1-12) using the Up/Down arrow key or the Month keypad.
- Page 84 Chapter 2 Functions and Operations — In cable and antenna analyzer freq or dist measurement mode, dis- Status plays the current instrument status, including calibration status, temperature, and battery charge state. Press ESCAPE to return to operation. GPS — Opens the GPS soft key menu. Press the soft key to turn the GPS feature on or off.
-
Page 85: Channel Scanner Mode (Option 27)
Chapter 2 Functions and Operations Channel Scanner Mode (Option 27) The Channel Scanner option provides the choice of a bar graph or a text display showing the amplitude of selected channels for a given air interface standard. The interface settings can be manually entered if none of the available air interface standards meet the measure- ment need. - Page 86 Chapter 2 Functions and Operations the appropriate soft key for Hz, kHz, MHz or GHz. Press ENTER to accept the input. ¾ Opens a menu of soft keys used to select the signal stan- Signal Standard dard to be used. ¾...
- Page 87 Chapter 2 Functions and Operations — Display Channel/Frequency toggles between dis- Display Channel/Freq playing the channel number or the channel frequency (with a resolution of 100 MHz). — Display Graph/Text toggles between displaying a bar Display Graph/Text chart showing power levels, or a table showing channel number or frequency (depending upon the current setting of ) and the power Display Channel Freq...
- Page 88 Chapter 2 Functions and Operations — Enter the month (1-12) using the Up/Down arrow key or the Month keypad. Press ENTER when data entry is complete or ESCAPE to restore the previous value. — Enter the day using the Up/Down arrow key or the keypad. Press ENTER when data entry is complete or ESCAPE to restore the previous value.
- Page 89 Chapter 2 Functions and Operations Press the soft key to display the number of tracked satellites and Quality the GPS quality. Press the soft key to reset the GPS. Reset — Returns to the previous menu. Back — Pressing this soft key immediately changes the language used to Language display messages on the Cell Master status window.
-
Page 90: Cw Signal Generator Mode (Option 28)
Chapter 2 Functions and Operations CW Signal Generator Mode (Option 28) To select CW Signal Generator mode, press the MODE key and use the down arrow to highlight and press ENTER. CW Signal Generator The CW Signal Generator option provides a CW signal from the instrument. The primary purpose of this signal is for sensitivity testing of receivers. - Page 91 Chapter 2 Functions and Operations — Selecting this soft key displays a diagram of the rec- Display Setup Help ommended setup to use this option. MEAS/DISP If Option 5 (Power Monitor) is installed, it is possible to operate Option 5 and Option 28 simultaneously.
- Page 92 Chapter 2 Functions and Operations W — Sets the input impedance of the instrument to 50W, which is the default setting. W Anritsu 12N50-75B — Displays measurements as if the input impedance was 75W. The actual input impedance is still 50W, but the displayed information is transformed to the equivalent 75W value based on the offset value specified by the adapter used in the measure- ment.
-
Page 93: Gsm Mode (Option 40)
Chapter 2 Functions and Operations GSM Mode (Option 40) The following section explains the hard keys and soft keys available when the Cell Master is set to GSM mode. MODE = GSM: FREQ/DIST AMPLITUDE MEAS/DISP SOFTKEYS: dBm/ Center Spectrum Watts Power vs. - Page 94 Chapter 2 Functions and Operations ¾ Opens the signal standard menu, showing the currently Select Standard selected signal standards. Use the soft keys to navigate the list. Press the soft key to show the complete signal standard list. When the Show All complete list is displayed, the currently selected signal standards are marked with an asterisk.
- Page 95 Chapter 2 Functions and Operations In GSM mode, pressing the SYS key displays the following System menu soft key selections: System Options Application Options Clock Self Test External Printer Freq Hour Status Units Minute Change Date Format Language Month English On/Off Back Location...
- Page 96 Chapter 2 Functions and Operations — Enter the year (2003-2036) using the Up/Down arrow key or Year the keypad. Press ENTER when data entry is complete or ESCAPE to restore the previous value. — Returns to the top-level SYS menu. Back —...
-
Page 97: Cdma Mode (Options 33, 42 And 43)
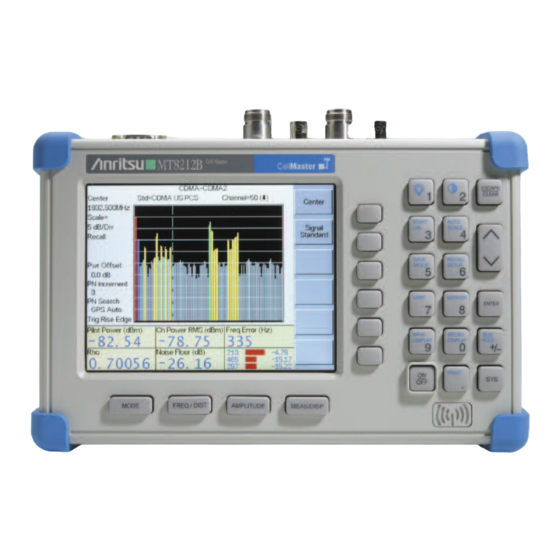
Chapter 2 Functions and Operations CDMA Mode (Options 33, 42 and 43) The following section explains the hard keys and soft keys available when the Cell Master is set to CDMA mode. MODE = CDMA: FREQ/DIST AMPLITUDE SOFTKEYS: Center Scale Signal dBm/ Standard... - Page 98 Chapter 2 Functions and Operations ¾ Opens a menu of soft keys used to select the signal stan- Signal Standard dard to be used. For more information on signal standards, refer to Appendix ¾ Opens the signal standard menu, showing the currently Select Standard selected signal standards.
- Page 99 Chapter 2 Functions and Operations MEAS/DISP Choosing MEAS/DISP in CDMA mode causes the soft keys below to be dis- played. MODE = CDMA: MEAS/DISP SOFTKEYS: Text Only Over the Air Meas Meas Pilot Scan Setup Multipath Search Walsh Codes Auto Increment 64 Codes Manual...
- Page 100 Chapter 2 Functions and Operations — When CDP is selected, the display shows Code Domain Power as 64 or 128 bit reversed Walsh codes in graphical format. Pilot power, Channel Power, Frequency Error, Rho, Noise Floor will be displayed and three strong pilots will be displayed in OTA measurement.
- Page 101 Chapter 2 Functions and Operations in the standard order. In that case, the Cell Master draws them as a single bar with no spaces in between. — The PN Increment determines how close together PNs PN Increment can be. For instance, if the PN increment is chosen as 4, a measured PN of 9 will be displayed as a PN of 8 with a larger timing error (Tau).
- Page 102 Chapter 2 Functions and Operations — Opens the selected marker parameter for data entry. Press Edit ENTER when data entry is complete or ESCAPE to restore the pre- vious value. — Returns to the Main Markers Menu. Back — Turns all markers off. All Off —...
- Page 103 Chapter 2 Functions and Operations — Enter the hour (0-23) using the Up/Down arrow key or the Hour keypad. Press ENTER when data entry is complete or ESCAPE to restore the previous value. — Enter the minute (0-59) using the Up/Down arrow key or Minute the keypad.
-
Page 104: T1 Tester Mode (Option 50)
Chapter 2 Functions and Operations T1 Tester Mode (Option 50) In T1 Tester mode (Option 50), the FREQ/DIST and AMPLITUDE hard keys are not used. Pressing the MEAS/DISP key in T1 Tester mode causes the soft keys, below, to be dis- played: Auto Terminate... - Page 105 Chapter 2 Functions and Operations MEAS/DISP Choosing MEAS/DISP in T1 mode causes the soft keys below to be displayed. — Activates menus that are used to set BERT testing options. Setup — Selects the framing mode to be used. Framing Mode —...
- Page 106 Chapter 2 Functions and Operations — Opens the error insert menu which allows inser- Setup Error Insert tion of the following errors in the transmitting signal. — Configures the unit to insert bit errors. — Configures the unit to insert Bipolar Violations. —...
- Page 107 Chapter 2 Functions and Operations — When histogram is selected, the time scale can be set Time Scale from one second to one hour in the following steps: 1 second, 15 sec- onds, 30 seconds, 45 seconds, 1 minute, 15 minutes, 30 minutes, 45 minutes, 60 minutes, or AUTO.
- Page 108 Chapter 2 Functions and Operations In T1 measurement mode, pressing the SYS key displays the following System menu soft key selections: System Options Application Options Clock Self Test Printer Data Hour Status Units Minute Change Date Format Language Month English On/Off Back Location...
- Page 109 Chapter 2 Functions and Operations — Enter the year (2003-2036) using the Up/Down arrow key or Year the keypad. Press ENTER when data entry is complete or ESCAPE to restore the previous value. — Returns to the top-level SYS menu. Back —...
-
Page 110: E1 Tester Mode (Option 50)
Chapter 2 Functions and Operations E1 Tester Mode (Option 50) In E1 Tester mode (Option 50), the FREQ/DIST and AMPLITUDE hard keys are not used. Pressing the MEAS/DISP key in E1 Tester mode causes the soft keys, below, to be displayed: Auto Terminate... - Page 111 Chapter 2 Functions and Operations MEAS/DISP Choosing MEAS/DISP in E1 mode causes the soft keys below to be displayed. — Activates menus that are used to set BERT testing options. Setup — Selects the framing mode to be used. Framing Mode Auto —...
- Page 112 Chapter 2 Functions and Operations W — Select 75 ohm impedance. W — Select 120 ohm impedance. Back — Returns to the previous menu. Back — Returns to the previous menu. — Activates menus that are used to control the BERT measurement. BERT —...
- Page 113 Chapter 2 Functions and Operations In E1 measurement mode, pressing the SYS key displays the following System menu soft key selections: System Options Application Options Clock Self Test Printer Data Hour Status Units Minute Change Date Format Language Month English On/Off Back Location...
- Page 114 Chapter 2 Functions and Operations — Enter the year (2003-2036) using the Up/Down arrow key or Year the keypad. Press ENTER when data entry is complete or ESCAPE to restore the previous value. — Returns to the top-level SYS menu. Back —...
-
Page 115: Evdo Mode (Options 34, 62, And 63)
Chapter 2 Functions and Operations EVDO Mode (Options 34, 62, and 63) The following section explains the hard keys and soft keys available when the Cell Master is set to EVDO mode. The Cell Master can measure EVDO performance over the air with an antenna, or by connecting the base station directly to the Cell Master. - Page 116 Chapter 2 Functions and Operations FREQ/DIST Choosing FREQ/DIST in EVDO mode causes the soft keys, below, to be dis- played and the corresponding values to be shown in the message area. ¾ Sets the center frequency. Enter a value using the Up/Down arrow Center key or keypad, press ENTER to accept, ESCAPE to restore the previous value.
- Page 117 Chapter 2 Functions and Operations MEAS/DISP Choosing MEAS/DISP in EVDO mode causes the soft keys below to be displayed. MODE = EVDO: MEAS/DISP SOFTKEYS: Text Only MAC Code Power Over the Air Meas. Data Code Power Meas Setup Idle Active Search Back Auto...
- Page 118 Chapter 2 Functions and Operations — When CDP is selected, the data can be displayed as a MAC Code power screen or Data Code Power screen. — In the Mac Code Power screen, Pilot & MAC power MAC Code Power (dBm), Rho Overall 1, Rho Pilot, Data Modulation, and Noise Floor will be displayed and the three strongest pilots will be displayed in Over The Air (OTA) measurement mode.
- Page 119 Chapter 2 Functions and Operations — The Cell Master uses an external even second External Manual time mark as the timing reference. This is usually available at the base station on a BNC connector labeled as "ESTM" or "PP2S". This ESTM must be connected to the connector on the CDMA Timing Input...
- Page 120 Chapter 2 Functions and Operations In EVDO mode, pressing the SYS key displays the following System menu soft key selec- tions. System Options Application Options Clock Self External Test Printer Freq Hour Status Units Minute Change Date Format Language Month English On/Off Back...
- Page 121 Chapter 2 Functions and Operations — Enter the month (1-12) using the Up/Down arrow key or the Month keypad. Press ENTER when data entry is complete or ESCAPE to restore the previous value. — Enter the day using the Up/Down arrow key or the keypad. Press ENTER when data entry is complete or ESCAPE to restore the previous value.
-
Page 122: Symbols
Chapter 2 Functions and Operations Symbols Table 2-1 provides a listing of the symbols used as condition indicators on the LCD status window. Table 2-1. LCD Icon Symbols Icon Symbol Cell Master is in Hold for power conservation. To resume sweeping, press key. -
Page 123: Self Test
Chapter 2 Functions and Operations Self Test At turn-on, the Cell Master runs through a series of quick checks to ensure the system is functioning properly. Note that the voltage and temperature are displayed in the lower left corner below the self test message. If the battery is low, or if the ambient temperature is not within the specified operational range, Self Test will fail. -
Page 124: Error Messages
Chapter 2 Functions and Operations Error Messages Self Test Error Messages A listing of Self Test Error messages is provided in Table 2-2. Table 2-2. Self Test Error Messages Error Message Description Battery Low Battery voltage is less than 9.5 volts. Charge battery. If condition per- sists, call your Anritsu Service Center. - Page 125 Chapter 2 Functions and Operations Range Error Messages A listing of Range Error messages is provided in Table 2-3. Table 2-3. Range Error Messages Error Message Description RANGE The start (F1) frequency is greater than the stop (F2) frequency. ERROR:F1 > F2 RANGE The start (D1) distance is greater than the stop (D2) distance.
- Page 126 Chapter 2 Functions and Operations Spectrum Analyzer Error Messages A listing of Spectrum Analyzer Error Messages is provided in Table 2-4. Table 2-4. Spectrum Analyzer Error Messages Error Message Description OVER LOAD This error message is displayed when there is too much input power. Decrease Input Power OVER RANGE! The ADC is over range.
- Page 127 Chapter 2 Functions and Operations InstaCal Error Messages If the serial number of the connected InstaCal module does not match the serial number stored in the Cell Master, the following message is displayed: The InstaCal characterization data stored in the Cell Master is for a module different than the one currently connected.
- Page 128 Chapter 2 Functions and Operations High Accuracy Power Meter (Option 19) Error Messages The following error messages could be displayed on the Cell Master when using the High Accuracy Power Meter mode with Power Sensor PSN50. If any error condition persists, contact your local Anritsu Service Center.
-
Page 129: Battery Information
Chapter 2 Functions and Operations Battery Information Charging a New Battery The NiMH battery supplied with the Cell Master has already completed charge and dis- charge cycles at the factory and full battery performance should be realized after your first charge. -
Page 130: Determining Remaining Battery Life
Chapter 2 Functions and Operations Each battery holder in the optional charger has an LED charging status indicator. The LED color changes as the battery is charged: Red indicates the battery is charging Green indicates the battery is fully charged Yellow indicates the battery is in a waiting state (see below). - Page 131 Chapter 2 Functions and Operations Selftest Temperature ... . 24°C Memory ....PASSED RTC Battery... . . 3.1V Voltage .
-
Page 132: Important Battery Information
Chapter 2 Functions and Operations Important Battery Information With a new NiMH battery, full performance is achieved after three to five complete · charge and discharge cycles. Recharge the battery only in the Cell Master, or in an Anritsu approved charger. ·... -
Page 133: Chapter 3 - Getting Started
Chapter 3 Getting Started Introduction This chapter provides a brief overview of the Anritsu Cell Master. The intent of this chapter is to provide the user with a starting point for making basic cable and antenna analyzer, spectrum analyzer, and power meter measurements. Procedures that are specific to cable and antenna analyzer mode (page 3-2), Spectrum Analyzer mode (page 3-10), and common to all modes (page 3-14) are presented. -
Page 134: Cable And Antenna Analyzer Mode
Chapter 3 Getting Started Cable and Antenna Analyzer Mode Selecting the Frequency For the OSL or FlexCal calibration method the frequency range for the desired measure- ment must be set. The Cell Master will automatically set the frequency when a particular signal standard is selected, or the frequency can be manually set using the F1 and F2 soft keys. - Page 135 Chapter 3 Getting Started If a Test Port Extension Cable is to be used, the Cell Master must be calibrated with the Test Port Extension Cable in place. The Test Port Extension Cable is a phase stable cable and is used as an extension cable on the test port to ensure accurate and repeatable measure- ments.
- Page 136 Chapter 3 Getting Started OSL Calibration Procedures In Cable and Antenna Analyzer Mode, if the message is displayed, or the test port Cal Off cable has been changed, a new calibration is required. The following procedures detail how to perform the OSL calibration. OPEN CALIBRATION SHORT...
- Page 137 Chapter 3 Getting Started FlexCal OSL Calibration Step 8. The currently selected calibration method can be viewed by pressing the SYS key, followed by the soft key. To change the calibration method, select Status the SYS key, followed by the soft key.
- Page 138 Chapter 3 Getting Started Offset Method An alternative to the termination method is to measure the return loss of a 20 dB offset. This is similar to measuring an antenna that has been specified to have a 20 dB return loss across the frequency of operation.
- Page 139 Chapter 3 Getting Started Standard InstaCal Calibration Step 1. Select OSL Cal by pressing the SYS key, followed by the Application Options soft key. The currently selected calibration method is indicated at the bottom of the status window. Use the soft key to select the OSL calibration CAL Mode method.
- Page 140 Chapter 3 Getting Started Auto Scale The Cell Master can automatically set the scale to the minimum and maximum values of the measurement on the y-axis of the graph. This function is particularly useful for mea- surements in SWR mode. To automatically set the scale, press the AUTO SCALE key. The Cell Master will automatically set the top and bottom scales to the minimum and maxi- mum values of the measurement with some margin on the y-axis of the LCD.
- Page 141 Chapter 3 Getting Started Step 6. Using the arrow key, select the and press ENTER. Use the Up/Down Cable = arrow key to select the cable types stored in the standard Cell Up/Down Standard Master cable lists (which cannot be edited) or choose , for additional ca- Custom bles.
-
Page 142: Spectrum Analyzer Mode
Chapter 3 Getting Started Spectrum Analyzer Mode Selecting Spectrum Analyzer Mode Step 1. Press the ON/OFF key. Step 2. Press the MODE key and use the Up/Down arrow key to select Spectrum Ana- mode. Press ENTER to set the mode. lyzer Making a Measurement Step 1. - Page 143 Chapter 3 Getting Started Selecting the Signal Standard and Channel Step 1. Press the soft key and select the appropriate signal standard for Signal Standard the measurement. Step 2. Press the soft key and select the appropriate channel for the mea- Select Channel surement.
- Page 144 Chapter 3 Getting Started Selecting Sweep Parameters Max Hold To toggle maximum hold on or off, press the MEAS/DISP key, the soft key and the Trace soft key. Maximum hold displays the maximum response of the input signal over Max Hold multiple sweeps.
- Page 145 Chapter 3 Getting Started Auto Coupling Auto coupling of the attenuation links the attenuation to the reference level. That is, the higher the reference level, the higher the attenuation. Auto coupling is indicated on the display as Atten XX dB Manual Coupling When manually coupled, the attenuation can be adjusted independently of the reference level.
-
Page 146: All Modes
Chapter 3 Getting Started All Modes Selecting a Signal Standard The Cell Master contains a table of common signal standards. To choose a standard for your application: Step 1. Press the FREQ/DIST key. Step 2. Press the soft key and the soft key. -
Page 147: Save And Recall A Display
Chapter 3 Getting Started NOTE: Only setups from the current mode are displayed. Save and Recall a Display Saving a Display The following procedure saves a display to memory. Step 1. Press the SAVE DISPLAY key to activate the alphanumeric menu for trace storage. -
Page 148: Changing The Language
Chapter 3 Getting Started Changing the Language By default, the Cell Master displays messages in English. To change the display language: Step 1. Press the SYS key. Step 2. Select the soft key. Language Step 3. Select the desired language. Choices are English, French, German, Spanish, Chinese, and Japanese. -
Page 149: Adjusting Limits
Chapter 3 Getting Started Adjusting Limits The Cell Master offers two types of limits: a single horizontal limit line and segmented lim- its. Adjusting a Single Limit Step 1. Press the LIMIT key. Step 2. Press the soft key. Single Limit Step 3. -
Page 150: Adjusting The Lcd Brightness
Chapter 3 Getting Started Step 6. Press the soft key to move on to Segment 2. If the status of Seg- Next Segment ment 2 is OFF, pressing the soft key will automatically set the Next Segment start point of segment 2 equal to the end point of Segment 1. Step 7. -
Page 151: Printing
Chapter 3 Getting Started Printing Printing is accomplished by selecting an available printer and pressing the print key as de- scribed below. Refer to the particular printer operating manual for specific printer settings. Printing a Screen Step 1. Obtain the desired measurement display. Step 2. -
Page 152: Using The Soft Carrying Case
Chapter 3 Getting Started Using the Soft Carrying Case The soft carrying case has been designed such that the strap can be unsnapped to allow the case to be easily oriented horizontally; thus allowing the Anritsu controls to be more easily accessed (Figure 3-5). -
Page 153: Chapter 4 - Cable & Antenna Analyzer Measurement Mode
Chapter 4 Cable & Antenna Analyzer Measurement Mode Introduction This chapter provides a description of cable and antenna analyzer measurements, including line sweeping fundamentals and line sweeping measurement procedures, available when the Cell Master is in frequency or DTF mode. Line Sweep Fundamentals In wireless communication, the transmit and receive antennas are connected to the radio through a transmission line. -
Page 154: Cw Mode
Chapter 4 Cable & Antenna Measurements The performance of a transmission feed line system may be affected by excessive signal re- flection and cable loss. Signal reflection occurs when the RF signal reflects back due to an impedance mismatch or change in impedance caused by excessive kinking or bending of the transmission line. -
Page 155: Information Required For A Line Sweep
Chapter 4 Cable & Antenna Measurements Use this feature with caution, as the later introduction of an interfering signal might be mis- taken for a problem with the antenna or cable run. If CW is on during a normal RL or SWR measurement, the Cell Master will be more sus- ceptible to interfering signals. - Page 156 Chapter 4 Cable & Antenna Measurements NOTE: The antenna must be connected at the end of the transmission feed line when conducting a System Return Loss measurement. Figure 4-2 is an example of a typical system return loss measurement trace using a FlexCal calibration: Figure 4-2.
- Page 157 Chapter 4 Cable & Antenna Measurements Procedure - Cable Loss Mode Step 1. Press the MODE key. Step 2. Select using the Up/Down arrow key and press ENTER. Freq-Cable Loss Step 3. Set the start and stop frequencies, automatically by selecting a signal standard or manually using the F1 and F2 soft keys, as described on page 3-2.
- Page 158 Chapter 4 Cable & Antenna Measurements Distance-To-Fault (DTF) Transmission Line Test The Distance-To-Fault transmission line test verifies the performance of the transmission line assembly and its components and identifies the fault locations in the transmission line system. This test determines the return loss value of each connector pair, cable component and cable to identify the problem location.
- Page 159 Chapter 4 Cable & Antenna Measurements Step 10. Record the connector transitions. Figure 4-4 shows an example of a typical DTF return loss measurement trace using a FlexCal calibration. Figure 4-4. Typical DTF Return Loss Trace In the above example: Marker M1 marks the first connector, the end of the Cell Master phase stable Test Port Extension cable.
- Page 160 Chapter 4 Cable & Antenna Measurements Increasing the data points increases the sweep time and increases the accuracy of the mea- surement. CW mode On or Off can also affect sweep speed (see CW Mode, page 4-2 for details). Antenna Subsystem Return Loss Test Antenna Subsystem return loss measurement verifies the performance of the transmit and receive antennas.
- Page 161 Chapter 4 Cable & Antenna Measurements The following trace is an example of an antenna return loss measurement trace using a FlexCal calibration.. Figure 4-5. Antenna Return Loss Trace Calculate the threshold value and compare the recorded Lowest Return Loss to the calcu- lated threshold value.
-
Page 162: Chapter 5 - Spectrum Analyzer Measurement Mode
Measurement Mode Introduction This chapter provides a description of Spectrum Analyzer measurements and procedures when the Cell Master MT8212B is in Spectrum Analyzer Mode. Measurement Fundamentals Measurement fundamentals include the use of additional spectrum analyzer functions be- yond frequency, span, amplitude and marker functions. In particular, this section focuses on resolution bandwidth, video bandwidth, sweep, and attenuator functions. - Page 163 Chapter 5 Spectrum Analyzer Measurements With a wide bandwidth, more noise is included in the measurement. With a narrow band- width, less noise enters the resolution bandwidth filter, and the measurement is more accu- rate. If the resolution bandwidth is narrower, the noise floor will drop on the display of the spectrum analyzer.
-
Page 164: Preamplifier
Chapter 5 Spectrum Analyzer Measurements IMPORTANT! Attenuation is normally a coupled function and is automatically adjusted when the reference level changes. The reference level does not change however, when the attenuator changes. The attenuator should be ad- justed so that the maximum signal amplitude at the input mixer is –25 dBm or less. -
Page 165: Preamplifier Measurement Example
Chapter 5 Spectrum Analyzer Measurements Preamplifier Measurement Example This section provides an overview of how to detect a low-level signal with the help of the preamplifier of a MT8212B Cell Master. Required Equipment MT8212B Cell Master Test Port extension cable, Anritsu 15NNF50 – 1.5C A signal source (Anritsu 69xxxB Synthesized Signal Generator or equivalent) Procedure Step 1. - Page 166 Chapter 5 Spectrum Analyzer Measurements Figure 5-1 shows the measurement results with the preamplifier off. Figure 5-1. Preamplifier Off Step 14. Turn the preamplifier on. When the preamplifier is ON, the word should appear in the lower left corner of the display. The displayed noise level should be lowered by approximately 20 dB on the dis- play, and the signal should appear on top of the displayed noise.
-
Page 167: Dynamic Attenuation Control
Chapter 5 Spectrum Analyzer Measurements Dynamic Attenuation Control The dynamic attenuation control feature tracks the peak input signal level and automatically adjusts the attenuator to protect the MT8212B in situations of high RF signal levels. This feature also enhances the instrument sensitivity in situations of low-level RF signals by de- activating and activating the internal preamplifier resulting in improved measurement accu- racy. -
Page 168: Selecting The Signal Standard And Channel
Chapter 5 Spectrum Analyzer Measurements Selecting the Signal Standard and Channel Before making measurements, the Cell Master must be set to the appropriate wireless net- work air interface standard and channel number. The most common standards and channel numbers are stored in the Cell Master and, when selected, the Cell Master automatically se- lects the correct frequency and span. -
Page 169: Field Strength Measurements
Chapter 5 Spectrum Analyzer Measurements Field Strength Measurements All antennas have loss or gain that can cause errors in measurements. The Cell Master can correct for antenna loss or gain errors using Field Strength Measurements. The antenna fac- tors must be uploaded to the Cell Master using the Anritsu Handheld Software Tools pro- vided with the unit. -
Page 170: Occupied Bandwidth
The occupied frequency bandwidth is defined as the bandwidth between the upper and lower frequency points at which the signal level is dB below the peak carrier level. Required Equipment Cell Master MT8212B Portable antenna for the selected signal frequency Procedure Step 1. Connect the antenna to the Spectrum Analyzer connector. - Page 171 Chapter 5 Spectrum Analyzer Measurements Figure 5-4 shows the occupied bandwidth results using the % of power method of a CDMA signal. Figure 5-4. Occupied Bandwidth Occupied bandwidth is calculated at the end of a sweep. An hourglass is displayed as the calculations are performed.
-
Page 172: Channel Power Measurement
Comply with FCC or local regulations Keep overall system interference at a minimum Required Equipment Cell Master MT8212B Portable antenna for the selected signal frequency Procedure Step 1. On the Cell Master, press the MODE key, use the Up/Down arrow key to select mode and press ENTER. - Page 173 Chapter 5 Spectrum Analyzer Measurements Figure 5-5. Channel Power Meassurement When the channel power measurement is on, a icon appears to the left of the CH PWR graph. Channel power is calculated at the end of a sweep. An hourglass is displayed as the calculations are performed.
-
Page 174: Adjacent Channel Power Ratio
Measurement Channel Bandwidth Adjacent Channel Bandwidth Channel Spacing Required Equipment Cell Master MT8212B Portable antenna for the selected signal frequency Procedure Step 1. On the Cell Master, press the MODE key, use the Up/Down arrow key to select mode and press ENTER. - Page 175 Chapter 5 Spectrum Analyzer Measurements Figure 5-6 shows the results of the measurement. Figure 5-6. Adjacent Channel Power Measurement Adjacent Channel Power Ratio is a continuous measurement. Once it is turned on, it will re- main on until it is turned off by pressing the key again.
-
Page 176: Am/Fm Demodulation
Chapter 5 Spectrum Analyzer Measurements AM/FM Demodulation The Cell Master built-in demodulator for AM, narrowband FM, wideband FM and single sideband (selectable USB and LSB) allows a technician to hear an interfering signal for easy identification. The demodulated signal can be heard using either the built-in speaker, or through a monaural headset connected to the 1/8-inch jack on the test panel. - Page 177 Chapter 5 Spectrum Analyzer Measurements Figure 5-8. SSB Demodulation Step 5. Press the On/Off soft key to enable the measurement. will appear to the AM/FM left of the graph. Figure 5-9. AM Demodulation Step 6. Use the soft key and the Up/Down arrow key to change the audio vol- Volume ume from 0% to 100%.
-
Page 178: Carrier To Interference Ratio (C/I)
Chapter 5 Spectrum Analyzer Measurements Carrier to Interference Ratio (C/I) Carrier to Interference Ratio (C/I) Measurement is a two-step process, first measuring the carrier level and then, with the carrier turned off, measuring the remaining signals and noise in the band of interest. After the two measurements are complete, the ratio of the carrier level to the noise plus interference is displayed using three assumptions: The interferer is a narrowband frequency hopping signal source (NB FHSS) The interferer is a wideband frequency hopping signal source (WB FHSS) - Page 179 Chapter 5 Spectrum Analyzer Measurements Step 4. Press the MEAS/DISP key followed by the soft key, the soft key Measure More and the soft key. Figure 5-11. Carrier to Interference Ratio Measurement Screen Step 5. Press the soft key and select the correct carrier signal type from the Signal Type three choices, , or...
- Page 180 Chapter 5 Spectrum Analyzer Measurements Step 10. Press the soft key and follow the on-screen prompts to complete the Measure measurement. NOTE: Access to the transmitter is required to complete this procedure as the transmitted carrier must be turned off for the second portion of the measure- ment.
-
Page 181: Chapter 6 - Internal Power Meter Mode
Chapter 6 Internal Power Meter Mode Introduction The Cell Master MT8212B can make power measurements based on the spectrum analyzer measurements, and can display the measured power in dBm or Watts. Power Measurement Required Equipment The following equipment is required to make a power measurement with the Cell Master. -
Page 182: Offset Calibration
It is possible to recall the last calibration and it is also possible to ap- ply this offset cal feature to other modes as well (GSM, CDMA, EVDO, SPA). Required Equipment Cell Master MT8212B · Test Port Extension Cable, Anritsu 15NNF50 – 1.5C ·... - Page 183 Step 7. Press the ENTER key. Step 8. Disconnect the 18" (46cm) Test Port Extension Cable from the connector RF In and connect the phase stable cable and attenuator between the connector RF In and the 18" (46cm) Test Port Extension Cable. 30 dB Attenuator 42N50A-30 18"...
- Page 184 Chapter 6 Power Measurement Recall an Offset Calibration The offset calibration will be turned off when the system is rebooted. However, the last cal- ibration is always saved and can be recalled and applied again without performing another calibration. Step 1. Press the Amplitude key. Step 2.
- Page 185 Changing the Display Units The power reading can be displayed in dBm or Watts. Step 1. Press the AMPLITUDE key. Step 2. Press the soft key to toggle the display between Watts and dBm. Units Step 3. Press the FREQ/DIST key to return to the Power Meter menu. Displaying Relative Power Relative power can be selected through the AMPLITUDE menu.
-
Page 186: Chapter 7 - Power Monitor Mode (Option 5)
(Option 5) Introduction The Cell Master MT8212B with Option 5 installed can be used for making power measure- ments with broadband RF detectors, such as the 10 MHz to 20 GHz Anritsu 560-7N50B. See the table of available RF detectors on page 1-5. The power monitor displays the mea-... - Page 187 Chapter 7 Power Monitor NOTE: If the loss is not known, Option 21, Transmission Measurement, or the Offset Calibration can be used to measure the loss of the system. Displaying Power in dBm and Watts Step 8. Press the soft key to display power in Watts. Units Displaying Relative Power Step 9.
-
Page 188: Chapter 8 - High Accuracy Power Meter
Chapter 8 High Accuracy Power Meter Introduction The MT8212B Cell Master with Option 19 and sensor PSN50 can be used to make High Accuracy Power Measurements from 50 MHz to 6 GHz. This high performance sensor pro- vides true RMS measurements from –30 to +20 dBm providing accurate measurements for both CW and complex digitally modulated signals. -
Page 189: Power Measurement
Chapter 8 High Accuracy Power Meter Power Measurement Required Equipment MT8212B Cell Master RS232 Serial Cable, Anritsu P/N 800-441 Power Supply, Anritsu P/N 40-168 High Accuracy Power Sensor Anritsu P/N PSN50 30 dB, 50W, bi-directional, DC-8.5 GHz, N(m)-N(f), Attenuator, 3-1010-123 DC SUPPLY PSN50 SENSOR ATTENUATOR... - Page 190 Chapter 8 High Accuracy Power Meter NOTE: The channel number is not required because the cal factor frequencies are rounded to the nearest 500 MHz. Step 8. With no power applied to the sensor, press the AMPLITUDE key then the Zero soft key to zero the sensor.
- Page 191 Chapter 8 High Accuracy Power Meter Transferring Data to Handheld Software Tools The Cell Master has only one serial port, so it is not possible to communicate with both the PSN50 sensor and a PC running Handheld Software Tools (HHST) at the same time. There- fore, only saved measurements can be viewed in HHST when using the PSN50.
-
Page 192: Chapter 9 - T1 Measurement Mode
T1 Measurement Mode Introduction This chapter provides a brief description of a T1 circuit and T1 measurements, and also ex- plains how to setup and measure T1 performance using the Anritsu Cell Master MT8212B with Option 50 installed. T1 Fundamentals Wireless service providers use wired T1 circuits as the backhaul links to connect a Base Transceiver Station (BTS) to a Mobile Switching Center (MSC). -
Page 193: G.821 Measurement Definitions
Chapter 9 T1 Measurements G.821 Measurement Definitions ¾The count of available seconds since the beginning of the test. Available Seconds (AS) Available seconds equals the total test time minus any unavailable seconds. ¾The count of Degraded Minutes since the start of the test. A Degraded Minutes (DGRM) Degraded Minute occurs when there is a 10-6 bit error rate during 60 available, non-se- verely bit errored seconds. - Page 194 Chapter 9 T1 Measurements Another possible configuration between BTS and MSC is shown in Figure 9-3. T1 BACKHAUL CIRCUIT REPEATER REPEATER Figure 9-3. BTS and MSC Configuration This configuration uses a High-speed Digital Subscriber Line (HDSL) in the T1 circuit, which enables full duplex T1 service over a single pair of wires without repeaters.
-
Page 195: Testing T1 Circuits
Chapter 9 T1 Measurements Testing T1 Circuits T1 circuit testing can be done with either of two methods: In service and Out of service testing. In service testing is done during routine maintenance and troubleshooting phase. This can be done on live data without removing the T1 circuit from service or done on live data. Monitoring live data allows wireless service provider technicians to detect alarms, bipolar violations (BPV) and frame errors but bit errors cannot be measured. - Page 196 Chapter 9 T1 Measurements Step 2. Select the soft key. Setup Step 3. Press the soft key and choose the framing Framing Mode Auto D4 SF type. Press to return to the previous menu. Back NOTE: The Cell Master will attempt auto-framing in two situations only: 1.
- Page 197 Chapter 9 T1 Measurements BERT Measurement Step 1. Press the MEAS/DISP key and then the soft key. BERT Step 2. Press the soft key and use the arrow key to select Measure Duration Up/Down the duration of the measurement, and press ENTER. Figure 7-5 shows the T1 measurement display.
-
Page 198: Out-Of-Service Testing
Chapter 9 T1 Measurements Figure 7-6 displays the T1 measurement data in Histogram mode. Figure 9-6. T1 BERT Measurement Display with Histogram Out-Of-Service Testing Out-of-service measurements are performed when the T1 circuit is not in service or inac- tive. Typically these tests are done during initial installation, during circuit acceptance by the wireless service provider or when the results of the in-service measurements indicate er- rors. - Page 199 Chapter 9 T1 Measurements Measurement Procedure Step 1. Press the MODE key, select , and press ENTER. T1 Tester Step 2. Select the soft key. Vp-p Step 3. Press the soft key and select mode. Terminate/Bridged Terminate Step 4. Press the soft key to start or stop the peak to peak voltage Start/Stop Measure measurement.
- Page 200 Chapter 9 T1 Measurements Figure 9-7 illustrates some of the key information of the T1 measurement setup. Figure 9-7. T1 Out-of-Service Measurement...
- Page 201 Chapter 9 T1 Measurements BERT Measurement Procedure Step 1. Press the MEAS/DISP key and then the soft key. BERT Step 2. Press the soft key and use the arrow key to select Measure Duration Up/Down the duration of the measurement, and press ENTER. Figure 7-8 displays the T1 measurement in raw data mode.
- Page 202 Chapter 9 T1 Measurements Inserting Errors Step 9. To insert a setup error, press the soft key to inject errors in the Insert Errors transmit signal. Figure 7-9 displays the T1 measurement when errors are in- serted. The errors are displayed on the right side at the bottom of the display. Figure 9-9.
-
Page 203: Ds0 Testing
Chapter 9 T1 Measurements DS0 Testing The DS0 test feature enables testing on each of the 24 channels of the T1 line. The receive channel is decoded and the VF level and frequency are measured and displayed. The signal is also connected to a speaker, enabling the tester to make an audible assessment of the sig- nal quality of the circuit. -
Page 204: Chapter 10 - E1 Measurement Mode
Chapter 10 E1 Measurement Mode Introduction This chapter provides a brief description of an E1 circuit and E1 measurements, and also explains how to setup and measure E1 performance using the Anritsu Cell Master MT8212B with Option 50 installed. E1 Fundamentals Wireless service providers use wired E1 circuits as the backhaul links to connect a Base Transceiver Station (BTS) to a Mobile Switching Center (MSC). -
Page 205: G.821 Measurement Definitions
Chapter 10 E1 Measurements G.821 Measurement Definitions ¾The count of available seconds since the beginning of the test. Available Seconds (AS) Available seconds equals the total test time minus any unavailable seconds. ¾The count of Degraded Minutes since the start of the test. A Degraded Minutes (DGRM) Degraded Minute occurs when there is a 10-6 bit error rate during 60 available, non-se- verely bit errored seconds. -
Page 206: Testing E1 Circuits
Chapter 10 E1 Measurements Testing E1 Circuits E1 circuit testing can be done with either of two methods: In Service and Out of Service testing. In Service testing is done during a routine maintenance and troubleshooting phase. This can be accomplished without removing the E1 circuit from service on live data. Monitoring live data allows the wireless service provider technician to detect alarms, bipolar violations (BPV) and frame errors, but bit errors cannot be measured. - Page 207 Chapter 10 E1 Measurements NOTE: The Vpp measurement can be displayed in dBdsx format by pressing the Vpp/dBdsx soft key. Step 5. Press the soft key to start or stop the peak to peak voltage Start/Stop Measure measurement. BERT Measurement Setup Step1.
- Page 208 Chapter 10 E1 Measurements Figure 10-3 illustrates some of the key information of the E1 setup measurement display. Figure 10-3. E1 BERT Setup Measurement Display 10-5...
- Page 209 Chapter 10 E1 Measurements BERT Measurement Step 1. Press the MEAS/DISP key and then the soft key. BERT Step 2. Press the soft key and use the arrow key to select Measure Duration Up/Down the duration of the measurement, and press ENTER. Figure 9-4 displays the E1 measurement display in raw data mode.
- Page 210 Chapter 10 E1 Measurements Figure 9-5 shows the E1 measurement display in histogram mode. Figure 10-5. E1 BERT Measurement Display with Histogram 10-7...
-
Page 211: Out-Of-Service Testing
Chapter 10 E1 Measurements Out-Of-Service Testing Out-of-service measurements are performed when the E1 circuit is not in service or inac- tive. Typically these tests are done during initial installation, during circuit acceptance by the wireless service provider or when the performance of the in service measurements indi- cates extensive errors. - Page 212 Chapter 10 E1 Measurements Step 7. Press the soft key and choose W or W. Press to return to Impedance Back the previous menu. Step 8. Select the soft key to access more menu selections. More Step 9. Press the soft key and select clock.
- Page 213 Chapter 10 E1 Measurements Step 3. To display the measurement data in a histogram format, press the Display Raw soft key. Data/Histogram Step 4. Press the soft key to set the duration of the measurement, and Measure Duration press ENTER. The maximum measurement duration is two days. Step 5.
-
Page 214: Vf Channel Access Testing
Chapter 10 E1 Measurements VF Channel Access Testing The VF Channel Access test feature enables testing on each of the 32 channels of the E1 line. The receive channel is decoded and the VF level and frequency are measured and dis- played. -
Page 215: Chapter 11 - Transmission Measurement Mode
Chapter 11 Transmission Measurement Mode Introduction The Transmission Measurement option (Option 21) provides the capability to perform two-port measurements of passive devices over the 25 MHz to 3 GHz frequency range. Transmission Measurement can also be used to make antenna isolation measurements and repeater measurements. - Page 216 Chapter 11 Transmission Measurement NOTE: The START CAL key (number 3 on the keypad) does not start calibra- tion when the unit is in Transmission Measurement mode. Step 4. Following the on-screen prompt, connect a phase-stable cable between the RF Out port and the RF In port.
-
Page 217: Transmission Measurement Procedure
Chapter 11 Transmission Measurement Transmission Measurement Procedure Step 1. Connect the duplexer between the Cell Master ports. RF In RF Out DUPLEXER S332D ESCAPE CLEAR START AUTO SCALE SAVE RECALL SETUP SETUP LIMIT MARKER ENTER RECALL SAVE DISPLAY DISPLAY HOLD PRINT MODE FREQ/DIST... -
Page 218: Bias Tee (Option 10A)
Chapter 11 Transmission Measurement Bias Tee (Option 10A) Option 10A provides a bias tee installed inside the MT8212B Cell Master. The bias arm is connected to a 12-24 Vdc (variable in 1V increments) power source that can be turned on as needed to place the voltage on the center conductor of the port. -
Page 219: Chapter 12 - Gps Feature
Chapter 12 GPS Feature Introduction The MT8212B Cell Master is available with a built-in GPS receiver feature (Option 31) that can provide latitude, longitude and altitude information and UTC timing. The following GPS antennas and accessories are available from Anritsu: 2000-1410 Magnet Mount GPS Antenna with 15-foot cable ·... - Page 220 Chapter 12 GPS Feature NOTE: The Cell Master retains the current GPS location information until the unit is turned off. This feature allows measurement traces to be saved with the retained GPS location information even when the GPS is inactive or the instru- ment is indoors.
-
Page 221: Saving With Gps Information
Chapter 12 GPS Feature Saving with GPS Information Cell Master measurement traces can be saved with the GPS coordinates of the location where the measurement was taken. The following procedure saves a display to memory. Step1. Press the SAVE DISPLAY key to activate the alphanumeric menu for trace storage. - Page 222 Chapter 12 GPS Feature Figure 12-3. Saved GPS Location Information 12-4...
-
Page 223: Chapter 13 - Cdma Measurement Mode
Chapter 13 CDMA Measurement Mode Introduction This chapter presents information and procedures to make cdmaOne and CDMA2000 1xRTT measurements. Option 33, cdmaOne and CDMA2000 1xRTT (OTA), requires Op- tions 31 and 43. CDMA Measurements The Cell Master can measure CDMA performance over the air with an antenna, or by con- necting the base station directly to the Cell Master. - Page 224 Chapter 13 CDMA Measurement Setting the Frequency Press the FREQ/DIST key to set and change frequencies for the CDMA measurements. The Cell Master must be configured to tune to the frequency being output by the base sta- tion. The Cell Master contains a table of common signal standards. NOTE: Refer to the chapter on Handheld Software Tools for information on cre- ating and storing custom signal standards.
- Page 225 Chapter 13 CDMA Measurement the base station or it can be recovered from GPS when a GPS antenna is connected to the Cell Master. — The Cell Master uses GPS as the timing reference, and automat- GPS Auto ically detects the strongest pilot. The Anritsu GPS antenna must be connected to the Cell Master GPS antenna connector.
- Page 226 Chapter 13 CDMA Measurement The following display selections are available through the MEAS/DISP key: — When CDP is selected, the display shows Code Domain Power as 64 or 128 bit re- versed Walsh codes in graphical format. Pilot power, Channel Power, Frequency Error, Rho, and Noise Floor will be displayed and three strong pilots will be displayed in OTA measurement.
- Page 227 Chapter 13 CDMA Measurement For Over The Air (OTA) measurements, the channel power will vary as the signal path from the transmitter to receiver varies. Freq Error Frequency error is the difference between the received center frequency and the specified center frequency.
-
Page 228: Cdma Rf Measurements
Chapter 13 CDMA Measurement Multipath Power (available only with OTA - Option 33) The amount of power in the dominant signal which is being spread in time due to multipath echoes. This should be <0.4 dB to make good measurements. DSync (available only with OTA - Option 33) Sync Walsh code power relative to the pilot power. -
Page 229: Demodulator, Cdmaone And Cdma2000 Measurements
Chapter 13 CDMA Measurement Demodulator, cdmaOne and CDMA2000 Measurements To demodulate cdmaOne and CDMA2000 1xRTT signals, connect the Cell Master to the base station following the setup instructions. Step 1. On the Cell Master, press the MODE key, use the Up/Down arrow key to select mode and press ENTER. - Page 230 Chapter 13 CDMA Measurement Figure 13-3. CDMA Code Domain Power Display,124 bit Reversed Codes Step 10. Press the soft key to display the text screen. Text Only Figure 13-4. CDMA Text Only Display NOTE: Markers can be used to read the individual code power and type of code like traffic, pilot, paging or sync (see Figure 13-5).
- Page 231 Chapter 13 CDMA Measurement Figure 13-5. CDMA Display with Markers 13-9...
-
Page 232: Over The Air Measurements
Chapter 13 CDMA Measurement Over The Air Measurements To make Over The Air measurements: Step 1. On the Cell Master, press the MODE key, use the Up/Down arrow key to select mode and press ENTER. CDMA Step 2. Select the soft key and press the soft key. - Page 233 Chapter 13 CDMA Measurement Step 13. Press the soft key to display the OTA readings. Over The Air Meas. Figure 13-6. CDMA OTA Display Figure 13-7. CDMA Multipath Display 13-11...
- Page 234 Chapter 13 CDMA Measurement Step 14. Press the soft key to display the Code Domain Power of the demodulated CDMA signal. Figure 13-8. CDMA Code Domain Power Display. 13-12...
-
Page 235: Chapter 14 - Gsm Measurement Mode
Chapter 14 GSM Measurement Mode Introduction This chapter presents GSM information and procedures. Configuration To begin GSM measurements: Step1. Press the MODE key. Step2. Use the Up/Down arrow keys to highlight GSM and press ENTER to select. Step3. Connect the base station to the Cell Master by connecting the power amplifier of the base station to the port of the Cell Master using a coupler or attenu- RF In... - Page 236 Chapter 14 GSM Measurement NOTE: Frequency error measurements are only as accurate as the reference frequency. Frequency error measurements without an external reference fre- quency are not accurate. AMPLITUDE Press the AMPLITUDE key to change amplitude configurations. – Choose to display the measurement results in either dBm or dBm/Watts Watts.
- Page 237 Chapter 14 GSM Measurement – Display the frame. Power vs. Time (Frame) Figure 14-2. GMS Power vs. Time Frame with Eight Slots – Display the slot. Power vs. Time (Slot) Figure 14-3. GSM Power vs. Time with One Slot 14-3...
-
Page 238: Measurement Results
Chapter 14 GSM Measurement Measurement Results Channel Channel power measures the output power of the transmitter in the frequency Power specified. Out of specification power indicates system faults. Channel power is expressed in dBm. To change the units to Watts, press the AMPLITUDE key and the soft key. -
Page 239: Chapter 15 - Interference Analyzer Mode
Chapter 15 Interference Analyzer Mode Introduction This chapter presents Interference Analyzer (Option 25) information and procedures. Interference Analysis Multiple wireless networks often operate in complicated signal environments. Three or four base station antennas may be located on the same tower, and can create interference prob- lems. - Page 240 Chapter 15 Interference Analysis Step6. Press the MEAS/DISP key followed by the soft key to set the Spectrogram spectrogram sweep parameters. There are two ways to set up spectrogram time parameters: set the time between sweeps or set the total time for a full spectro- gram display.
-
Page 241: Signal Strength
Chapter 15 Interference Analysis Step13. Press the soft key to turn off the cursors and return to the previous menu. Back Figure 15-1. Spectrogram Display Signal Strength Signal Strength is useful for tracking down the source of an interfering signal. This mea- surement is done at a single frequency in zero span. -
Page 242: Rssi
Chapter 15 Interference Analysis Step10. Press the soft key to turn on the audio output. Speaker Tone On/Off Step11. If necessary, press the soft key to set the speaker or headphone volume Volume to a comfortable level. Use the Up/Down arrow keys to adjust the volume. Figure 15-2. -
Page 243: Signal Id
Chapter 15 Interference Analysis Each screen full of 401 data points will be stored as a separate display, and can be saved for up to seven days. Figure 15-3. RSSI Display Signal ID Signal Identification is used to determine, if possible, the air interface standard of a signal. If the instrument is unable to determine the modulation format, it will display the estimated bandwidth of the signal. - Page 244 Chapter 15 Interference Analysis plete, displays the cell standard and estimated bandwidth of the interfering sig- nal. Figure 15-4. Signal ID Display NOTE: Use IA Freq To Center to center the frequency on the display. 15-6...
-
Page 245: Chapter 16 - Channel Scanner Mode
Chapter 16 Channel Scanner Mode Introduction This chapter presents Channel Scanner (Option 27) information and procedures. Channel Scanner The Channel Scanner option measures the output power of multiple transmitted signals. The output power can be displayed as a bar graph or a text display showing the amplitude of selected channels for a given air interface standard. - Page 246 Chapter 16 Channel Scanner Step1. Press the MEAS/DISP key and select the soft key. Use the Number of Channels keypad to enter and press the ENTER key. The channels will be displayed as bar graphs. Figure 16-1. Example of Channels Displayed as Bar Graphs Step2.
- Page 247 Chapter 16 Channel Scanner Step1. To set up the channel step size, press the FREQ/DIST key and select the Chan- soft key. Use the keypad to enter and press the ENTER key. nel Step Size Figure 16-3. Example of Channels Displayed as Bar Graphs with Channel Step Size = 5 Step2.
-
Page 248: Chapter 17 - Signal Generator Mode
The ex- ternal splitter feeds the signal into the RF input of the instrument. The display shows the output power and frequency. Required Equipment Cell Master MT8212B with Option 28 Attenuator Splitter Procedure Step 1. -
Page 249: Operation With Option 5, External Power Monitor
Chapter 17 CW Signal Generator Step 4. Connect the receiver cable to the output of the power splitter. Step 5. Adjust the power using the attenuator knobs until the receiver being tested drops the signal. Operation with Option 5, External Power Monitor If Option 5 (External Power Monitor) is installed, it is possible to operate Option 5 and Op- tion 28 simultaneously. -
Page 250: Softkeys
Chapter 17 CW Signal Generator Softkeys The following soft keys are available in CW Signal Generator mode: — Enter a CW frequency from 25 MHz to 3000 MHz using the Freq Up/Down arrow key, or the keypad and the appropriate soft key for Hz, kHz, MHz or GHz. -
Page 251: Chapter 18 - Evdo Mode
Chapter 18 EVDO Mode Introduction This chapter presents information and procedures to make CDMA2000 EVDO measure- ments. Option 34, EVDO Over The Air (OTA) requires Option 31 (GPS) and Option 63 (EVDO Demodulator). CDMA EVDO has a chip rate of 1.2288MHz, the same as cdmaOne and CDMA2000 1xRTT. - Page 252 Chapter 18 EVDO Mode Step 3. Select the soft key and use the keypad or Up/Down arrow External Ref Freq keys to enter the frequency. Press ENTER to select. As the Cell Master locks to the source, the message Ext Ref Unlocked may briefly flash on the display.
- Page 253 Chapter 18 EVDO Mode soft key can be used to change the range of the Code Domain Power screen. CDP Scale The Cell Master will automatically change attenuation, preamplifier and digital gain set- tings to make the best EVDO measurements. Measurement and Display The following is the menu available through the MEAS/DISP key:...
- Page 254 Chapter 18 EVDO Mode — Creates a mask for the Power vs. Time graph. The mask will be See Mask green if the sampled signal is within the mask, and red if it is outside the mask. — Turns the mask funcion on or off. Mask On/Off The following display sections are available through the MEAS/DISP key: CDP - When CDP is selected, the data can be displayed as a MAC Code power screen or...
- Page 255 Chapter 18 EVDO Mode 18-5...
- Page 256 Chapter 18 EVDO Mode The following measurements are displayed on the CDP screens. Data Code Power - The Data Channel in EVDO consists of 16 "I" sub channels and 16 "Q" sub channels. Each of these channels should have a power around –15.05 dB, relative to the total Data Channel power.
- Page 257 Chapter 18 EVDO Mode Active Data Power - The average power of the data channel portion of the active EVDO slot that is captured. If no active slots are captured, then the unit will display N/A. Power vs. Time Graph - In the lower part of the RF screen, a power versus time graph is shown for an EVDO slot.
- Page 258 Chapter 18 EVDO Mode Figure 18-1. EVDO RF Measurement Screen, Idle NOTE: To get the best EvDO pilot scan results, adjust the center frequency of the Cell Master until the frequency error measurement reading is within ±100 Figure 18-2. EVDO RF Measurement Screen, Active NOTE: When using masking, if the mask lines above and below the signal are green, the signal is within the mask.
- Page 259 Chapter 18 EVDO Mode EVDO Demodulator To demodulate CDMA2000 EVDO signals, connect the Cell Master to the base station. Step 1. On the Cell Master, press the MODE key, use the Up/Down arrow key to select mode and press ENTER. EVDO Step 2.
- Page 260 Chapter 18 EVDO Mode Figure 18-5. Data Code Power Screen Figure 18-4. RF Measurement Screen with Markers NOTE: Cell Master also supports 1xEVDO, Physical Layer subtype 2. When us- ing subtype 2, select 64 codes (default) unless otherwise instructed. 18-10...
-
Page 261: Evdo Over The Air Measurements
Chapter 18 EVDO Mode EVDO Over The Air Measurements To make EVDO over the air measurements: Step 1. On the Cell Master, press the MODE key, use the Up/Down arrow key to select mode and press ENTER. EVDO Step 2. Select the soft key and press the soft key. - Page 262 Chapter 18 EVDO Mode NOTE: If the GPS satellites are not being tracked, then GPS cannot be acti- vated in CDMA mode. Step 10. Press to return to the previous menu. Back Step 11. Press the soft key and select Data Modualtion Type Auto Step 12.
-
Page 263: Chapter 19 - Handheld Software Tools
Chapter 19 Handheld Software Tools Introduction This chapter provides a description of the Anritsu Handheld Software Tools program. Handheld Software Tools is a Windows 95/98/NT4/2000/ME/XP program for transferring measured traces, along with markers and limit lines, to the PC display. The program help function provides on screen instructions on display modification, trace overlay, uploading and downloading traces, and multiple plot printing. -
Page 264: Installation
Chapter 19 Handheld Software Tools NOTE: It is recommended that Windows NT 4.0 users install NT 4.0 Service Pack 3 (SP3) or above. In addition, Windows 2000 (SP1 or higher) and Win- dows ME may require installation of the latest Service Pack. Please contact Microsoft Corporation for further information on obtaining and installing service packs. -
Page 265: Using Handheld Software Tools
Chapter 19 Handheld Software Tools Interface Cable Installation Communication between the instrument and the PC is accomplished over a null modem se- rial cable provided with the instrument (Anritsu part number 800-441, and optional USB to serial adapter, part number 551-1691, if required). Step1. -
Page 266: Plot Capture To The Pc
Chapter 19 Handheld Software Tools Plot Capture to the PC To open the plot capture menus, select the capture icon on the button bar, or select the Capture drop down menu from the menu bar. Select Capture to Screen to download traces to the PC. Select a folder, or individual traces within a folder, to be downloaded to the PC. - Page 267 Chapter 19 Handheld Software Tools Manual adjustment sets the upper and lower limits of the display under the Scale/Limit Submenu. Auto Scale automatically adjusts the scale for maximum and minimum mea- surement readings. Limit Line Off turns off all limit lines. Single Limit Line can be activated to help identify faults.
- Page 268 Chapter 19 Handheld Software Tools Refer to the Handheld Software Tools HELP function for more information on the steps necessary to perform a trace overlay. Saving Traces Once the plots are captured to the PC they can be saved as individual files or as a block of files to a database.
- Page 269 Chapter 19 Handheld Software Tools Creating a Database A single trace or a block of traces can be transferred from the instrument to the PC. A sepa- rate database can be created for each cellular site. The site name can be used as the database name.
- Page 270 Chapter 19 Handheld Software Tools Antenna used for radiated emissions testing are individually calibrated (the antenna factors can be measured directly) at all appropriate distances. The calibrations produce values that are defined the “equivalent free space antenna factor.” The calibration procedure corrects for the presence of the reflection of the antenna in the ground plane, giving the value that would be measured if the antenna were in “free space.”...
- Page 271 Chapter 19 Handheld Software Tools Downloading Antennas All ten antennas can be downloaded to the PC from the instrument. This allows for modifi- cations to the antenna factors of an antenna or the addition or deletion of available antennas from the list. The antennas can then be uploaded to the instrument. To download the antennas: Step1.
- Page 272 Chapter 19 Handheld Software Tools Querying the Cell Master Cable List Query Cable List allows the user to check and review the contents of the custom cable list in the Cell Master. In the Cable Editor, select . The software will download the ca- Tools Query Cable List ble list from the Cell Master to the PC.
-
Page 273: Signal Standards Editor
Chapter 19 Handheld Software Tools Signal Standards Editor The Signal Standards Editor is a software application for viewing, editing and creating sig- nal standards files. Select a signal standard entry from the list to make it active. The Signal Standards Editor can: Create new signal standards files ·... - Page 274 Chapter 19 Handheld Software Tools To retrieve a Signal Standards file, select from the Retreive Signal Standards Connection menu, or use the short-cut icon on the button bar. The retrieved Signal Standards data will replace all existing Signal Standards data in the Signal Standards Editor. To store the cur- rent Signal Standards data locally, select from the menu and save the current Sig-...
-
Page 275: Appendix A Reference Data
Appendix A Reference Data Coaxial Cable Technical Data Table A-1 provides a standard listing of common coaxial cables. Table A-1. Coaxial Cable Technical Data (1 of 3) Prop. Mfgr. Cable Freq 1 Loss 1 Freq 2 Loss 2 Freq 3 Loss 3 Andrew FSJ1-50A (6 GHz) 0.84... - Page 276 Appendix A Reference Data Table A-1. Coaxial Cable Technical Data (2 of 3) Prop. Mfgr. Cable Freq 1 Loss 1 Freq 2 Loss 2 Freq 3 Loss 3 Belden RG-17/17A 0.659 1000 0.18 1000 0.18 1000 0.18 Belden RG-55/55A/55B 0.659 1000 0.541 1000...
- Page 277 Appendix A Reference Data Table A-1. Coaxial Cable Technical Data (3 of 3) Prop. Mfgr. Cable Freq 1 Loss 1 Freq 2 Loss 2 Freq 3 Loss 3 Nk Cables RFF3/8-50GHF 0.81 1000 0.147 2000 0.218 2500 0.25 Nk Cables RFF3/8-50BHF 0.81 1000...
-
Page 278: Antenna Technical Data
Appendix A Reference Data Antenna Technical Data Table A-2 provides a listing of common antennas. Table A-2. Antenna Technical Data (1 of 7) Anritsu part number: 2000-1030 MAXRAD MPA1750 Antenna, 1710-1880 MHz Antenex DXCN1795SM Freqency (MHz) Antenna Gain (dBi) Antenna Factor (dB) 1710 32.88 1715... - Page 279 Appendix A Reference Data Table A-2. Antenna Technical Data (2 of 7) 1860 33.61 1865 33.63 1870 33.66 1875 33.68 1880 33.70 1885 33.73 1890 33.75 1895 33.77 1900 33.80 1905 33.82 1910 33.84 1915 33.86 1920 33.89 1925 33.91 1930 33.93 1935...
- Page 280 Appendix A Reference Data Table A-2. Antenna Technical Data (3 of 7) 2438 35.96 2440 35.97 2442 35.97 2444 35.98 2446 35.99 2448 2450 2452 36.01 2454 36.02 2456 36.02 2458 36.03 2460 36.04 2462 36.05 2464 36.05 2466 36.06 2468 36.07 2470...
- Page 281 Appendix A Reference Data Table A-2. Antenna Technical Data (4 of 7) Anritsu part number: 2000-1035 Centurion EXE-902-SM Antenna - 896-941 MHz Freqency (MHz) Antenna Gain (dBi) Antenna Factor (dB) 1.65 27.62 1.65 27.63 1.65 27.64 1.65 27.65 1.65 27.65 1.65 27.66 1.65...
- Page 282 Appendix A Reference Data Table A-2. Antenna Technical Data (5 of 7) Anritsu part number: 2000-1361 Anritsu #2000-1361 (MAXRAD MHWS5800MSMA) Antenna - 5725-5825 MHz Freqency (MHz) Antenna Gain (dBi) Antenna Factor (dB) 5725 43.38 5727 43.38 5729 43.38 5731 43.38 5733 43.39 5735...
- Page 283 Appendix A Reference Data Table A-2. Antenna Technical Data (6 of 7) 5817 43.51 5819 43.52 5821 43.52 5823 43.52 5825 43.53 Anritsu part number: 2000-1473 Anritsu #2000-1473 (Mobile Mark PSKN3-925S) Antenna - 870-960 MHz Freqency (MHz) Antenna Gain (dBi) Antenna Factor (dB) 26.71 26.76...
- Page 284 Appendix A Reference Data Table A-2. Antenna Technical Data (7 of 7) Anritsu part number: 2000-1475 Anritsu #2000-1475 (Mobile Mark PSTG0-1950/2140HKS) Antenna - 1920-1980, 2110-2170 Freqency (MHz) Antenna Gain (dBi) Antenna Factor (dB) 1920 35.89 1925 35.91 1930 35.93 1935 35.95 1940 35.98...
-
Page 285: Appendix B Windowing
Appendix B Windowing Introduction The FREQ/DIST menu provides for setting the cable loss and relative propagation velocity of the coaxial cable. The key opens a menu of FFT windowing types for the DTF Window calculation. The theoretical requirement for inverse FFT is for the data to extend from zero frequency to infinity. - Page 286 Appendix B Windowing D i s t a n c e T o F a u l t - 1 0 - 1 5 - 2 0 - 2 5 - 3 0 R e t u r n L o s s ( d B ) - 3 5 - 4 0 - 4 5...
- Page 287 Appendix B Windowing D i s t a n c e T o F a u l t - 1 0 - 1 5 - 2 0 - 2 5 - 3 0 R e t u r n L o s s ( d B ) - 3 5 - 4 0 - 4 5...
-
Page 288: Appendix C Signal Standards
Appendix C Signal Standards Introduction Table C-1 provides a listing of common signal standards supported by the Cell Master. Table C-1. Signal Standards AMPS / EIA 553 - Uplink C-450(P) - Uplink C-450(P) - Downlink C-450(SA) - Uplink C-450(SA) - Downlink CDMA China 1 - Uplink CDMA China 1 - Downlink CDMA China 2 - Uplink... - Page 289 Appendix C Signal Standards GSM 450 - Uplink GSM 450 - Downlink GSM 480 - Uplink GSM 480 - Downlink GSM 850 - Uplink GSM 850 - Downlink GSM 900 - Uplink GSM 900 - Downlink P-GSM 900 - Uplink P-GSM 900 - Downlink E-GSM 900 - Uplink E-GSM 900 - Downlink...
- Page 290 Appendix C Signal Standards PHS - Downlink SMR 800 - 12.5 kHz - Uplink SMR 800 - 12.5 kHz - Downlink SMR 800 - 25 kHz - Uplink SMR 800 - 25 kHz - Downlink SMR 1500 - Uplink SMR 1500 - Downlink TACS - Uplink TACS - Downlink Digital Terrestrial TV Japan...
- Page 291 Index 1xRTT ..1-1, 1-10, 2-76, 13-1 C/I ....2-22, 5-17 cable loss ....4-2, 4-4 calibration .
- Page 292 dynamic attenuation ... . 5-6 In Service Testing E1 ....10-3 E1 ..1-2, 1-11, 2-2, 2-86, 10-1 T1 .
- Page 293 resolution bandwidth . 2-19, 2-42, 2-54, 3-11, OBW....5-9 return loss ....4-2, 4-8 occupied bandwidth .
- Page 294 single sweep ... . . 2-7 video ... . 2-22, 2-102 TSC....14-4 units .
Need help?
Do you have a question about the Cell Master MT8212B and is the answer not in the manual?
Questions and answers