Table of Contents
Advertisement
Quick Links
Advertisement
Table of Contents

Related Manuals for Rover HD PRO TAB


Summary of Contents for Rover HD PRO TAB
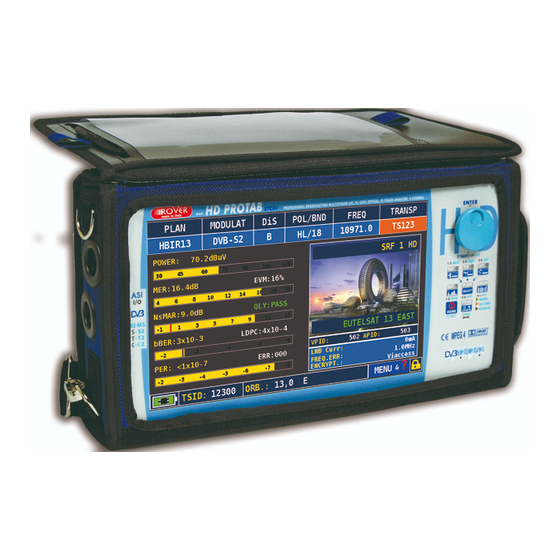
- Page 1 HD PRO TAB User Guide Version 2.4 Released March 2014...
- Page 2 Blank page 2/74...
- Page 3 GUARANTEE REGULATIONS: 1. The guarantee is valid only upon the presentation of invoice or receipt to ROVER Laboratories S.p.A. The purchase date must be clearly indicated on the invoice/receipt. 2. The guarantee covers the replacement free of charge of parts only, when malfunctioning is solely due to manufacturing faults.
- Page 4 ROVER Laboratories reserves the right to charge the customer for the estimate costs analysis. Risks and costs for transport to ROVER Laboratories S.p.A. must be sustained by the buyer. After repair, if the equipment is under guarantee, ROVER Laboratories S.p.A. will pay for the transport returning the goods to the customer.
- Page 5 SAFETY INSTRUCTIONS 1. Read these instructions. 2. Keep these instructions. 3. Heed all warnings. 4. Follow all instructions. 5. To clean the meter, never use chemical aggressive products (diluents) and/or abrasive or rough clothes which may damage plastics and displays. Always use a soft cloth, damped with simple water and alcohol solution or a de-greasing not abrasive liquid soap.
- Page 6 Blank page 6/74...
-
Page 7: Table Of Contents
13.1. SAT Special Functions....................57 13.2. TV & CATV Special Functions..................60 Performing a Measurement Campaign ...............64 Appendix 1: HD PRO TAB firmware and channel plans upgrade ....66 Firmware Upgrade procedure ....................66 Channel Plans upgrade ......................69 FAULT IDENTIFICATION FORM................72... -
Page 8: Getting Started
Getting Started 1. Unpacking and inspection Before unpacking the unit, inspect the outer carton for shipping damage. If the carton shows damage, inspect the unit in those areas. Several essential items are provided with the unit, including: - Power cords for use in Continental Europe or United States - 110V-240V AC to 12 VDC Power Adapter (Use AC / DC power with DC cable shorter than 3m) - Composite A/V cables... -
Page 9: Top Panel Connectors
RF inputs: 75Ω F connector and 50Ω N connector HD PRO TAB has 2 different RF inputs: a 75Ω F connector input and a 50Ω N connector input. Both RF interfaces accept signals with power level between 30 and 120dBµV and comply with standards ETS300744 (OFDM), ETS300421 (QPSK) and EN302307 (QPSK, 8PSK, 16APSK). - Page 10 HDMI Output HD PRO TAB gives the possibility to connect an external TV or monitor via an HDMI connector. The meter detects automatically when a screen is connected and switches its view from the embedded screen to the external monitor.
-
Page 11: Front Panel Commands And Leds
4. Front Panel commands and LEDs. The HD PRO TAB’s front panel is equipped with a 7” touch screen display, a mechanical encoder wheel as well as an 8 buttons keyboard to access all primary functions of the meter. Touch screen and keyboard are complementary: the meter can be driven completely using either the keyboard or the screen. - Page 12 The meter does not turn ADAPTER NOT 0.5 SECONDS OFF 0.5 on. Check the power SUPPLIED FROM SECONDS ON adapter ROVER FLASHES Switch ON NO or YES The meter is being turned on 15 TIMES FLASHING SIMULTANEOUSLY 0.5 SECONDS OFF...
- Page 13 Important notes on meter’s battery 1. ALWAYS TURN THE INSTRUMENT OFF BEFORE CONNECTING THE BATTERY CHARGER. 2. DO NOT LEAVE THE BATTERIES DISCHARGED FOR LONG PERIODS. 3. ALWAYS CHARGE THE BATTERIES AT NIGHT FOR AT LEAST 7 HOURS, EVEN IF THEY ARE NOT COMPLETELY DISCHARGED.
-
Page 14: Configuring The Hd Pro Tab
Configuring the HD PRO TAB 5. Meter’s basic parameters Pressing the CONFIG button on the front panel keyboard will display the basic settings menu. By default, VOLUME is selected (as shown in figure), thus rotating the mechanical wheel will result in increasing or decreasing the audio volume; rotating the wheel clockwise, you will see the white cursor moving up;... - Page 15 VIDEO IN by default is configured on INT (internal), meaning that the images displayed on the meter will be those decoded from the signal at the RF input. Configuring it on EXT (external), the meter will display in the measurement interface the images coming from the composite video input on meter’s right side panel.
-
Page 16: Hd Pro Tab Configuration Menu
UNIT: it represents the measurement unit for RF level to be displayed in the measurement interface. I can be configured to dBm, dBµV and dBmV. LANGUAGE: HD PRO TAB has 6 embedded language maps that can be applied on-the- fly, simply changing the selection here. The available languages are ITALIAN, ENGLISH, FRENCH, GERMAN, SPANISH and PORTOGUESE. - Page 17 DISPLAY LIGHT: if set on FULL ON, will result in having the maximum brightness of the screen constantly. When set to 30 seconds, will decrease automatically screen backlight for battery saving after 30 seconds of inactivity. BATTERY TEST: this code represents the result of the last battery test executed on the equipment: - The first 3 digits (418 in the picture) represents the time necessary to complete the test, expressed in minutes...
- Page 18 18/74...
- Page 19 TV Configuration Selecting TV from the left menu, will open the TV parameters configuration screen: LNB L.O. is set to 0 by default. It should be set to the desired value if it is necessary to down-convert the signal frequency into the TV band (VHF or UHF) before starting the measurements.
- Page 20 SAT Configuration Selecting SAT from the left menu, will open the SAT parameters configuration screen: LOCAL OSCILLATOR: could be set to STANDARD or to 0MHz. When set to Standard, it enables the selection of down-converter local oscillator from the 2 subsequent menus, Ku band and C band and the signal frequencies will be displayed according to the selected values (base-band frequency + local oscillator).
- Page 21 fingerprint with a database of compatible configurations and give to the user the name and the exact azimuth of the pointed satellite. PLS CONFIGURATION allows the user to define and configure up to 10 different PLS (Physical Layer Scrambling) values to be used to decrypt the physical layer of a Satellite Multi-stream signal in order to demodulate the contained ISI it and decode the embedded services.
- Page 22 METER INFO This menu displays a summary of meter’s basic information such as the serial number, the firmware version, etc : IPTV Configuration* This function allows the user to receive A/V through a Unicast or Multicast IP stream. The configurations to be set are 2: LAN IPTV, which corresponds to the physical Ethernet interface of the board IP ADDRESS PORT which contains the IP stream configuration parameters: (*This function requires a specific hardware option.
- Page 23 COMMON INTERFACE The HD PRO TAB is equipped with a Common Interface slot which can host professional, multi-service and consumer, single-service CAM modules. In this menu it is possible to verify if the CAM module inserted in the meter is powered up and responsive and also the CAM manufacturer and firmware version.
-
Page 24: Hd Pro Tab Measurement Interface
HD PRO TAB Measurement interface 7.1 Accessing the meter’s functions from the home page. The HD PRO TAB’s home page gives the access to all the main functions: measurement interface, MPEG services decoding, ASI analysis, and so on. The SAT, TV and CATV icons gives the access to the meter’s measurement interface for respectively Satellite, Terrestrial and Cable signals The SPECT icon gives access to the spectrum analyzer. -
Page 25: Performing Satellite Measurements
7.2 Performing Satellite measurements Selecting SAT from the Home page, or pressing the SAT button on the keyboard will activate the satellite measurement interface. The first time the user enters this function is requested to select a satellite plan among the canalizations stored in the meter: Once the plan selected, position the selector over the MEAS icon to start the measurements. - Page 26 3. Transport Stream ID & ORB alternates with Network ID and Network Name. 4. Lock indication. When the signal is correctly demodulated, the lock is closed and the measurements displayed. 5. Misc parameters. Here the user can find the indication of LNB consumption, Frequency error and CA systems detected in the stream.
- Page 27 For DVB-S2 Multi-stream signals the Meter let the user select which ISI should be demodulated from the signal. By default the meter demodulates the ISI #1. The selection could be done via the “MENU&?” contextual menu: Once selected the ISI of interest, the meter will automatically demodulate it, providing the constellation and other ISI-dependent modulation information, as well as the service list.
-
Page 28: Performing Digital Tv Measurements
The NIT visualization function allows the user to decode and visualize the content of the NIT table carried by the demodulated Satellite signal. The screen is dynamically filled with the decoded information, including: frequency, BW, constellation, etc, as shown in the next picture: 6.3 Performing Digital TV measurements The basic principle of the terrestrial measurement interface is very similar to what has... - Page 29 On the right side, the meter visualizes the A/V content of the first non-encrypted service of the demodulated signal and provides its Vpid and Apid. Some miscellaneous information related to the modulation are displayed under the A/V box: signal carrier mode, constellation type and encryption status. For terrestrial channels, as for satellite ones, the modulation type is automatically detected by the meter as soon as it is locked: DVB-T/H, DVB-T2 or Analog TV.
- Page 30 The channel logger allows the user to visualize and record RF measurements for the tuned channel. Depending on which is the selected time span (from 30 min to 7 days) the refresh speed of the diagram may vary. It is also possible to save the logger to an external USB mass drive, connected on the USB-A port on the top panel.
- Page 31 resumes: TEMPORAL GUARD INTERVAL WIDTH DVB-T FFT Size 1/16 1/32 DVB-T2 FFT Size 1/16 1/32 1/128 19/128 19/256 66,5 Via the “MENU&?” contextual menu is possible to activate the micro-echoes visualization: this will result in a magnification of the diagram around the Guard Interval section and will visualize all detected micro-echoes: The fourth measurement screen visualizes the MER per Carrier.
- Page 32 The marker can be moved along the signal envelop: at the top of the screen, the CARRIER field indicates the carrier number and at the bottom is displayed the MER value of the selected carrier. By default the graph visualize all signal carriers which, depending on the mode, could be 2000 or 8000 for DVB-T, or 32000 for DVB-T2 signals;...
-
Page 33: Performing Analog Tv Measurements
6.4. Performing Analog TV measurements The terrestrial measurement interface allows also performing measurements on Analog TV signals. As the meter auto-detects the modulation type, in presence of an analog signal the interface will switch to the correct view automatically: As shown above, the basic screen visualizes the tuning paramenters (top bar) and the Video carrier level;... - Page 34 6.4.1. Performing Analog TV measurements with HD Video Waveform Monitor * If the meter is equipped with the Video Waveform monitor hardware option, the Analog TV measurement interface provides a more detailed analysis of the signal, including a line by line SNR measurement, a waveform graph and the Teletext decoding.
- Page 35 In the Waveform monitor page, the user can see in a more detailed way each line represented in a graph similar to the SNR. Again, the user can select whether to visualize the entire line or to zoom around a particular time frame to better appreciate the line characteristics.
-
Page 36: Performing Cable Measurements
CATV button on the keyboard. The HD PRO TAB provides other measurements for CATV networks, such as the INGRESS TEST and LEAKAGE TEST, to verify the conformance of cables. See chapter XX for detailed information on these tests. -
Page 37: Performing Optical Measurements
7.1. Performing Optical measurements From the HOME page, the user should touch the screen over the OPTIC icon to access the optical Measurement interface. Once connected the Meter to the optical source to be measured, ensure that the RF input is set to OPTICAL in the Meter’s basic configuration menu (press VOLUME on the keyboard and check the value of RF IN;... - Page 38 BlankPage 38/74...
-
Page 39: Performing Spectrum Analysis
HD PRO TAB Spectrum analyzer 8.1. Performing spectrum analysis To access the spectrum analyzer from the meter’s home page the user should press the SPECT button on the screen or the SPECT button on the keyboard. The spectral analysis starts automatically on the canalization plan previously selected or, if the user did SAT, TV or CATV measurements, on the last channel tuned by the meter. - Page 40 Let’s exemplify the Satellite spectral analysis, the terrestrial and cable ones being the same. The main marker indicates the transponder on which the meter is actually tuned; the top bar contains its tuning parameters, including LNB polarization, center frequency and transponder number.
- Page 41 refresh of the spectrum. • Save / Recall: this function allows the user to make screen captures of the spectrum diagram, including top and bottom bars, as well as the markers. The Recall function could be used to visualize stored screen-shots, selecting them among the saved files list. •...
-
Page 42: Mpeg Services List
MPEG Services List 9.1. Decoding the signal content From the Home page, touching the MPEG SERVICE LIST icon will activate the meter's MPEG decoder. This function can also be accessed moving the selector on the icon rotating the mechanical encoder. As briefly seen in the preceding chapters, the MPEG Service List function allows the user to decode the Transport Stream carried by the signal and visualize the list of services composing The meter keeps memory of the last measurement done by the user;... - Page 43 as shown in the following picture: 43/74...
- Page 44 At the bottom of the screen the user can see the Encoding parameters for Audio and Video components. After few seconds, this bar disappears from the screen, giving the user the full screen view of the Video component. Touching again the screen over the video content, will switch the view back to the Services List.
-
Page 45: Streaming The Content Over Ip And Usb
9.2. Streaming the content over IP and USB As the meter is equipped with a 10/100 T-Base ethernet port and an USB-A port, the user could also activate the streaming of the selected Elementary Stream (service). To perform streaming over IP, the user can activate it by accessing the contextual "MENU & ?" menu and toggling to LAN the TS streaming parameter: Once the streaming function in enabled, it is possible to access the streaming configuration page, through which the user can set up the IP parameters and select the services to be... -
Page 46: Bar And Tilt Graph
10.1 Basic functions of the BAR GRAPH The HD PRO TAB provides the Bar Graph and Tilt Graph representations of the band. With the Bar Graph the user can visualize all the channels detected by the meter based on the pre-... -
Page 47: Lte Interference Analysis
10.2 LTE Interference Analysis Pressing twice the BARSCAN button, toggles the LTE INTERFERENCE AUTOTEST view. This test determines the interference level on TV signals due to LTE carriers and displays the suggested value of the attenuator that should be placed on the receiving antenna to decrease LTE carriers level, thus compensate their interference. -
Page 48: Performing Transport Stream Analysis
Performing Transport Stream Analysis 11.1. Introduction to the ASI analyzer The HD PRO TAB is equipped with an embedded Transport Stream Analyzer, providing the full ETR101290 coverage and Template monitoring. The ETR101290 provides guidelines for measurement in Digital Video Broadcasting satellite,... -
Page 49: Tr101290 Analysis
In the bottom status bar the meter provides also the Network ID, Network Name, TS_ID and Cell ID. 11.3. TR101290 Analysis Touching the screen over the NEXT button will switch the Analyzer to the second page, dedicated to the TR101290 monitoring. The following screen will appear: Likely to what has been described for the measurement interface, the top section of the analyzer pages contains the channel basic tuning parameters and the indication of the signal source: RF-75ohm, RF-50omh or ASI in. -
Page 50: Network Delay Measurement
11.4. Network Delay measurement The third page of the embedded transport stream analyzer displays the Network Delay measurement. This is a fundamental measurement when operating in SFN environments because il lets the operator qualify the transport stream network delay and verify that its value doesn’t exceed the maximum value configured in the TS MIP Packets (typically 900ms). -
Page 51: Using Memory Functions
Using Memory functions 12.1. The Memory Menu From the HOME page, touching the screen over the MEMORY icon, will switch the meter to the Memory functions menu. Scope of this menu is to provide the user with auto- memory, data-logging and canalization editing functions suitable for field measurements and for customizing the channel plans. -
Page 52: Data-Logger Functions
START SAVE will activate the auto-memory function and start the channels discovery. If the text displayed is START OVERWRITE it means that the destination file is already existing and - if the function is started - will be overwritten. 12.3. Data-logger functions SAVE DATALOGGER: this function could be used on the top of an auto-memory plan or a standard canalization plan to execute precise measurements of signal strength and quality for each channel listed in the selected plan. - Page 53 standard channels (SAT, TV and CATV): each time the standard changes (from SAT to TV, or vice-versa) the user is asked to connect the proper signal source before the meter continues the measurements. TERR DC@RF parameter should be used if the aerial is connected to the meter through a centralized distribution system or any other system needing a DC power supply to provide the signal.
- Page 54 54/74...
-
Page 55: Manu Memory
12.4. Manu Memory The MANUMEMORY function could be used to generate customized channel plans and to edit existing custom canalizations. To edit a manual plan, the user should select the desired canalization via the PLAN parameter and then select START EDIT. once the channels list has been displayed, the user can now: - Modify channels parameters via the MODIFY ITEM function: a pop-up will appear, listing the tuning parameters the user can modify. -
Page 56: File Manager
12.5. File Manager The meter's File Manager could be used to rename or delete channel plans and / or data- logger and auto-memory files. The file manager's view is a list of all the files present on the meter among which the user can select the one to be renamed and / or deleted: RETURN will toggle the selector from the Action menu back to the files list EXIT brings the user back to the main MEMORY menu. -
Page 57: Special Functions
Special Functions The special functions menu contains some useful tools to qualify the SAT, TV or CATV installation beyond signal reception. The content of this menu varies accordingly to which has been the last measurement performed by the user: for instance, if the user performed a SAT measurement, the special functions menu will display all the tools related to a satellite installation;... - Page 58 DUAL LNB: This function enables the user to verify the installation of a Dual LNB dish, that can be either 9°&13°, 13°&19° or 19°&23°; if the installation type is set to VARIABLE it will be possible for the user to perform the test on a couple of independent plans, at choice among those available in the meter.
- Page 59 SAT FINDER: this function allows the user to determine the correctness of the dish pointing via the detection of three transponders selected among those composing the requested satellite. The meter will try to lock the selected TP and once done will display the RF power and Noise Margin measurements.
-
Page 60: Tv & Catv Special Functions
13.2. TV & CATV Special Functions For Terrestrial and Cable TV HD PRO TAB provides some specific tool able to verify the correctness of the aerial and cables installation. One of those tools is the Buzzer and Noise Margin already described in the preceding paragraph. The other tools are:... - Page 61 When the test is started, by default the meter tests the frequency 470MHz. By touching the screen over the frequency value (or placing there the selector an pressing the encoder) it is possible to change the frequency test value in a range varying from 250 to 950 MHz. The meter starts plotting the detected signal strength in the graph and displays also actual, minimum and maximum values.
- Page 62 REFLECTOMETER (TV & CATV): Reflectometer test is executed on TV and CATV distribution systems. Connecting the meter in pair with a calibrated noise generator on the cable to be tested, if the distribution is perfectly matched, the graph will show only the calibrated noise generated.
- Page 63 KEYS COMBINATIONS toggling special functions When an USB 2.0 dongle is plugged into the UAB-A port, pressing SPECT and BARSCAN buttons simultaneously will result in taking a screenshot of the Meter actual screen and store it on the USB device. If no USB device is connected, this function is disabled. Pressing the VOLUME button for 5 seconds will result in locking the Meter’s keyboard and the following message will appear on the screen: In this situation, neither the keyboard nor the touch screen are enabled.
-
Page 64: Performing A Measurement Campaign
This can be very practical for Network Operators because it allows them to verify the signal coverage in a certain service area and also to compare the coverage of several signals simultaneously (the round-robin mode is available using the meter with the ROVER Test Drive desktop Application). - Page 65 Unplug it from the meter and plug into your PC to retrieve the file and browse the recordings. Using the ROVER Test Drive application it will be then possible to convert the recordings to a kml file and import it into Google Earth to see the geo-referenced measurements on the map*.
-
Page 66: Appendix 1: Hd Pro Tab Firmware And Channel Plans Upgrade
Appendix 1: HD PRO TAB firmware and channel plans upgrade HD PRO TAB can be upgraded via the micro-USB connector on the left panel. To perform the firmware upgrade it is necessary to install on a Personal Computer the S.M.A.R.T. software that can be downloaded from the corporate website www.roverinstruments.com registering in the Update SW area. - Page 67 available files: those files normally include firmware upgrade and / or channel plans. 67/74...
- Page 68 Identify the upgrade package and click on the "RVR" icon to start download. Once the download has finished, connect the meter to your Personal Computer via the USB-A / micro-USB cable and launch the S.M.A.R.T. software. In the tool bar select the Upgrade command icon and browse your PC to the download location where you stored the firmware upgrade package: Once confirmed the selection by clicking on Open button, the upgrade procedure will start automatically.
-
Page 69: Channel Plans Upgrade
Switch on again the meter and verify that the initial splash screen displays the new firmware version. If you find some troubles during the upgrade procedure or the meter doesn't upgrade correctly, please contact our Customer Support Department at (+39)0309198299 or by e-mail at wecare@roverinstruments.com Channel Plans upgrade The channel plans upgrade is very similar to what has been described in the section above. - Page 70 Once the channel plan opened, select again the Tool menu and the Write Mem to Instrument function: This will automatically start the canalization upload to the connected meter. At the end of the procedure, the S.M.A.R.T. software will confirm with a pop-up message saying "Plan Upload Successful".
- Page 71 Blank Page 71/74...
-
Page 72: Fault Identification Form
FAULT IDENTIFICATION FORM RO.VE.R. Laboratories S.p.A. Customer Service Department Fax: +39 030 990 6894 e-mail: wecare@roverinstruments.com Date: ..........CUSTOMER INFORMATION • Full name: ..........................• Company: ........................... • Contact name: ........................... • Address: ............................. • City: ..................ZIP code: ........• Tel.: ..............Mobile: .............. - Page 73 ......................................................................................................................................................................................................................Do not return the meter without our authorization number (RMA) and RO.VE.R. shipment instructions, otherwise the meter will be rejected upon arrival at our premises. To receive your authorization number dial: +39 030 9198 299 73/74...
- Page 74 74/74...
Need help?
Do you have a question about the HD PRO TAB and is the answer not in the manual?
Questions and answers