Dynalog C-SCAN 2000 Series Survey Procedure Manual
Hide thumbs
Also See for C-SCAN 2000 Series:
- Operator's manual (41 pages) ,
- System manual (91 pages) ,
- Operator's manual (39 pages)

Related Manuals for Dynalog C-SCAN 2000 Series


Summary of Contents for Dynalog C-SCAN 2000 Series
- Page 1 For Model 2010 SURVEY PROCEDURE MANUAL Use of Generator and methods of survey Dynalog Electronics Limited Bristol, England www.dynalog.co.uk...
- Page 2 Dynalog Software Please read License Agreement overleaf before installing Contents DCAPP 2010 – This is the software needed to download data from a C-SCAN 2010 or C- SCAN 2000 unit (See section 9 of survey manual for use). To install place in CD drive. Installer should autorun. If Autorun fails to start, open CD from My Computer and double click setup.exe...
- Page 3 7. LIABILITY 7.1 DYNALOG warrants that any physical media on which the Program is stored are free from material defect and through normal use will remain so for a period of 90 days after purchase. This warranty excludes defects arising out of accident, neglect, misuse, failure of electric power or causes other than ordinary use. In the event of any breach of this warranty (or statutory warranty or conditions incapable of exclusion by these conditions) the responsibilities of DYNALOG shall be limited to replacing the enclosed Program or to returning the price paid as DYNALOG may in its absolute discretion determine.
- Page 4 Maintenance of this equipment should only be carried out by qualified personnel using the Manufacturer’s Maintenance Manual. The material contained in this Manual is copyrighted by Dynalog Electronics Ltd, and is not to be photocopied, duplicated, or reproduced in any form without the express written consent of Dynalog Electronics Ltd.
-
Page 5: Table Of Contents
Leaders in Pipeline Survey Systems OUTLINE OF THE C-SCAN SYSTEM................5 Signal generator ......................5 Detector unit........................6 GENERATOR - CONTROLS ..................... 8 Generator – Front Panel....................8 Generator – Side Panel ....................8 GENERATOR - GENERAL DESCRIPTION..............9 Operating environment ....................9 Power requirements/battery .................. - Page 6 Leaders in Pipeline Survey Systems 5.16 High soil resistivities ....................22 5.17 Changes in soil resistivity..................23 5.18 New pipelines ......................23 INTERFERENCE AND FIELD DISTORTION..............24 The C-SCAN signal ..................... 24 Ground lead interference ................... 24 Other signals carried by the pipeline ............... 24 Buried metal structures .....................
- Page 7 Leaders in Pipeline Survey Systems PRINCIPLES OF OPERATION An electrical current applied to a well wrapped buried metal pipeline will decrease gradually with increasing distance from the current injection point, as the current escapes to earth through the wrapping. If the wrap has a uniform thickness and separates the pipe from the surrounding soil at all points, the strength of the signal current on the pipe will decline logarithmically, and the rate of decline will be dependant primarily on the electrical resistivity of the wrap or coating in use, and the area of wrap in contact with the soil per unit length of pipe (i.e.
-
Page 8: Outline Of The C-Scan System
Leaders in Pipeline Survey Systems 1 OUTLINE OF THE C-SCAN SYSTEM The main elements of the C-SCAN Pipeline Wrapping Evaluation System are the Signal Generator and the Detector Unit. The Signal Generator is attached to the pipeline and to an appropriate ground point, and produces a constant AC signal which passes along the pipe. -
Page 9: Detector Unit
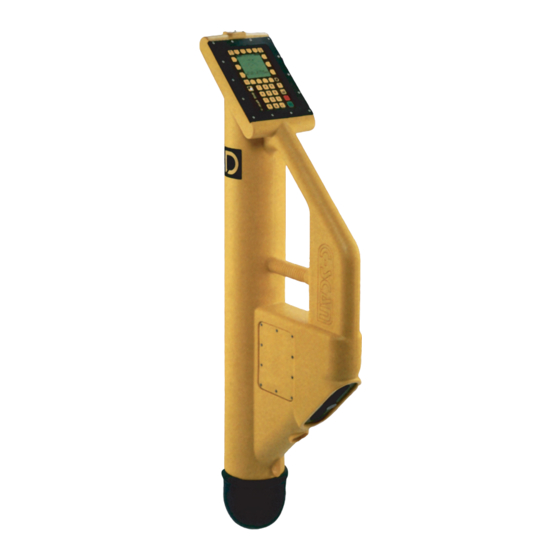
Leaders in Pipeline Survey Systems Detector unit The Detector Unit is housed in a weatherproof plastic case. The front tube contains the antenna system, and the keyboard and LCD display are mounted on the top of the tube. The base compartment contains the main computer, the batteries and connectors. - Page 10 At the end of a survey (or whenever required) the Detector Unit may be plugged into a standard computer (RS232 serial interface) and the survey report can be printed out in full, using Dynalog’s DCAPP software. The Detector Unit is powered by NiMh rechargeable batteries which will normally provide enough power to run the instrument continuously for over 4 hours.
-
Page 11: Generator - Controls
Leaders in Pipeline Survey Systems 2 GENERATOR - Controls 2.1 Generator – Front Panel Auto Select key sets the ON/OFF key – pressing output to 600mA OR to the and holding this key maximum attainable switches the generator ON. current below 600mA. If the generator is on, Pressing and holding key pressing and holding this... -
Page 12: Generator - General Description
Leaders in Pipeline Survey Systems 3 GENERATOR - GENERAL DESCRIPTION The C-SCAN Generator is a self-contained unit producing an AC signal current of 937.5 Hz. 3.1 Operating environment The generator is housed in a strong weatherproof plastic case, but it is not designed for total immersion and is not certified for use in hazardous areas. - Page 13 Leaders in Pipeline Survey Systems Stage 1. -- CHARGING -- <04:22 Remaining This stage can last up to 6 hours if the battery is very low. This 9.0% Capacity message shows estimated time to charge is 4 hours 22 Stage 1 minutes, battery capacity is 9.0%.
-
Page 14: Generator - Field Operations
Despite warnings in the manual against this, accidents do happen. Dynalog has added new checks to the generator to help guard against these accidents. Although not foolproof, the new checks should stop 90% of mistakes. -
Page 15: Setting The Signal Current
Leaders in Pipeline Survey Systems Use of existing ground points (other than CP ground beds), such as water pipes, lamp posts, steel fences, pylons, etc, may be necessary in some situations but must be chosen with care. If such structures are used as ground points it is essential to ensure that they do not approach or cross over the pipeline being surveyed at any point. -
Page 16: Pipeline Voltage Message
Leaders in Pipeline Survey Systems 4.3 Pipeline Voltage message Pipeline Voltage When the current is set and when the generator is switched on, too high!! the generator will check the existing AC voltage on the pipeline (the AC component of the pipe to soil potential). If this is too Disconnect CP high (greater than 10v rms) then a warning will be shown. -
Page 17: Apparent Problems With Current Value
Leaders in Pipeline Survey Systems 4.5 Apparent problems with Current value The resistances in the generator-pipe circuit define the maximum operating current. The circuit resistances consist of the following components: Pipe to soil resistance ≈ 3Ω – usually small because of the large area in contact Generator to pipe connection ≈... -
Page 18: Display Details
Leaders in Pipeline Survey Systems 4.6 Display details Estimated survey time remaining at set current Battery capacity Internal temperature – Maximum is 75 06:49 i25° GENERATOR OUTPUT SET to 600mA 16w 10.7v 10Ω Battery state indicator – Resistance between Earth Battery symbol replaced and Pipeline. -
Page 19: Key Sequence For Auto Operation
Leaders in Pipeline Survey Systems 4.7 Key sequence for AUTO operation AUTO Operation Press & Hold On / Off C-SCAN GENERATOR C-SCAN GENERATOR CHECKING OK! Pipeline V3.33 99.8% AUTO for 600mA or for MANUAL Hold AUTO ▲ for 1000mA 100% 16:40 100% 08:40... -
Page 20: Key Sequence For Manual Operation
Leaders in Pipeline Survey Systems 4.8 Key sequence for MANUAL operation MANUAL Operation Press & Hold On / Off C-SCAN GENERATOR C-SCAN GENERATOR Or from CHECKING OK! Pipeline AUTO V3.33 99.8% Operation AUTO for 600mA or for MANUAL Hold AUTO ▲... -
Page 21: Survey Planning And Interpretation Of Results
No two pipelines will produce identical survey results because of variations in size, coating, age, soil conditions, etc. but Dynalog has built up field experience over an extended series of trials which can provide initial guidance on survey planning and interpretation of the results obtained. -
Page 22: Attenuation Values
Leaders in Pipeline Survey Systems excavation and repair. On a pipeline that has not been surveyed with a C-SCAN system before, it is important that the distance is short so that all anomalies can be captured. 5.6 Attenuation values Typical attenuation values for well protected lines of various sizes are: Values of conductance imposed by NACE TM0102-2002 fall into the following categories: Less than 100 uS/m... -
Page 23: Initial Survey
Leaders in Pipeline Survey Systems Research has been carried out on the relationship between coating conductance and attenuation. The above graph shows this relationship, assuming the ground resistance is1000 ohm cm. The C-SCAN 2010 indicates coating conductance (see 2010 operators manual). 5.7 Initial survey When starting on a new line, the Operator should make some test readings over two or three sections (typically 50-100 metres). -
Page 24: Fault Size
Leaders in Pipeline Survey Systems 5.9 Fault size On trial surveys, it has been found that there is some correlation between ‘point’ attenuation and size of fault. A local loss of 100-150 mb (10-15% reduction in signal current) has indicated a pinhole fault of about 1 sq. mm. while at the other extreme a loss of 1,500 mb (85% loss of signal current) was associated with approximately 1 square metre of exposed pipe. -
Page 25: Close Interval Surveys
Leaders in Pipeline Survey Systems 5.13 Close interval surveys To locate specific faults, the suspect section should be narrowed down to 20-50 metres. This will either be done by ‘halving’ or by taking attenuation readings at closer intervals in areas commonly associated with faults (see 5.3). -
Page 26: Changes In Soil Resistivity
Leaders in Pipeline Survey Systems As can be seen above, when soil resistivities are above 100k ohm.cm, the change in attenuation between fair and bad (500µS/m and 2000µS/m ) is very small. 5.17 Changes in soil resistivity Resistivity changes during the course of a survey should not materially affect the results, as the current stabilising circuitry in the Signal Generator will ensure that the applied signal current remains constant despite such changes, until deliberately altered by the Operator. -
Page 27: Interference And Field Distortion
Leaders in Pipeline Survey Systems 6 INTERFERENCE AND FIELD DISTORTION 6.1 The C-SCAN signal The C-SCAN System operates with a ‘clean’ sine wave signal of 937.5Hz. The band width of the filters on the Detector Unit is less than 20Hz. The frequency used and the small band width have been selected to minimise interference from commonly occurring frequencies while maximising the distance that the signal can travel and still provide useful data (5-10 kilometres on a reasonably well protected pipe). -
Page 28: Cross Bonds
Leaders in Pipeline Survey Systems 6.5 Cross bonds Pipelines which run near each other are frequently bonded to reduce the possibility of corrosion being induced on one of them by a high CP potential on the other. These bonds can usually be disconnected at CP test posts. - Page 29 Leaders in Pipeline Survey Systems There are 4 recognised methods to survey near to, or across an IJ Use a link to bridge the IJ Use the IJ as the injection point – note ALL the signal will be sent in one direction along the pipeline...
-
Page 30: Sacrificial Anodes
Leaders in Pipeline Survey Systems Use the SPIKES for the ground connection but in this instance only run the earth cable parrallel to the pipeline 6.7 Sacrificial anodes These are generally used instead of an applied CP current as a means of protecting the pipeline. -
Page 31: Orientation Of Detector To Pipe Axis
Leaders in Pipeline Survey Systems 6.11 Orientation of Detector to Pipe Axis The C-SCAN Detector uses the vector sum of the outputs from the antenna coils so that variations in the horizontal angle between the axis of the instrument and that of the pipe are compensated for (although it is good practice always to approach the pipe from the same side and approximately at right angles to its axis).Although the main source of potential operator error is eliminated, there is still the necessity to ensure that the axis of the Detector antenna is... -
Page 32: Examples
Leaders in Pipeline Survey Systems 7 EXAMPLES 7.1 Example 1 Survey shows 6 survey points taken over 1151m. Two fault areas are identified by the high attenuations between #1- #2 and #4 - #5 A C-SCAN close interval survey was then carried out from just before #1 until a defect was found. -
Page 33: Example 2
Leaders in Pipeline Survey Systems 7.2 Example 2 Survey shows 5 point over 600m. A problem was shown to exist here as a high attenuation between #2 - #3. A subsequent Close-Interval Plot shows defects at 9m (30’). This lined up with defecting joint wrapping. -
Page 34: Dcapp 2010
Leaders in Pipeline Survey Systems PART 2 8 DCAPP 2010 DATA CAPTURE, ARCHIVING PLOTTER PROGRAM SURVEY PROCEDURE MANUAL Version 5.01... - Page 35 To install DCAPP 2010, insert CD. Install should AutoRun, if it doesn’t then locate setup.exe on the CD and double click on it. After installation, DCAPP 2010 will appear on the Programs list under Dynalog. Click on DCAPP 2010 to start. Attenuation or The start-up screen will look like this:...
- Page 36 Leaders in Pipeline Survey Systems Explanation of toolbar buttons The toolbar looks like this – Show Attenuation graph Show Conductance graph Show Pipeline Details Display Table Select Next Survey Survey shown Select Previous Survey Show Map display. This Print data and/or graphs button will only appear if Google Earth is installed Save file...
- Page 37 Leaders in Pipeline Survey Systems Additional windows – Table This shows the tabular data for a particular survey. Points may be disabled by clearing the tick box. The data is then re-calculated and the graphs re-drawn ignoring the disabled point. Additional windows –...
- Page 38 Leaders in Pipeline Survey Systems How to download from C-SCAN Click the DL button and follow instructions. Downloaded data will appear here Saving and Printing is self-explanatory. SURVEY PROCEDURE MANUAL Version 5.01...
-
Page 39: Faq And Other Notes
Leaders in Pipeline Survey Systems PART 3 9 FAQ and other notes 9.1 TR Stations – The need to disconnect 1) Do I have to disconnect the TR station? There are several answers to this question: a) If you want to connect the generator ACROSS the TR station (i.e. use the TR station to apply the signal to the pipeline) then YES you MUST disconnect the TR station. -
Page 40: Generator Connection Problems
Leaders in Pipeline Survey Systems 9.2 Generator Connection Problems Connecting the generator consists of two parts, connecting to the Pipeline and connecting to a suitable Earth. 9.2.1 Connecting to the Pipeline: The biggest problem is a result of not actually connecting to the pipeline when you think you have, examples include: Cause Remedy...
Need help?
Do you have a question about the C-SCAN 2000 Series and is the answer not in the manual?
Questions and answers