Dynalog C-SCAN 2000 Series System Manual
Hide thumbs
Also See for C-SCAN 2000 Series:
- Operator's manual (41 pages) ,
- Survey procedure manual (40 pages) ,
- Operator's manual (39 pages)

Related Manuals for Dynalog C-SCAN 2000 Series


Summary of Contents for Dynalog C-SCAN 2000 Series
- Page 1 For Model 2010 SYSTEM MANUAL Dynalog Electronics Limited Bristol, England www.dynalog.co.uk...
- Page 2 Dynalog Software Please read Licence Agreement overleaf before installing Contents of Applications CD The programs listed below are available on the Applications CD provided with your C-SCAN Survey System. To install any of the applications or print a copy of this manual, place the CD in your drive and the installer should autorun index.html in your default web browser.
- Page 3 7.3.3 any special or indirect or consequential losses in any case whether or not such losses were advised to DYNALOG or its dealer, suffered or incurred by the Purchaser arising out of or in connection with the use by the Purchaser of the Program, or any other matter under this Agreement.
- Page 4 Maintenance of this equipment should only be carried out by qualified personnel. The material contained in this Manual is copyrighted by Dynalog Electronics Ltd, and is not to be photocopied, duplicated, or reproduced in any form without the express written consent of Dynalog Electronics Ltd.
-
Page 5: Table Of Contents
OUTLINE OF THE C-SCAN SYSTEM............... 7 1.1. Signal Generator ....................7 1.2. Detector Unit ......................8 UNPACKING AND ACTIVATING THE C-SCAN 2010 SURVEY SYSTEM ....9 2.1. Unpacking......................9 2.2. Charging the Signal Generator ................9 2.3. Signal Generator External Power ..............11 2.4. - Page 6 DETECTOR UNIT – FIELD OPERATIONS ............. 31 6.1. Operating Environment ..................31 6.2. Survey Principles ....................31 6.2.1. Survey Type ..................... 31 6.2.2. Survey Procedure Overview ................32 6.3. Survey Planning ....................32 6.3.1. Preparation....................... 32 6.3.2. Planning......................33 6.3.3. Common Fault Areas..................
- Page 7 7.13. New Pipelines ...................... 53 INTERFERENCE AND FIELD DISTORTION ............54 8.1. The C-SCAN Signal ..................... 54 8.2. Ground Lead Interference .................. 54 8.3. Other Signals Carried by the Pipeline............... 54 8.4. Buried Metal Structures..................54 8.5. Cross Bonds......................55 8.6.
- Page 8 12.4. Geo-fencing ......................74 BATTERY INFORMATION ..................74 13.1. Battery Life ......................74 13.2. Battery Indicator....................76 13.3. Power Modes ....................... 76 UPGRADING ......................76 DIAGNOSTICS ......................77 FAQ / NOTES ......................79 16.1. TR Stations – The need to disconnect .............. 79 16.2.
- Page 9 PRINCIPLES OF OPERATION An electrical current applied to a well coated buried metal pipeline will decrease gradually with increasing distance from the current injection point, as the current escapes to earth through the coating. If the coating has a uniform thickness and separates the pipeline from the surrounding soil at all points, the strength of the signal current on the pipeline will decline logarithmically, and the rate of decline will be dependant primarily on the electrical resistivity of the wrap or coating in use, and the area of coating in contact with the soil per unit length of pipe (i.e.
-
Page 10: Outline Of The C-Scan System
1. OUTLINE OF THE C-SCAN SYSTEM The main elements of the C-SCAN Pipeline Coating Evaluation System are the Signal Generator and the Detector Unit. The Signal Generator is connected to the pipeline and to an appropriate ground point, and generates a constant AC signal which passes along the pipeline, this in turn produces an electromagnetic field which radiates from the pipeline. -
Page 11: Detector Unit
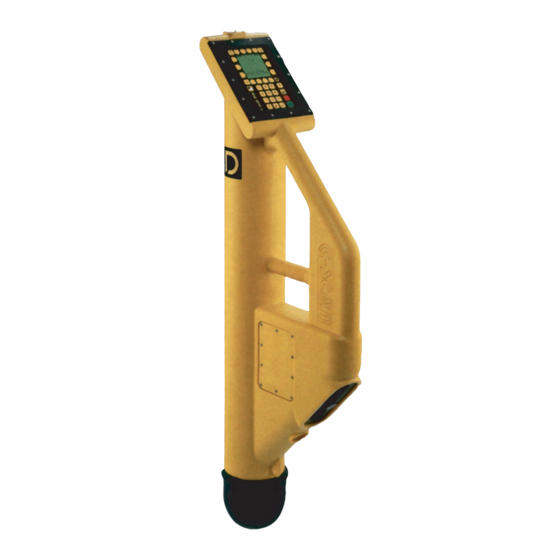
1.2. Detector Unit The Detector Unit is housed in a weatherproof plastic case. The front tube contains the antenna system, and the keyboard and LCD display are mounted on the top of the tube with the main computer and GPS system. The base compartment contains the communications and charger computer, the batteries and connectors. -
Page 12: Unpacking And Activating The C-Scan 2010 Survey System
At the end of a survey (or whenever required) the Detector Unit may be plugged into a standard computer via the USB connector (or RS232 serial interface) and the survey data can be downloaded and/or printed out in full, using Dynalog’s DCAPP software. The Detector Unit is powered by either NiMH rechargeable batteries which will normally provide enough power to run the instrument continuously for over 4 hours, or by Alkaline C cells, which will provide approximately 12 hours of continuous use. - Page 13 The charging cycle is in four stages: Stage 1 charges to 80%. Stage 2 charges to 99%, Stage 3 charges to 100%+ and balances the battery and Stage 4 is the float charge which can remain active indefinitely. Stage 1. -- CHARGING -- <04:22 Remaining This stage can last up to 6 hours if the battery is very low.
-
Page 14: Signal Generator External Power
2.3. Signal Generator External Power If the internal battery of the Signal Generator is too low to complete or carry out a survey and there is no time to charge the Signal Generator, an external 12-18 volt battery (car battery etc.) can be connected using the cable supplied (9-way socket terminated with red and black crocodile clips). - Page 15 Fig. 2.2 – Inserting Batteries The LCD will now display either the clock and date setting panels (if these have not been factory set - Figs 2.3a & 2.3b below) or the Start-up screen. To set the time and date use the ◄&►...
- Page 16 • Standard charging procedure − Locate the battery charger port on the right hand side of the Detector and unscrew the port cover − With the Detector in the OFF state, attach the battery charger and connect the charger power cord to a mains outlet socket – voltage selection is automatic. Make sure the mains outlet is ‘live’...
- Page 17 The Detector draws a small amount of current from the batteries when it is switched off at the Control/Display Panel I/O switch but with the main power isolator switch left ON. If left for a long period in this state the charge in the batteries will eventually be reduced to zero. If the unit is to be inactive for a period of time switch the main power isolator to OFF.
-
Page 18: Overview
3. OVERVIEW This section gives an overview of the Signal Generator and Detector Unit, looking at the keypad interfaces, displays and icons and connections for each part of the C-SCAN 2010 system. 3.1. Signal Generator – Keypad ON/OFF: Pressing and AUTO: Sets the output to holding this key 600mA or maximum... -
Page 19: Signal Generator - Side Panel
3.3. Signal Generator – Side Panel Connection to PIPELINE Connection to BATTERY suitable EARTH isolator switch. CHARGER or AUXILIARY USB Diagnostic / power connector Upgrade port 3.4. Detector Unit – Front Panel The C-SCAN 2010 is the next generation design in the 2000 series Pipeline Survey System. -
Page 20: Detector Unit - Display
Where possible, all displays are language independent, with graphic icons representing features or functions: Depth to Centre Depth to top (cover) Current Attenuation Chainage Distance Symbols relating to landscape features such as trees, walls, fences, roads, rivers, pylons, etc. Symbols are available with the indicator on the left or right side Symbol for GPS 3.5. -
Page 21: Lcd Contrast
3.5.1. LCD Contrast The LCD display on the C-SCAN Detector uses a temperature sensor to track the contrast with ambient temperature. In normal use this will only need to be adjusted to suit personal preference, but in cases of extreme temperature the contrast on the display may require adjustment. -
Page 22: Signal Generator - Field Operations
4. SIGNAL GENERATOR - FIELD OPERATIONS 4.1. Operating Environments The Signal Generator is housed in a strong weatherproof high impact structural copolymer case, but it is not designed for total immersion and is not certified for use in hazardous areas. The Signal Generator will operate between -4 F and +104 F. -
Page 23: Signal Interference
• Set the multi-meter to DC volts and re-connect between the Pipe and Ground leads as before – and again, before they are connected to the Signal Generator. If the DC voltage is greater than +/-10v – DO NOT CONNECT SIGNAL GENERATOR The source of either foreign signal must be found and isolated before a survey can be started. - Page 24 DISCONNECT TR station from Ground Bed and Pipeline Fig 4.1 – Disconnecting ground bed Although it is likely to be the best connection, it is incorrect to assume that the TR station has a perfect connection to the pipeline, as the cables connection the TR station to both the pipeline and ground bed may themselves be suffering corrosion or wear that is masked by high CP currents/voltages.
-
Page 25: Setting The Signal Current
Fig 4.3 – Fixing earth spikes perpendicular to pipeline Use of existing ground points (other than TR/CP ground beds), such as water pipes, lamp posts, steel fences, pylons, etc., may be necessary in some situations but must be chosen with care. If such structures are used as ground points it is essential to ensure that they do not approach or cross over the pipeline being surveyed at any point. -
Page 26: Pipeline Voltage Message
4.6. Pipeline Voltage message The Signal Generator will check the existing AC voltage on the Pipeline Voltage pipeline (the AC component of the pipe to soil potential) when too high!! it is first switched on and again when a current has been Disconnect CP selected. -
Page 27: Apparent Problems With Current Value
4.8. Apparent Problems with Current Value The maximum signal current achievable will be defined by the resistances in the Signal Generator–pipeline circuit. The circuit resistances consist of the following components: 1. Pipe to soil resistance ≈ 3Ω – usually small because of the large area in contact 2. -
Page 28: Key Sequence For Auto Operation
4.9. Key Sequence for AUTO Operation AUTO Operation On / Off 5 Seconds C-SCAN GENERATOR C-SCAN GENERATOR CHECKING OK! Pipeline V3.33 99.8% AUTO for 600mA or for MANUAL Hold AUTO ▲ for 1000mA 100% 16:40 100% 08:40 AUTO AUTO 937.5Hz AUTO 937.5Hz AUTO... -
Page 29: Key Sequence For Manual Operation
4.10. Key sequence for MANUAL operation MANUAL Operation On / Off 5 Seconds C-SCAN GENERATOR C-SCAN GENERATOR Or from CHECKING OK! Pipeline AUTO V3.33 99.8% Operation AUTO for 600mA or for MANUAL Hold AUTO ▲ for 1000mA MANUAL use Keys HOLD AUTO ▼/▲... -
Page 30: Detector Unit - Principal Display Screens
5. DETECTOR UNIT – Principal Display Screens 5.1. Start-up Screen When the Detector Unit is turned on it will complete a series of self checks and then the START-UP screen will be displayed, as shown in figure 5.1 (right). The information displayed here is: •... -
Page 31: Search Screen
A final confirmation screen will confirm your selection (Fig. 5.3). If correct, select the key again to continue. If further editing of the specification is required, press key to return to the PIPELINE SPECIFICATION screen. Notes: Wall thickness may not be known, in which case select the “???”... -
Page 32: Menu Screen
NOTE: The circle equals to a 6ft 6” radius. If the pipeline is greater than 6ft 6” away then the line will stay at the periphery of the circle. The number above the circle indicates the horizontal distance in feet (3.9ft in this example). If the pipeline is out of range no figure will be displayed. -
Page 33: Survey Screens
Setup: Pressing SETUP opens the SETUP screen, allowing the following options to be set or updated: Option Description Section • Prog Upgrade the Firmware inside the C-SCAN • Demo Turn On/Off Demo mode • Exit screen • GPS − Re-configure GPS system Setup −... -
Page 34: Detector Unit - Field Operations
6.2.1. Survey Type When using C-SCAN to survey a pipeline for the first time, Dynalog recommends the following as a survey method: Baseline Survey The first survey carried out needs to build a baseline data profile of the pipeline. -
Page 35: Survey Procedure Overview
No two pipelines will produce identical survey results because of variations in size, coating, age, soil conditions, etc., but Dynalog has built up field experience over an extended series of trials which can provide initial guidance on survey planning and interpretation of the results obtained. -
Page 36: Planning
6.3.2. Planning In planning a survey, particularly on a pipeline that has not been C-SCAN surveyed before, it is helpful to reference survey point locations and signal injection locations that can be marked on the map. Signal injection requires conductive electrical access to the pipeline and must therefore be at CP Test Posts, TR Stations, or possibly block valves, insulation joints, etc. -
Page 37: Locate Overhead
6.4.3. Locate Overhead In order to take a reading the Detector needs to be directly over the pipeline – overhead. Having located the pipeline as above, the surveyor will now move the Detector carefully until the two black ‘overhead’ bars at the top of the SEARCH screen begin to close, as shown below. - Page 38 ii) Calculate After a small delay (indicated by the hour-glass symbol) the screen will display the calculated results – see Fig. 6.6 right. The Depth of Cover , Depth to Centre and Current remaining on the pipeline are shown. Statistical analysis shows the error function for depth and current (shown as +/- 0.00 in this example).
-
Page 39: Subsequent Samples
iv) Start Point Screen The START POINT screen in Fig. 6.8 is the final screen before data is stored in memory. As before, an overview of the data is given at the top of the screen, but this time with the addition of the following: │↔│... -
Page 40: Entering Distance
6.4.6. Entering Distance Once a sample has been taken the Surveyor will store this data and will need to tell the system the distance between this and the previous survey point (or Start Point). When you reach the STORE DATA screen in 6.4.4 iii) it will differ slightly from when a Start Point was being entered. -
Page 41: Graphs
This final screen provides a summary of the information before the data is permanently stored in memory. As with the Start Point, the Depth, Cover and Distance/Chainage information is shown, but as the Detector now has distance information from the previous survey point, values of Conductance and Resistance can now be displayed as in Fig 6.11. -
Page 42: Low Signal
Within each graph the following options are available: ◄# - Move to previous survey point #► - Move to next survey point To return to the START-UP screen press the SEARCH icon ( ). The Detector is now ready to move to the next survey position and repeat the above process. 6.4.8. -
Page 43: Notes On Entering Distances
6.6. Notes on Entering Distances The distance that is entered is crucial to calculating the correct attenuation; hence it is very important that this value is correct. Remember that the distance entered relates to pipeline distance, not the direct distance between two points. If two successive points are taken around a bend in a pipeline and GPS is being used, it is important to enter the pipeline distance and NOT use the GPS distance, as this will cause an error. - Page 44 Screen 1: Distance Screen 2: Chainage Start Point Chainage Start Point Select Distance button to enter Select Chainage button to enter distance screen (screen 1 – chainage screen (screen 2 – opposite) opposite) Fig. 6.14 – Entering Chainage NOTE: We may freely switch between CHAINAGE and DISTANCE. When a distance is entered, the chainage is automatically stored (it is displayed on the attenuation display).
-
Page 45: Fault Location
6.8. Fault Location There are two stages to fault location; firstly a closer inspection is required to locate the areas of high attenuation and reduce these to smaller sections of pipeline. This is needed to confirm if high attenuation readings are due to either a single anomaly or an area of general degradation in the coating. -
Page 46: Close Interval Mode
The graph in Fig 6.16 shows attenuation values as the points were gathered i.e. sequenced in time ( ). The two low reading of points #00 #01 & #01 #02 are followed by the 10mB/m reading between points #02 #03 as these were the order in which they were taken. - Page 47 To start a close interval survey enter the search screen ( ) and locate the pipeline as normal, but rather than press the calculate key ( ), press the key marked ‘close’ instead. This will reveal the following screen: The Surveyor is then asked to choose the interval at which the Close Interval readings will be taken.
- Page 48 When a reading is ready to be taken, the calculate key ( ) is used as normal. The Detector will take a range of samples as before, but instead of changing to the STORE screen, the graph changes to a vertical bar showing the maximum, minimum and average current readings taken for this point.
- Page 49 When conducting a Close Interval survey to locate a specific anomaly, one of two results will normally be seen. These are: As in the above example, this graph shows a single anomaly. The current on the pipeline is quite stable when measured at such a short distance, but then a sudden drop is seen before the current levels out again.
-
Page 50: Survey Planning And Interpretation Of Results
7. SURVEY PLANNING AND INTERPRETATION OF RESULTS 7.1. Distance Between Survey Points When carrying out a survey, the distance between survey points is one of the decisions that the Surveyor will have to make. The optimum distance between readings will depend on two main factors: the general quality of the line and the minimum size of anomaly that is likely to require accurate location for excavation, investigation and repair. -
Page 51: Conductance
Fig. 7.1 – Maximum attenuations with soil resistivities It is possible to reach or even exceed these maximum attenuation levels if the pipeline being surveyed is in contact with a foreign object, which itself is shorted to ground, as this can provide a lower resistance path than the surrounding soil. - Page 52 As C-SCAN uses an AC detection method, the conductance per square metre is dependent on an additional factor of coating type. The Detector uses an average value to give a general indication of conductance and also assumes 1,000 Ω.cm soil. If a more definitive value is required, the coating type and soil resistivity can be entered into DCAPP.
-
Page 53: Signal Range
7.4. Signal Range When connected to a pipeline, the range of the signal applied by the Signal Generator is dependant on the following criteria: Wrap/Coating condition Amount of signal applied For a pipeline with poor coating, the attenuations will be high and therefore the range will be limited as more of the signal is ‘leaked’... -
Page 54: Minimum Distance Between Survey Points
7.6. Minimum Distance Between Survey Points Unless a pipeline is in extremely poor condition, it is not generally advisable to take attenuation measurements at less than 50ft intervals, because the possible signal errors are of a similar size to the signal loss on a well protected pipeline over such a short distance. -
Page 55: Long Term Program
7.10. Long Term Program A long term survey programme and good record keeping is essential if the full benefit is to be obtained from this equipment. After the baseline survey has been completed, the following approach is suggested: a) Carry out a general survey of whole pipeline at intervals of around 1,000ft (shorter on high risk sections). -
Page 56: Changes In Soil Resistivity
Fig 7.4 – Attenuation v Conductance for various ground resistivities By studying the graph it can be seen that when soil resistivities are above 100k ohm.cm, the change in attenuation between fair and bad (500µS/m and 2000µS/m ) is very small. There is very little change in attenuation on the 1M Ω.cm &... -
Page 57: Interference And Field Distortion
8. INTERFERENCE AND FIELD DISTORTION 8.1. The C-SCAN Signal The C-SCAN System operates with a ‘clean’ sine wave signal of 937.5Hz. The band width of the filters on the Detector is less than 20Hz. The frequency used and the small band width have been selected to minimise interference from commonly occurring frequencies while maximising the distance that the signal can travel and still provide useful data (3-6 miles on a reasonably well protected pipeline). -
Page 58: Cross Bonds
8.5. Cross Bonds Pipelines which run near to each other are frequently bonded to reduce the possibility of corrosion being induced on one of them by a high CP potential on the other. These bonds can usually be disconnected at CP test posts. It is usually advisable to disconnect all cross-bonds for at least the next 3 to 6 miles when carrying out a survey. - Page 59 There are 4 recognised methods to survey near to, or across, an Insulation Joint: Use a link to bridge the IJ. Both sections of the pipeline either side of the joint can be surveyed as if the joint were not there Use the IJ as the injection point This has the additional benefit that the entire signal will be sent in one direction...
-
Page 60: Sacrificial Anodes
8.7. Sacrificial Anodes These are generally used instead of an applied CP current as a means of protecting the pipeline. They will show up as ‘faults’ on a C-SCAN survey and should be disconnected if possible because they will severely reduce the available current and thus shorten the length of pipeline that can be surveyed from one Signal Generator location. -
Page 61: Orientation Of Detector To Pipe Axis
8.11. Orientation of Detector to Pipe Axis The C-SCAN Detector uses the vector sum of the outputs from the antenna coils so that variations in the horizontal angle between the axis of the instrument and that of the pipeline are compensated for (although it is good practice always to approach the pipeline from the same side and approximately at right angles to its axis). -
Page 62: Examples
9. EXAMPLES 9.1. Example 1 Survey shows 6 survey points taken over 3,776ft. These two anomaly areas were identified by the high attenuations seen between survey points #1 #2 and A C-SCAN Close Interval survey was then carried out from just before survey point #1. -
Page 63: Example 2
9.2. Example 2 This survey shows 5 points over 600ft. A problem was shown to exist here as a high attenuation between survey points #2 As in Example 1, a subsequent Close Interval survey was carried out. The results of this showed defects at 30ft intervals. -
Page 64: Demo Mode
DEMO MODE Contained within the C-SCAN 2010 Detector is a pre-loaded set of survey data. This data is supplied to enable the user to practice the technique of surveying without the need to connect to a pipeline. The four surveys included are tabled below so that any self training can be verified against the correct data. - Page 65 Survey 1 (S#00) Data Current Depth Latitude Longitude Distance Chainage Attenuation Point 163.4 4.23 44N29.534' 012W02.850' 0.00 156.6 4.07 44N29.485' 012W03.050' 918.6 918.6 0.13 88.52 4.30 44N29.467' 012W03.150' 446.2 1364.8 3.64 85.91 4.04 44N29.440' 012W03.300' 672.6 2037.4 0.13 85.38 3.41 44N29.430' 012W03.384' 367.5...
-
Page 66: Dcapp
DCAPP Data Capture, Archiving and Plotter Program - Types: EXCEL, 2010, GE DCAPP is Dynalog’s propriety software for downloading data from C-SCAN. Once data has been downloaded it can be investigate, errors amended and data printed or exported. Beginning as DCAPP for EXCEL, it has now evolved into the latest version, DCAPP GE. -
Page 67: Additional Windows
Below is a close up of the toolbar buttons and their functions: Download from C-Scan Show Pipeline Details Open Existing File Show Conductance Graph Save File Show Attenuation Graph Plot Pipeline on Map Print/Export Data and Graphs (Google Earth/KML software required) Display Table Tools Menu Survey Navigation Bar... - Page 68 Fig 11.4 – Table view Summary of options in Table View: Hide - Hide Table View Enable All - Re-enable all suppressed points Convert to Feet - Convert to decimal feet or feet and inches Pipeline Details - Opens the Survey Details box Surveying TOWARDS - If a survey has been taken towards the Generator the Generator...
-
Page 69: Pipeline Details
function is used, DCAPP analyses the data in reverse form (from last point to first point) suppressing points that cause negative attenuations. These points can be re- enabled at anytime. The following options are available when using this function: - Use disabled points - If the user has manually disabled (suppressed) any points in a survey, these points will still be used in any calculations as if they had not been disabled. -
Page 70: How To Download From C-Scan
11.2. How to download from C-SCAN To download data from the C-SCAN Detector to DCAPP, firstly connect the Detector to your computer using a USB cable (or serial cable) then open DCAPP. DCAPP will check for active COM ports on your computer, with COM1 (serial port) being the default. If using a USB interface to download data, either directly or though a serial-to-USB converter, then you will need to change the active COM port. -
Page 71: Saving, Printing & Exporting
Note: Ensure that any regional settings on the download computer uses either a full stop (.) or comma (,) as a decimal separator. Any other character will report ‘no data’. *for more information on which COM ports are active on your computer, see Appendix 1 11.3. -
Page 72: Advanced Functions
Simply select the fields that you wish to export then click on either EXPORT CSV or EXPORT TXT and the data will be exported. You will be prompted to enter a file name before the data is saved, with the file extension of either .CSV or .TXT automatically added. -
Page 73: Gps Functions
11.4.2. GPS Functions DCAPP has the ability to fix surveys with missing or incorrect GPS data, or adjust surveys based on the GPS data that was recorded. To correct any GPS data, click on CHECK GPS from the START-UP screen to access the following window: Fig 11.12 –... -
Page 74: Auto Analyse
11.4.3. Auto Analyse The AUTO ANALYSE function in DCAPP can be used to produce a text report based on any Physical and Conditional results of a survey which fall outside of any set limits. For example, you can use the Auto Analyse function to process the data and indicate which survey points are under or over a certain depth of cover, quickly highlighting areas of the pipeline that are too close to the surface. -
Page 75: Clearing The Detector Memory
11.5. Clearing the Detector Memory When all data from the Detector has been downloaded it is advisable to clear the memory. From the Detector’s MENU screen select CLEAR and press to confirm. GPS is an abbreviation for Global Positioning System which consists of 24 satellites in low-earth orbit. -
Page 76: Gps Setup
GPS SET: Reset the GPS system REGION: Only use when instructed by Dynalog Update Loc.: If the Detector senses it is outside of its region then you can use the UPDATE LOC. function to update your current location (see Geo-fencing below) Fig 12.4 –... -
Page 77: Gps Reset
Serial protocol, NMEA data stream, 9600 baud, no parity, 8-bit, 1 stop, no handshaking. GPS stream must include: GGA or GLL and RMC or ZDA. If no external signal is received within 5 minutes the system will default to internal GPS. 12.3. - Page 78 poor quality batteries (especially re-chargeable types) will not deliver the same power. SYSTEM MANUAL Version 6.03i...
-
Page 79: Battery Indicator
Antennae ON UPGRADING Dynalog’s Upgrader software can be used to update the firmware within the Detector or confirm if the latest version is being used. To begin, install the Upgrader program from the Applications CD supplied with the C-SCAN system. Once installed, connect the Detector to the computer and then run the Upgrader program. -
Page 80: Diagnostics
If it is suspected that there is a fault with the Detector, the Diagnostics program can be used to interrogate and confirm the correct functioning of the various sub-systems within the Detector. If an error is found, a report is produced which can be sent to Dynalog for assessment and further advice. - Page 81 Fig 15.4 – Failures identified If any failures are detected, a diagnostics report is produced along with the option to send the report to Dynalog for further analysis. To do this click YES. Fig 15.5 – Diagnostics report A print screen will appear to allow you to print the test report.
-
Page 82: Faq / Notes
FAQ / NOTES 16.1. TR Stations – The need to disconnect Do I have to disconnect the TR station? There are several answers to this question: a) If you want to connect the generator across the TR station (i.e. use the TR station to apply the signal to the pipeline) then YES you MUST disconnect the TR station. -
Page 83: Connecting To The Pipeline
16.2.1. Connecting to the Pipeline When making a connection to the pipeline it is important to establish a low resistance connection and to ensure that the connection point is electrically connected to the pipeline. Many common mistakes are easily rectified: −... -
Page 84: Re-Call Calibration Settings
16.3. Re-call Calibration Settings The calibration data for the antenna is checked during the start-up sequence, if an error is found then the calibration details will be automatically restored from fixed memory. If an upgrade to the Detector has been completed, then similarly the calibration details are checked and restored automatically. -
Page 85: Display Messages
16.4. Display Messages Below is a list of display messages that may be encountered: SYSTEM MANUAL Version 6.03i... -
Page 86: Specification
Specification Detector Unit specifications Weight 7.5 kgs (16lbs) Size 18 x 47 x 120cm (7 x 18 x 47”) Construction One-piece Polyethylene (PE) moulding Sealing (Protection Class) IP65 (total immersion for 500mm) Antenna array Symmetrical multi-axis Maximum detection depth 9+ metres (30+ feet) in good conditions Accuracy +/- 2.5% to 3 metres (10 feet) +/- 5.0% to 9 metres (30 feet) - Page 87 Signal Generator specifications Weight 9.5 kgs (21lbs) Size 27 x 25 x 18cm (11 x 10 x 7”) Construction Ultra High Impact Structural Copolymer Mil- Spec case with hinged lid (MIL-C4150J) Sealing (Protection Class) IP66 Rechargeable battery 1 x 12v – 17Ahr sealed lead/acid (charger input: 100-240vAC 50-60Hz) External power 11 to 18v DC...
-
Page 88: Maintenance
As every battery has a life expectancy it is likely that at some point the Signal Generator battery will require replacement. Although Dynalog would recommend returning the Signal Generator for battery replacement, it has been designed so that users with the competency to carry out this task can do so with ease. -
Page 89: Appendix 1 - Com Ports In Windows
USB cable is used then a higher COM number is assigned automatically. Within Dynalog’s software only active COM ports will be displayed, so if the C-SCAN is the only USB device connected to the computer then only one COM port (in addition to COM1) will be shown and this can be selected in any of the required programs;... - Page 90 SYSTEM MANUAL Version 6.03i...
-
Page 91: Glossary
Cathodic Protection voltages. Data Point – A reading taken with the Detector produces a single data point. DCAPP – Data Capture, Archiving and Plotter Program. Dynalog’s proprietary software for downloading data from a C-SCAN Detector. Dielectric performance – The ability of the coating to act as an electrical insulator Earth Extension Lead –...
Need help?
Do you have a question about the C-SCAN 2000 Series and is the answer not in the manual?
Questions and answers