Tektronix TDS5000B Series Online Help Manual
Hide thumbs
Also See for TDS5000B Series:
- Online programmer manual (917 pages) ,
- Read this first manual (237 pages) ,
- Service manual (180 pages)

Related Manuals for Tektronix TDS5000B Series


Summary of Contents for Tektronix TDS5000B Series
- Page 1 Online Help TDS5000B Series Oscilloscopes PHP0237 Adapted from the TDS5000B Series Oscilloscopes online help Version 2.0 August, 2004...
-
Page 2: Table Of Contents
Table of Contents Getting Started Copyright Information About the TDS5000B Series Oscilloscope Product Description Product Software User Interface Map Installing Software Using Online Help Navigating the Online Help Documentation Support Information Feedback Standard Accessories Recommended Accessories Options Windows Interface Guidelines... - Page 3 IVI Drivers Menu Bar Mode Toolbar Mode Working with the TDS5000B Series Instrument Using the Instrument Interface Changing Control Settings Moving and Docking Control Windows Controlling from within the Graticule Area Access Shortcut Menus by Right-Clicking Initializing the Instrument Choosing and Connecting Probes...
- Page 4 Controls and Connections Multipurpose Knobs Vertical Controls Horizontal Controls MultiView Zoom Controls Trigger Controls Run Controls General Purpose Controls Front Panel Connectors Rear Panel Connectors Side Panel Connectors Optional Touch Screen On/Standby Switch File Menu Reference Waveform Controls Save As Dialog Box: Waveform Recall Dialog Box: Waveform Save As Dialog Box: Instrument Setup Recall Dialog Box: Instrument Setups...
- Page 5 Save As Dialog Box: Histogram Save As Dialog Box: Timestamp Edit Menu Copy Setup: Images Copy Setup: Waveforms Copy Setup: Measurements Autoset Undo Control Window Vertical Menu Vertical Setup Control Window Zoom Setup Control Window Zoom Control Window AutoScroll Control Window Graticule Zoom Control Window Waveform Display Control Window Waveform Label Control Window...
- Page 6 Display On/Off Vertical Position/Scale Offset Termination Channel Invert Coupling Setup Bandwidth Probe Controls Channel Invert Control Window Using Offset to Avoid Clipping Signals High Impedance Probes Low Impedance Probes Active Probes Probe Calibration Restrictions Horizontal/Acquisition Menu Horizontal/Acquisition Setup Control Window (Horizontal Tab) Record Length Horizontal Scale...
- Page 7 Horizontal Position/Scale Control Window: Scale Delay On 101 Resolution Control Window Acquisition Mode Control Window Horizontal/Acquisition Setup Control Window (Acquisition Tab) Acquisition Mode Fast Acquisitions Roll Mode Interactions of Roll Mode and Other Instrument Settings Incompatible Acquisition Features Sampling Modes FastFrame Setup Control Window Frame Setup Frame Viewing...
- Page 8 Glitch Trigger Control Window Width Trigger Control Window Runt Trigger Control Window Timeout Trigger Control Window Transition Time Trigger Control Window Setup and Hold Trigger Control Window Logic Pattern Trigger Control Window Logic State Trigger Control Window Window Trigger Control Window Video Trigger Control Window Comm Trigger Control Window Communication Trigger Codes and Standards (Option)
- Page 9 Display Persistence Waveform Intensity Display Format Waveform Interpolation Display Setup Control Window (Screen Text Tab) Display Setup Control Window (Objects Tab) Graticule Style Trigger Level Marker LCD Backlight Timeout Display Setup Control Window (Colors Tab) Color Palettes Display Palette Reference Color Math Color Text Properties Control Window Display Persistence Control Window...
- Page 10 Cursors Using XY Display Format Measurement Menu Measurement Setup Control Window Measurement Tabs: Amplitude Measurement Tabs: Time Measurement Tabs: More Measurement Tabs: Histogram Measurement Tabs: Communications Measurement Tabs: Communications More Measurements List Measurement Snapshot Control Window Measurement Statistics Control Window Reference Levels Control Window Gating Control Window Histogram Control Window...
- Page 11 Pass Fail Setup More Mask Polarity Mask Test Repeat Mask Pass/Fail Results Control Window Mask Test Summary Mask Hits Per Segment Mask Test Start or Reset Mask Test Controls Control Window Mask Configuration Display Control Window Mask Configuration Autoset Control Window Mask Autoset Vertical Controls Mask Autoset Horizontal Controls Mask Autoset Trigger Level Control...
- Page 12 Save Limit Test Dialog Box Math Menu Math Setup Control Window Math Waveform Properties Define Edit Expression Predefined Math Expressions Guidelines for Working with Math Waveforms Spectral Analysis Predefined Spectral Equation Editor Control Window Time Domain Tab Spectral Analysis (Freq) Tab Measurement List (Meas) Tab Variable List (Var Tab) Edit Controls...
- Page 13 Spectral Controls: Frequency Selecting a Spectral Window Text Edit Controls MyScope Menu MyScope Setup Control Window Using MyScope Control Windows Open or Edit MyScope Dialog Box Save MyScope File As Dialog Box Utilities Menu Set Time and Date GPIB Configuration Control Window LAN Server Status Control Window External Signals Control Window Touch Screen (Option)
- Page 14 Signal Connection Input Conditioning Probes and Signal Connection Coupling Scaling and Positioning Vertical Acquisition Window Considerations Horizontal Acquisition Window Considerations Autoset Considerations Horizontal Acquisition Window Interrelated Parameters Independent versus Shared Window Acquisition Hardware Sampling Process Sampling Modes Waveform Record Interleaving Triggering Concepts Trigger Sources Trigger Types...
- Page 15 Width Trigger Transition Time Trigger Timeout Trigger Pattern Trigger State Trigger Setup and Hold Trigger Window Trigger Video Trigger Communication Trigger Sequential Triggering Triggering with Horizontal Delay Off Triggering with Horizontal Delay On Triggering and Horizontal Delay Summary Display Overview Display Elements Acquisition Preview Waveform Display...
- Page 16 Creating Math Waveforms Math Waveform Sources Math Waveform Expression Syntax Math Waveform Differentiation Offset, Position, Scale, and Math Waveforms Waveform Integration Defining Spectral Math Waveforms Using the Spectral Math Controls Using the Time Controls Using the Gating Controls Using the Frequency Domain Controls Using the Magnitude Controls Using the Phase Controls Using Spectral Analyzer Windows...
- Page 17 Saving and Recalling Setups Saving and Recalling Waveforms Saving and Copying Waveform Data Spectral Analysis Overview Spectral Analysis Features FFT Process The FFT Display FFT Windows FFT Window Characteristics Time Domain Gating Aliasing Eliminating Aliasing Nyquist frequency Overview Tasks Setting Up Signal Input Setting Acquisition Modes Setting Up Roll Mode Using Fast Acquisitions...
- Page 18 Triggering on a Pattern Triggering on Logic State Triggering on Setup/Hold Time Violations Triggering on Window Threshold Violations Triggering on a Video Signal Triggering on a Sequence Triggering on a Communication Signal Displaying Waveforms Using MultiView Zoom with Waveforms Taking Automatic Measurements Localizing a Measurement Setting Cursor Sources Starting and Resetting Histogram Counting...
- Page 19 Saving a Screen Capture Saving Measurements Copying Waveform Data Creating MyScope Control Windows Editing MyScope Control Windows Tasks Calibrating Active Probes Calibrating Passive Probes Deskew Signal Path Compensation Signal Path Compensation Status Low Frequency Probe Compensation Taking Cursor Measurements Creating Reference Waveforms Saving Reference Waveforms using Auto-Increment File Name Recalling Reference Waveforms...
- Page 20 Adding Software Applications to the Instrument Creating an Emergency Startup Disk Backing Up User Files Using Roll Mode TDS5000B Series GPIB Programmer Online Help TDS5000B Series Oscilloscope Applications Software Trigger on A Event Only Triggering on an Event after a Specified Delay...
- Page 21 Printing Banners Inverting Channel Waveforms Connecting Probes Adjusting Display Contrast Using Mask Testing with Option SM Creating a User Mask with Option SM Saving Masks Recalling Masks Editing a User Mask Glossary Index...
-
Page 22: Getting Started
Copyright Information Copyright © Tektronix, Inc. All rights reserved. Licensed software products are owned by Tektronix or its suppliers and are protected by United States copyright laws and international treaty provisions. Use, duplication or disclosure by the Government is subject to restrictions as set forth in subparagraph (c)(1)(ii) of the Rights in Technical Data and Computer Software clause at DFARS 252.227-7013, or subparagraphs (c)(1) and (2) of the Commercial Computer Software—Restricted... -
Page 23: About The Tds5000B Series Oscilloscope
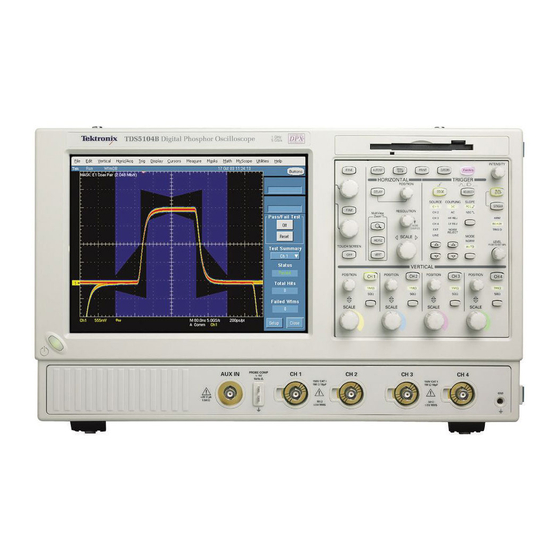
About the TDS5000B Series Oscilloscope Welcome to the Tektronix TDS5000B Series Oscilloscopes. The TDS5000B Series of Digital Phosphor Oscilloscopes (DPOs) provide the performance, simplicity, and connectivity needed for today’s ever-changing electronics, computer, and communications industries. The easy-to-use interface includes a large display screen and an optional touch-screen interface on a Microsoft Windows platform. - Page 24 Key Features TDS5000B Series oscilloscopes are high-performance solutions for verification, debugging, and characterization of sophisticated electronic designs. The series features exceptional signal acquisition performance, operational simplicity, and open connectivity to the design environment. Classic analog-style controls, a large display with an optional touch-sensitive screen, and graphical menus provide intuitive control.
- Page 25 Horizontal Delay. Use delay when you want to acquire a signal at a significant time interval after the trigger point. Toggle delay on and off to quickly compare the signal at two different points in time. Average, Envelope, Hi Res Acquisition, and WfmDB. Use Average acquisition mode to remove uncorrelated noise from your signal.
- Page 26 Trigger Features Simple and Advanced Trigger Types. Choose a simple edge trigger, or choose from up to twelve advanced trigger types to help you capture a specific signal fault or event. Dual Triggers. Use the A (main) trigger system alone or add the B trigger to capture more complex events.
-
Page 27: Product Software
Specifications Performance Verification Procedures. The product CD-ROM contains instrument specifications and instructions to perform a manual performance verification. See the instructions for the TDS5000B Series Product Software CD-ROM for information about installing the support software. Occasionally new versions of software for your instrument may become available at our Web site, see Support Information. -
Page 28: User Interface Map
User Interface Map See the figure below for a description of the elements of the user interface. These elements provide complete control of the instrument. -
Page 29: Installing Software
Microsoft Office 2000 (Word, Excel, PowerPoint, etc.) MathCad MATLAB Other software products may be compatible but have not been tested by Tektronix. If the instrument malfunctions after you install software, uninstall the software and then reinstall the instrument application to restore proper operation. -
Page 30: Using Online Help
Using Online Help The online help is designed to assist you with all the features of the instrument. Use the online help to quickly get information about a function or assistance in performing a task. These types of online help are available: Context-Sensitive help. -
Page 31: Documentation
Complete specifications are also available from the Help menu. Optional Applications. The Optional Applications Software for Tektronix Windows-Based TDS Instruments CD-ROM (020-2450-xx) contains free five-time trials of optional application software that you can install on your instrument. These applications provide application specific measurement solutions, such as power, jitter, optical storage, disk drive, and others. -
Page 32: Support Information
Support Information For information on getting support for your Tektronix product: Product Support For application-oriented questions about a Tektronix measurement product, call toll free in North America: 1-800-833-9200 6:00 a.m. - 5:00 p.m. Pacific time For product support outside of North America, contact your local Tektronix distributor or sales office. -
Page 33: Feedback
Feedback Tektronix values your feedback on our products. To help us serve you better, please send us any suggestions, ideas, or other comments you may have regarding your instrument. Direct your feedback to us via email to support@tektronix.com, or FAX at (503) 627-5695, and include the following information. -
Page 34: Standard Accessories
Standard Accessories The following accessories are shipped with your instrument: TDS5000B Series Digital Phosphor Oscilloscopes Quick Start User Manual English (Option L0, 071-1355-xx) French (Option L1, 071-1357-xx) German (Option L3, 071-1358-xx) Japanese (Option L5, 071-1356-xx) Korean (Option L9, 071-1359-xx) Russian (Option L10, 020-2609-xx) -
Page 35: Recommended Accessories
Recommended Accessories The following optional accessories are recommended for your instrument: TDS5000B Series Digital Phosphor Oscilloscopes Service Manual (071-1362-xx) Keyboard (118-9402-00) Stylus (119-6107-00) Set of 2 blank CD-RW (020-2434-00) Transit Case (016-1937-00) Video Display Clamp (013-0278-xx) Thermal Printer Paper (016-1897-00) - Page 36 AFTDS Differential Signal Adapter...
- Page 37 Using Print Screen. Rackmount For installation information, refer to the instructions that came with your rackmount kit. Other Refer to the Readme file on the TDS5000B Series Product Software CD for possible additional accessory installation information not covered in this manual.
-
Page 38: Options
Options The following options are available for your instrument: Touch Screen (18) Front panel removable hard drive (FHD) Scope Cart (1K) Extended Memory 16/8/4M on 1/2/4 channels (3M) Thermal Printer—1P (655-4920-00) TDS5000 Series Rackmount Kit—1R (016-1946-xx) Serial Communications Mask Testing (SM) TDSCPM2—ANSI/ITU telecom pulse compliance software (CP2) TDSDVD—Optical storage analysis software (DVD) TDSET3—Ethernet compliance test software (ET3) -
Page 39: Windows Interface Guidelines
Some third-party applications may not work properly with the instrument. If your instrument stops working after you install third-party software, try reloading the instrument software from the TDS5000B Series Product Software CD-ROM. If you do not have an external monitor attached to the instrument, avoid changing the taskbar properties to "Always on top"... -
Page 40: Analysis And Connectivity Support
This instrument offers several tools that you can install to support data export for use with data-analysis tools. These tools ship with the Tektronix instrument that this online help supports. You can find them on the product software CD that ships with this instrument. Find the Readme file on the CD for analysis and connectivity tool installation instructions. -
Page 41: Vxi Plug-And-Play Instrument Driver
VISA model established by the VXIplug&play Systems Alliance. Use TekVISA in software to write interoperable instrument drivers to handle communicating between software applications and your TDS5000B series instrument. TekVISA offers the following features and benefits: Provides end users with a consistent methodology for using instrument drivers from a variety... -
Page 42: Supported Ades
LabVIEW graphics software using the G language MATLAB analysis software Tektronix Toolbar for Word The Tektronix Toolbar for Word, an add-in to Microsoft Word, lets you capture and graph oscilloscope data in Microsoft Word 2000 and 2002 documents. Report Generator Report Generator, an MS Windows application, lets you create custom reposts displaying your oscilloscope data. -
Page 43: Working With The Tds5000B Series Instrument
Working with the TDS5000B Series Instrument The following topics describe features of your TDS5000B Series oscilloscope. Even if you are an experienced user, you may want to browse through these topics to learn new ways of doing familiar tasks. -
Page 44: Using The Instrument Interface
Windows Environment Connecting to a Network see page 50 Printing a Hard Copy see page 51 Using Other PC Applications see page 51 Using a Second Monitor see page 52 Connecting to Other Instruments see page 52 Access Shortcut Menus with Right-click see page 46 Using the Instrument Interface —convenient ways you can operate the instrument Use familiar knobs and buttons on the front panel to perform most vertical, horizontal, and... -
Page 45: Moving And Docking Control Windows
Moving and Docking Control Windows —access control settings while viewing the full screen Control windows that open on the lower half of the screen can be set to "float" to any location. To do this, double-click the handle on the leftmost edge of the window, or click the handle and drag with the mouse to another position on the screen. -
Page 46: Access Shortcut Menus By Right-Clicking
Access Shortcut Menus by Right-Clicking —fast access to most common commands is available by right-clicking Right-click on the graticule, on an object, or a readout for quick access to shortcut menus. These shortcut menus are dynamic and will change with the area or object where you right clicked. Right-click on any of the following for a dynamic shortcut menu: Waveform handle Cursors... -
Page 47: Creating Your Own Control Windows
Creating Your Own Control Windows —new ways to make your job easier For quick access to the controls that you use most often, you can create your own MyScope control window. Choose from a list of controls to include and make each control window unique to your needs. -
Page 48: Using Fast Acquisition And Dpo
significant interval of time. This technique lets you increase the horizontal resolution (sample faster) on a segment of a signal, even when you cannot trigger on that particular segment. The multizoom function also allows you to zoom on multiple areas of a waveform or on multiple waveforms simultaneously. -
Page 49: Using Spectral Analysis
Using Spectral Analysis —operate the instrument like a spectrum analyzer. When you are displaying an FFT (spectral) math waveform, you can use either of these two ways to operate the instrument: Use the conventional time-domain instrument controls, such as vertical and horizontal position and scale. -
Page 50: Application-Specific Measurements
Power Measurements—Us the TDSPWR3 software to quickly measure and analyze power dissipation in power supply switching devices and magnetic components. Additional packages may be available. Contact your Tektronix representative for more information. Connecting to a Network —as easy as networking a PC The instrument is built on a PC-based platform that runs Microsoft Windows as its operating system. -
Page 51: Printing Hard Copy
Printing Hard Copy —flexible printing options To make hard copies, use the optional built-in thermal printer, a printer attached to one of the rear- panel ports, or connect to a network printer if your instrument is on a network. You can print the full screen, just the graticule area, or a long continuous waveform as a banner. -
Page 52: Using A Second Monitor
Using a Second Monitor —the convenience of a built-in PC To optimize your access to the PC that is built into the oscilloscope, connect a keyboard, mouse, and monitor to the side panel of the instrument, and then configure Windows for dual-display mode. -
Page 53: Tds5000B Series Options
TDS5000B Series Options You can order the following options with the oscilloscope: Hardware options Front-panel removable hard drive Touch-screen interface Built-in thermal printer Serial Communication Mask Testing Acquisition memory options 16M/8M/4M on 1/2/4 channels Mounting options K420 oscilloscope cart with mouse accessory tray... - Page 54 Russian Quick Start User manual You can order the following upgrade kits to extend the performance of your instrument after its initial purchase. Contact your local Tektronix representative for details and the most current information. To upgrade your instrument, order the TDS5UP Upgrade Kit and the appropriate option(s) from this list.
- Page 55 TDS5UP Description Upgrade Option IF Service installation of selected options Option 1K K420 oscilloscope cart with mouse accessory tray Option 1R Rackmount kit Option CP2 TDSCPM2: ANSI/ITU telecom pulse compliance software Option ET3 TDSET3 – Ethernet compliance test software...
-
Page 56: Controls And Connections
Controls and Connections Multipurpose Knobs The multipurpose knobs can be used to set screen interface parameters. To use, click a control on the screen to map it to the multipurpose knob(s). Note that they are automatically mapped when certain functions are performed, for example, when the MultiView Zoom button is pushed. -
Page 57: Horizontal Controls
Horizontal Controls Use the HORIZONTAL controls to adjust the horizontal parameters of waveforms. The horizontal controls globally affect all displayed waveforms. Use the dedicated POSITION knob to adjust the horizontal position of all waveforms. Use this knob to adjust the trigger point so that you can select the amount of pretrigger data or posttrigger data. -
Page 58: Trigger Controls
Trigger Controls Use the TRIGGER controls to set basic trigger parameters. By default, the instrument uses the Edge trigger. To return to the Edge trigger from any other A (main) event trigger, push the EDGE button. Pushing this button does not open the Edge Trigger control window unless another A event trigger is already displayed. -
Page 59: General Purpose Controls
trigger event and then stops. In Envelope, Average, or WfmDB mode, the instrument makes the specified number of acquisitions to complete the averaging or enveloping task, and then stops. The Acquisition Status lights indicate the state of the acquisition: When TRIG’D is on, the instrument has recognized a valid trigger and is filling the posttrigger portion of the waveform. -
Page 60: Front Panel Connectors
Front Panel Connectors The instrument features these front panel connectors: The trigger level range for the auxiliary input (AUX IN) is adjustable from +8 V to –8 V. The maximum input voltage is ±20 V. Use the probe compensation terminals (PROBE COMP) to compensate, calibrate, and deskew passive or active voltage probes. -
Page 61: Side Panel Connectors
Side Panel Connectors The instrument features these side panel connectors: Use the PS-2 connectors to connect a PS-2 keyboard or a mouse to the instrument. Use the USB connectors to connect a USB mouse, a keyboard, or other USB devices to the instrument. Note Plug USB devices directly into the USB connectors on the instrument to improve... - Page 62 Use the parallel port (Centronics) to connect a printer or other device. Use the RJ-45 connector to connect the instrument to a network. Use the audio ports for stereo microphone input and stereo line output. Use the GPIB connector to connect the instrument to a GPIB controller for GPIB operation.
-
Page 63: Optional Touch Screen
Optional Touch Screen If the optional touch screen is installed, you can use touch to control the instrument in addition to the front-panel controls, toolbar buttons, and menu options. Generally, touch can be used anywhere that click is mentioned in this online help. To disable the touch screen, push the front-panel TOUCH SCREEN OFF button. -
Page 64: File Menu
File Menu Use the File menu for basic file operations such as saving, recalling, and deleting waveforms or setups. You can also use the File menu for standard Windows operations such as printing files and loading the most recent setup. Reference Waveform Controls Access this control window from the File menu, Reference Waveform Controls…... -
Page 65: Recall Dialog Box: Waveform
This dialog box opens when you select Save As from the File menu or click Save from the Reference Waveform controls. The default file type is a Tektronix waveform file (.wfm). If you select a different file type from the Save as Type list, you can also define the options for saving the waveform. -
Page 66: Save As Dialog Box: Instrument Setup
If you don’t see the file that you want to recall, check that the Files of type list shows the correct file format. You may also need to check other folders if the file was stored in a location other than the C:\TekScope\Waveforms folder. -
Page 67: Recall Dialog Box: Instrument Setups
Behavior You can display up to ten saved instrument setups in this dialog box. Additional setups can be saved to the hard drive. When you save a setup, the label adjacent to the setup icon changes from its previous value to User. You can save setups to any location labeled Factory without overwriting a saved setup. -
Page 68: Delete Setups And Reference Waveforms
Select the File menu Recall Default Setup command to instantly restore the default setup. To recall an instrument setup from a file, select the location of the setup from the Look in list. Select the setup you want to recall, and then click Recall. Behavior The setups are restored from an internal file on your hard drive as soon as you click Recall. -
Page 69: Page Setup Dialog Box
To Use Select the setup or reference waveform that you want to delete from the Delete command on the File menu. To delete all Setups at the same time, select All Setups, to delete All Reference Waveforms at one time select All Refs. Behavior You can only delete setups and reference waveforms stored in oscilloscope memory from this command. -
Page 70: Using Print Screen
To Use The controls in this window are similar to the Print dialog box in most Windows applications. The settings are dependent on the type of printer connected to the instrument. Behavior If you have the integrated printer installed, the default Name is Integrated Thermal Printer. The integrated printer is available as an option for your instrument. -
Page 71: Waveform Options Dialog Box
Select a file type from the Save as type drop-down list. Assign your own file name, and then save the file to a specified folder. By default, the image will be saved to C:\TekScope\ScreenCaptures. Click Save to save the screen capture or cancel to close the dialog box without saving. -
Page 72: Save As Dialog Box: Measurement
Select the Include waveform scale factors check box if you want to include waveform details like header information (record length, sample interval, trigger point information, and so on). If you only want to include the waveform voltage values, clear the selection. If you are saving Fast Acquisition data, select the data ordering from the list. -
Page 73: Save As Dialog Box: Timestamp
Behavior Histogram data is saved in C:\TekScope\data unless you select a different location. To access the Histogram Save As dialog box, you may need to select it from the More submenu. Save As Dialog Box: Timestamp Access this dialog box from the File menu Save As command. To Use To save a Timestamp Table with the default file name, click Save. -
Page 74: Edit Menu
Edit Menu Use the Edit menu for copying images, waveforms, or measurements to the clipboard for use in other applications. You can select items from the menu or you can select Copy Setup to fine tune the parameters with the Copy Setup control window before copying items to the clipboard. You can also use the Edit menu to clear data and undo the last Autoset. -
Page 75: Copy Setup: Measurements
Select the number of samples that you want to copy. Select all samples, a range of samples, or only the samples between the cursors. If you select Data between cursors, you can use the multipurpose knobs to adjust the positions if the cursors are already active. If they are not, the cursors will be turned on at the positions they were in the last time they were used. -
Page 76: Autoset Undo Control Window
Autoset Undo Control Window This control window opens automatically after an Autoset operation. Overview Use this control window to undo the last Autoset operation. To Use Click Undo. Only the parameters that were set by the last Autoset are undone. Parameters that you changed that are not controlled by Autoset retain their settings. -
Page 77: Vertical Menu
Vertical Menu Use the Vertical menu options to set vertical parameters for waveforms. This menu also provides access to the Zoom controls and the probe calibration, deskew, and attenuation functions. Vertical Setup Control Window Access this control window from the Vertical menu Vertical Setup command, or the Vert toolbar button. Overview Use the Vertical Setup control window to set the vertical parameters for live (channel) waveforms. - Page 78 Use the Channel drop-down list under Vertical to select which waveform (Ch1-4, Math1-4, or Ref1-4 on 4-channel instruments or Ch 1-2, Math 1-2, or Ref 1-2 on 2-channel instruments) the Vertical Position and Factor controls adjust. The Position and Factor controls change the position and factor (or scale) in the Zoom area. They can be adjusted with the multipurpose knobs.
-
Page 79: Zoom Control Window
Zoom Control Window Access this control window from the Vertical or Horiz/Acq menu Zoom Controls command, or push the front-panel MultiZoom button. Overview Use the Zoom control window to set the position and factor of the selected waveform in the Zoom window, select the Zoom Area and Source, and to lock and scroll the zoomed areas. -
Page 80: Autoscroll Control Window
AutoScroll Control Window Access this control window from the Vertical or Horiz/Acq menu Zoom Controls command, and then click the Scroll tab. Overview Use the AutoScroll control window to set the scroll speed and lock zoomed areas together. To Use To scroll a single zoomed area, select the zoom area (1-4), and then click an Auto Scroll button. -
Page 81: Graticule Zoom Control Window
Graticule Zoom Control Window Access this control window from the Vertical or Horiz/Acq menu, Graticule Size submenu, Size command. To Use Click one of the Graticule Size buttons to set the proportion of the display area for the acquisition window and zoom window. Click Setup to access the Zoom Setup control window. -
Page 82: Waveform Label Control Window
Waveform Label Control Window Access this control window from the Vertical menu Label command. Label is also available on the Math menu. Overview Use the Waveform Label control window to attach a label to the waveform. To Use Use the Channel Selector tabs to select a valid channel, math, or reference waveform. -
Page 83: Position/Scale Control Window: Position
Position/Scale Control Window: Position To Use Use the Position control to set the vertical position of the selected waveform. Click the control to map it to one of the multipurpose knobs, and then use the knob to move the waveform. Behavior The Position control moves the vertical position of the waveform 0.2 divisions (0.02 divisions with FINE control). -
Page 84: Vertical Offset Control Window
Vertical Offset Control Window Access this control window from the Vertical menu Offset command. Overview Use the Vertical Offset control window to set the offset value of the selected waveform to shift the vertical acquisition window to match the waveform data you want to acquire. To Use Click a Channel button to select the vertical input channel. -
Page 85: Coupling Control Window
Note The 50 Ω termination becomes an open circuit if you set the channel input coupling to GND. Consider the following when using 50 Ω termination with any channel: The instrument does not accurately display frequencies under 200 kHz with AC coupling. The instrument reduces the maximum vertical scale setting for the channel to 1 V from 10 V (to 10 V from 100 V with a 10 X probe attached), since the amplitudes appropriate for the higher settings would overload the 50 Ω... -
Page 86: Bandwidth Control Window
Bandwidth Control Window Access this control window from the Vertical menu Bandwidth command. Overview Use the Bandwidth control window to filter unwanted high frequency noise from the waveform and to decrease the noise bandwidth. Specify the range of frequencies that you want to acquire by selecting the appropriate button in the control window. -
Page 87: Probe Calibration Control Window
If the Fail message still appears after performing the probe calibration procedure, you may have a faulty probe. You should have the probe checked by Tektronix service personnel. -
Page 88: Probe Calibration Control Window: Probe Calibration
Probe Calibration Control Window: Probe Calibration To Use Click a Channel button at the top of the control window to select the vertical input channel for the attached probe. Connect the probe tip to the appropriate signal and ground connections of the probe compensation terminals. -
Page 89: Deskew Control Window
Deskew Control Window Access this control window from the Vertical menu Deskew command. Overview Use the Deskew control window to compensate for propagation delays of different length probes connected to the vertical input channels. To Use Connect the probes to a signal source. Use the horizontal and vertical controls to center the fastest signal on the screen. -
Page 90: Attenuation Control Window
Attenuation Control Window Access this control window from the Vertical menu Attenuation command. Overview Use the Attenuation control window to describe the input/output ratio of any external attenuation or gain between the signal and input channels. To Use Click a channel button at the top of the control window to select the vertical input channel for the attached probe. -
Page 91: Vertical Position/Scale
Vertical Position/Scale To Use Use the Position control to set the vertical position of the waveform, and the Scale control to set the vertical scale. Click on the controls and use the multipurpose knobs to change the waveforms. Behavior Each waveform has its own vertical Position control. The control increases or decreases the vertical position of the waveform 0.2 divisions (0.02 divisions using the FINE knob). -
Page 92: Termination
Termination To Use Use the Termination controls to select the channel input resistance (50 Ω or 1 MΩ). In general, select 1 MΩ to use high impedance passive probes. Select 50 Ω to use most active probes and low impedance (Zo) probes. Note The 50 Ω... -
Page 93: Coupling Setup
Coupling Setup To Use Use the Coupling controls to couple the signal from the attached probe to the instrument. Behavior Select DC to display the waveform with the DC and the AC components. Select AC to display the waveform with the DC component removed. Select GND to display a zero-volt waveform. -
Page 94: Channel Invert Control Window
Channel Invert Control Window Access this control window from the Vertical menu Invert command. Overview Use the Channel Invert control window to invert a live channel waveform. To Use Click one of the channel buttons to select a valid channel. Click Invert to toggle inversion of the selected waveform. -
Page 95: High Impedance Probes
High Impedance Probes Most general-purpose probes have high input impedance. The high input resistance of passive probes (typically 10 MΩ) provides negligible DC loading and provides accurate DC amplitude measurements. Most passive probes require the instrument input impedance to be 1 MΩ. However, their 8 pF to 12 pF (over 60 pF for 1X) capacitive loading can distort timing and phase measurements. -
Page 96: Horizontal/Acquisition Menu
Horizontal/Acquisition Menu Use the Horizontal/Acquisition menu options to set the horizontal and acquisition parameters for waveforms. This menu also provides access to the Zoom controls, Autoset, FastFrame, and Fast Acquisitions. Horizontal/Acquisition Setup Control Window (Horizontal Tab) Access this control window from the Horiz/Acq menu Horizontal/Acquisition Setup command, or the Horiz toolbar button. -
Page 97: Horizontal Scale
Hi Res mode requires twice the acquisition memory of other acquisition modes. When you select Hi Res mode, the instrument sets the record length accordingly to keep it from running out of memory. Record lengths of less than 500 samples are not supported except in FastFrame, where Frame Length can be set as low as 50 samples. -
Page 98: Horizontal Delay And Horizontal Position
Horizontal Delay and Horizontal Position To Use Use the multipurpose knob or the front-panel HORIZONTAL POSITION knob to set the horizontal position when the horizontal Delay Mode is Off. When Delay is On, use the multipurpose knobs to set the Horiz Delay (Horizontal Delay) and the Ref Point (Reference Point). -
Page 99: Horizontal Position/Scale Control Window: Delay Mode Off
Horizontal Position/Scale Control Window: Delay Mode Off When horizontal delay is off, the horizontal position control moves the trigger point within the acquired waveform. The horizontal scale control expands or contracts the waveform around the trigger point. When horizontal delay is on, you can delay the acquisition relative to the trigger event. For more information on horizontal delay, see Horizontal Position/Scale Control Window: Horiz Delay. -
Page 100: Horizontal Position/Scale Control Window: Delay On
Horizontal Position/Scale Control Window: Delay Access this control window from the Horizontal menu. Overview Use the Horizontal Position/Scale control window to set the horizontal delay and the horizontal scale of the displayed waveforms when the horizontal delay is on. The dedicated controls on the front panel also perform the same functions. -
Page 101: Horizontal Position/Scale Control Window: Scale Delay On
Horizontal Position/Scale Control Window: Scale Delay On To Use Click the Scale control to map it to a multipurpose knob and use the knob to change the scale. You can also use the increment/decrement buttons beneath the control or the pop-up keypad. -
Page 102: Acquisition Mode Control Window
Because the instrument can only store a finite number of waveform data points, there is a trade-off between the waveform details and the record length. You can acquire either a detailed picture of a waveform for a shorter period of time or a less detailed picture for a longer period of time. Acquisition Mode Control Window Access this control window from the Horizontal/Acquisition menu Acquisition Mode command. - Page 103 Model Signal and input conditions Effective bits TDS5032B, 350 MHZ, 6.5 div, 5 6.5 bits TDS5034B GS/s sample rate, Sample acquisition mode TDS5104B 1 MHz, 9.2 div, 5 6.6 bits GS/s sample rate, Sample acquisition mode 1 MHz, 9.2 div, 10 9.0 bits MS/s sample rate, Hi Res acquisition mode...
-
Page 104: Horizontal/Acquisition Setup Control Window (Acquisition Tab)
Horizontal/Acquisition Setup Control Window (Acquisition Tab) Access this control window from the Acquisition tab of the Horizontal/Acquisition control window. Overview Use the Acquisition tab to set the acquisition setups of all live waveforms. The Acquisition controls are common to all channels. This means that you cannot acquire in Sample mode on channel 1 while channel 2 acquires in Envelope mode. - Page 105 Behavior A single waveform data point can be made up of several sequentially acquired data points. The waveform data points can also be created from a composite of sampled data taken from multiple acquisitions. The acquisition modes determine how the waveform data points are produced from the sampled data.
-
Page 106: Fast Acquisitions
Acquiring and displaying a noisy square wave signal illustrates the difference between the modes. Note how Envelope mode reduces the noise while Average mode captures its extremes: In Waveform Database mode, the instrument acquires and displays a waveform that is the accumulation of several acquisitions. -
Page 107: Roll Mode
Roll Mode To Use To enable Roll mode, click Auto on the Acquisition tab of the Horizontal/Acquisition control window. Roll mode then starts automatically when the resolution is equal to or greater than 2 ms, the acquisition mode is Sample or Peak Detect, and 1 or 2 channels are on. -
Page 108: Interactions Of Roll Mode And Other Instrument Settings
4 ms 200 ms/div 4 ms 2500 1 s/div 4 ms 5000 2 s/div 4 ms 50000 20 s/div 4 ms 100000 40 s/div 3 or 4 Channels 4 ms 200 ms/div 4 ms 2500 1 s/div 4 ms 5000 2 s/div 4 ms 50000... -
Page 109: Incompatible Acquisition Features
Incompatible Acquisition Features The following table shows which acquisition features and modes are incompatible with other features or modes: Incompatible with Control/Feature Explanation Reference Waveforms Voltage Offset Offset is an acquisition (Ref1-Ref4) control, not a display control Single shot acquisition Average Acquisitions continue until the specified number of... - Page 110 Note In real-time sampling, the instrument digitizes all of the points it acquires after one trigger event. Always use real-time or interpolated sampling to capture single-shot or transient events. Behavior Equivalent Time mode lets you accurately acquire repetitive waveforms at sample rates much higher than the base analog-to-digital converter sample rate.
-
Page 111: Fastframe Setup Control Window
Time base ≥ 800 ps/pt 400 ps/pt 200 ps/pt ≤ 100 ps/pt The type of equivalent-time sampling the instrument uses is called random equivalent-time sampling. Although it takes the samples sequentially in time, it takes them randomly with respect to the trigger. Random sampling occurs because the instrument sample clock runs asynchronously with respect to the input signal and the signal trigger. -
Page 112: Frame Setup
Measure time between triggered acquisitions using time stamps in Sample, Peak Detect, and Hi Res mode. Save and recall FastFrame waveforms. Display waveforms in YT mode. Apply math functions to FastFrame waveforms. Confine automatic measurements only to the displayed frame. Overlay multiple frames for easy comparison. -
Page 113: Frame Viewing
Frame Viewing To Use Select the source channel from the drop-down list, and then use the multipurpose knob to select the Selected Frame. Click either the Live or All button to determine which frames you want to lock together. Click the Multiple Frames button to toggle this function between Off or Overlay. When Overlay is selected, two additional fields are displayed—Start Frame and # of Frames. -
Page 114: Time Stamps
is displayed superimposed in dark blue, unless you are using the Spectral or Temperature color palette. Time Stamps To Use Use these controls to use time stamps with FastFrame. Click the Readouts button to display the time stamp readouts in the graticule. Click the Table button to display the time stamps readouts in a table format. - Page 115 You can push RUN/STOP to terminate a FastFrame sequence. If any frames were acquired, they are displayed. If no frames were acquired, the previous FastFrame waveform is displayed. Because FastFrame introduces additional processing time into the operation cycle of acquire, process, and display, it is best to use Single Sequence Acquisition (see Acquire menu, Stop After menu).
-
Page 116: Fastframe Controls
FastFrame Controls Access the FastFrame Controls by clicking the Selection Controls button in the FastFrame Setup control window. Overview Use this control window to select the viewing frame (Selected Frame) when FastFrame is turned on. You can also select the reference frame. To Use Select the source channel from the drop-down list, and then use the multipurpose knob to select the Selected Frame. - Page 117 Select User Preferences from the Utilities menu to display the Prompt Before Action window. Click Autoset to toggle between OFF and ON: OFF to immediately perform an Autoset when the AUTOSET button is pushed. ON to display a prompt when the AUTOSET button is pushed. Click Close to save your selection.
- Page 118 Trigger Coupling Trigger Holdoff Minimum setting Vertical Scale As determined by the signal level Vertical Position As determined by the number of active channels Vertical Coupling DC unless AC was previously set. AC remains unchanged. Vertical Bandwidth Full Vertical Offset 0 volts Zoom...
-
Page 119: Trigger Menu
Trigger Menu Use the Trigger menu to set up the instrument to trigger on live waveforms. Several different types of triggering are available. Trigger Setup Control Window Access this control window from one of the Trigger Setup commands on the Trig menu or click the Trig taskbar button. -
Page 120: A Event Trigger Types
A Event Trigger Types To Use Click the Trigger Type button you want to use. Set the parameters for that trigger type in the right side of the control window. Behavior When you click one of the trigger icons, the right side of the screen displays the controls needed to use that trigger type. -
Page 121: Sequential Triggering (Horizontal Delay Off)
Behavior When you click one of the trigger icons on the display, the right side of the screen shows the trigger sequence. Set the individual controls using the multipurpose knobs. Sequential Triggering (Horizontal Delay Off) To Use Select the A-B Seq tab to use the A Event (main) trigger with the B Event trigger to capture complex data. -
Page 122: Trigger Mode And Holdoff
Trigger Mode and Holdoff To Use To set the Trigger Mode, click either Auto or Normal. To set the Trigger Holdoff time manually, click Time, and then use the multipurpose knob with the Trig Holdoff control to set the holdoff time. -
Page 123: Glitch Trigger Control Window
Behavior Edge triggering is the most common way to trigger an instrument. The trigger occurs when the trigger source passes through a specific level on the specified slope (rising or falling). Glitch Trigger Control Window To Use Use these controls to set the Glitch trigger parameters. Behavior Use the Glitch trigger to detect and trigger on a glitch or to ignore a glitch. -
Page 124: Runt Trigger Control Window
specify widths for either positive or negative pulses. The pulse widths are measured at the voltage level specified by the Level control. Runt Trigger Control Window To Use Use these controls to set the Runt trigger parameters. Behavior Use the Upper Level and Lower Level threshold controls to set the voltage ranges that define a valid pulse. -
Page 125: Transition Time Trigger Control Window
Behavior Use the Timeout trigger to trigger the instrument on pulses longer than the specified time. The instrument will trigger at the end of the timeout period. The instrument can trigger on high, low, or both high and low pulses. Use the Timer control to specify the timeout limit;... -
Page 126: Setup And Hold Trigger Control Window
Setup and Hold Trigger Control Window To Use Use these controls to set the Setup and Hold trigger parameters. Behavior Use the Setup and Hold trigger to trigger on setup and hold time violations. The setup and hold times define a violation region relative to a clock. Data is considered to be invalid in the violation region. -
Page 127: Logic State Trigger Control Window
Behavior Use the Pattern trigger to trigger the instrument when the logic inputs cause the selected function to become True or False. You can also time qualify the trigger—specify that the logic conditions must be satisfied for a specific amount of time before the instrument triggers. The instrument input channels represent the data inputs. -
Page 128: Window Trigger Control Window
Window Trigger Control Window To Use Use these controls to set the Window trigger parameters. Behavior Use the Window trigger to trigger the instrument when the input signal rises above an upper threshold level or falls below a lower threshold level. After setting these levels, you can specify whether you want to trigger the instrument as the signal is entering or leaving the threshold window. -
Page 129: Comm Trigger Control Window
Behavior Use the Video trigger to trigger the instrument on specified fields or lines of a composite video signal. Note Only composite signal formats are supported. Graphic display formats such as RGB and VGA are not supported. Select from several preset video signal formats or set a custom format. If using a preset format, the Lines and Fields Autoset buttons will optimize the instrument for viewing the fields or lines for your chosen format. -
Page 130: Communication Trigger Codes And Standards (Option)
Behavior Use the Comm Trigger control window to trigger the instrument in conjunction with mask testing on communications codes and standards. The controls work together to define the parameters for the trigger event. The standards that appear in the Standard drop-down list depend on the coding format that you selected. - Page 131 CMI trigger standards Custom DS4NA 139.26 Mb/s 139.26 Mb/s STM1E STS–3 155.52 Mb/s 155.52 Mb/s HDB3 trigger standards Custom 2.048 Mb/s 8.448 Mb/s DS1A 34.368 Mb/s 2.048 Mb/s MLT3 trigger standards Custom 100Base–TX 125 Mb/s NRZ trigger standards Custom 2.5 IBand FC133 FC266 2.5 Gb/s...
-
Page 132: Set To 50% With Comm Triggers
Set to 50% with Comm Triggers Overview The Set to 50% control sets the trigger threshold to 50% for some Comm triggers and to a high of 75% with a low of 25% for others. Behavior When either AMI or MLT-3 code is selected with Comm triggers the Set 50% control measures peak-to-peak level and sets an upper threshold value at 75% and a lower threshold value at 25%. -
Page 133: Trigger After Time (Horizontal Delay Off)
Behavior When you select A Only with Delay Mode on, the instrument first looks for the trigger conditions specified by the A Event. The instrument then delays the acquisition for the time specified by the Horiz Delay control before acquiring the data. Trigger After Time (Horizontal Delay Off) To Use Set up the A Event and B Event from their individual tabs. -
Page 134: Trigger On Nth Event (Horizontal Delay Off)
To Use Set up the A Event and B Event from their individual tabs. Then select the A–>B Seq tab and click Trig After Time. Select the trigger delay time with the Trig Delay control. Use the Horiz Delay control to delay the acquisition relative to the B event. Adjust the Ref Position and B Trig Level controls as necessary. -
Page 135: Trigger On Nth Event (Horizontal Delay On)
Behavior Use this sequence to trigger the instrument on the nth occurrence of the B event after the A event. When you select Trig on nth Event, the instrument looks for the trigger conditions specified by the A event. After the A event arms the trigger system, the instrument looks for a specific number of B events before triggering and displaying the data. -
Page 136: Trigger Holdoff Control Window
Trigger Holdoff Control Window Access this control window from the Trig menu Holdoff command. Overview Use the Trigger Holdoff control window to set the trigger holdoff. To Use Set Holdoff to Default to trigger after a preset amount of time. To set a specified holdoff time, click Time and enter a holdoff time in Trig Holdoff using the multipurpose knobs or pop-up keypad. -
Page 137: Trigger Mode Control Window
Trigger Mode Control Window Access this control window from the Trig menu Mode command. Overview Use the Trigger Mode control window to set the Trigger Mode, to force a trigger, or to set the trigger level to 50%. To Use Click one of the buttons at the top of the control window to set the Trigger Mode. -
Page 138: Communication Trigger Coding
Click Single Sequence to complete a single sequence of acquisitions each time you click the button. When Single Sequence is enabled, the front-panel single sequence (SINGLE) button is lighted. In Sample, Peak Detect, or Hi Res acquisition modes, the instrument acquires waveform records with the first valid trigger event and then stops. -
Page 139: Display Menu
To Use Touch the pulse form that you want the instrument to use for triggering. Touch 1 to trigger on a positive pulse form, 0 on a neutral pulse form, or -1 on a negative pulse form. Behavior The available pulse forms are determined by which code is used for the signal. For example, the only pulse form available for NRZ codes is eye diagram. -
Page 140: Display Persistence
Use the Display menu Display Style submenu to directly access the style options. Note The Vectors and Intensified Samples selections are not available in the XY and XYZ Display Formats. Display Persistence To Use Click one of the buttons to select the display persistence. -
Page 141: Display Format
Behavior When AutoBright is On, the intensity of the waveform changes automatically to provide a visible waveform. When AutoBright is Off, the display simulates the appearance of analog oscilloscope signals. Waveforms that trigger more frequently appear brighter than waveforms that trigger less frequently. -
Page 142: Waveform Interpolation
Waveform Interpolation To Use Click one of the buttons to select the interpolation that best displays the waveforms. Interpolation globally affects all displayed waveforms. Behavior The instrument interpolates waveforms in Zoom mode when there is less than one sample for each pixel column. Because interpolation affects the displayed waveform rather than the acquisition data, it has no effect on math, measurements, or optional histograms. -
Page 143: Display Setup Control Window (Objects Tab)
Here are some tips for working with screen text: Position the text on the screen by clicking and dragging the text to the desired location on the graticule. Display Setup Control Window (Objects Tab) Access this control window from the Display menu Objects command, or from the Display Setup control window. -
Page 144: Trigger Level Marker
Use IRE if you are working with NTSC video signals. Use mV if you are working with video signals other than NTSC. Use the Display menu Graticule Style submenu to directly access the graticule style options. Trigger Level Marker To Use Click one of the buttons to select the trigger level indicator. -
Page 145: Color Palettes
Color Palettes To Use Use the buttons under Record View Palette to define the color for live waveforms. Use the buttons under FastAcq/WfmDB Palette to define the color for live waveforms when using Fast Acquisition or Waveform Database acquisition mode. Click one of the buttons to select the color for displayed waveforms. -
Page 146: Display Palette
Gray (Monochrome Gray) displays waveforms in shades of gray. Areas of the waveform with the highest sample density appear in lighter gray shades while the areas of lowest sample density appear in darker gray shades. Green (Monochrome Green) displays waveforms in shades of green. Areas of the waveform with the highest sample density appear in lighter green shades while the areas of lowest sample density appear in darker green shades. -
Page 147: Math Color
Math Color To Use Click one of the buttons to select the color scheme for math waveforms. Behavior Click Default to use the default system color for the selected math waveform. Click Inherit to use the same color as the waveform that the math function is based on. When the instrument is set to XY display mode, multiple math waveforms will inherit the color of the primary (first) channel. -
Page 148: Display Persistence Control Window
Display Persistence Control Window Access this control window from the Display menu, Display Persistence submenu, Persistence Controls command. Overview Use the Display Persistence control window to quickly change the display persistence or set the persistence time. To Use Click one of the Display Persistence buttons or click Off to set the display persistence. - Page 149 XYZ format channel assignments When you use the XYZ display format, channel waveforms are assigned to the axis indicated in the following table. You cannot display math and reference waveforms in the XYZ format. Channels X Axis Y Axis Z Axis Ch 1, Ch 2, and Ch Ch 1 Ch 2...
-
Page 150: Cursor Menu
Cursors Menu Use the Cursors menu options to select cursor types, mode, and position, and also to turn cursors on and off. Cursor Setup Control Window Access this control window from the Setup button on the Cursor Type Setup control window, or by clicking the Cursor Setup command on the Cursors menu. -
Page 151: Cursor Type Setup Control Window
Behavior When cursors are turned on, the front panel CURSORS button is lighted. Indep (independent) cursor mode moves the cursors independent of each other. In Tracking mode, moving Cursor 1 moves Cursor 2 in tandem. However, moving Cursor 2 does not move Cursor 1. Symbol style applies only to Waveform and Screen cursors. -
Page 152: Cursor Sources
Cursor Sources To Use Click the Source drop-down list to select the source for the cursor. Click the Position text box, and then use the multipurpose knobs to adjust the position of each cursor. Behavior You can assign cursor sources to both Cursor 1 and Cursor 2 for any cursor type. If the cursor type is V Bars or H Bars, setting the Cursor 1 source sets the Cursor 2 source to the same value. -
Page 153: Horizontal Bar Cursors
Horizontal Bar Cursors To Use To use the horizontal bar cursors, click H Bars in one of the cursor control windows or click H- Bars from the Cursor Type submenu of the Cursors menu. Use the multipurpose knobs to move the cursors. -
Page 154: Screen Cursors
Behavior Waveform cursors can measure parameters on the same waveform or on different waveforms. The cursors measure vertical parameters (typically volts) and horizontal parameters (typically time or frequency) simultaneously. An X identifies the cursor location at the point where the cursors intersect the waveform. -
Page 155: Cursor Style
Cursor Style To Use Select a Line Style from the drop-down list. Line styles are available for all cursor types. Select a Symbol Style from the drop-down list. Symbol styles are only available on Waveform and Screen cursors. If you are in XY display format, you can also select the XY Cursor Readout from the drop-down list. -
Page 156: Cursors Using Xy Display Format
XY Cursor Cursor Type Display Cursor Position Readout Format Ratio Waveform Shown as rectangular coordinates and Screen and the Y vertical value is divided by the X vertical value. Cursors Using XY Display Format Access this control window from the Cursors menu Cursor Setup command. The Cursor Setup control window varies depending on the display format. - Page 157 Y1, X2 x 2, ∆t, t1, and t2). Screen cursors display three product readouts (∆X x ∆Y, X1 x Y1, and X2 x Y2) Ratio shows the cursor position as rectangular coordinates and the Y vertical value is divided by the X vertical value.
-
Page 158: Measurement Menu
Measurement Menu Use Measurement menu commands to select from and set up a variety of automatic measurements. Commands are also available on this menu for further in-depth analysis, including snapshots, gating (bounding), statistics, communication, and histograms. Measurement Setup Control Window Access this control window from the Measure menu Measurement Setup command, or the Meas toolbar button. -
Page 159: Measurement Tabs: Amplitude
Measurement Tabs: Amplitude To Use Use the Ampl tab to select automatic amplitude measurements. Select a source channel from the Channel Selector tabs, and click a measurement button to add the measurement to the Measurement list. Click Display in the upper-right corner of the control window to turn the measurement display on and off. -
Page 160: Measurement Tabs: More
Measurement Tabs: More To Use Use the More tab to select measurements not found under any of the other measurement tabs. Select a source channel from the Channel Selector tabs, and click a measurement button to add the measurement to the Measurement list. Click Display in the upper-right corner of the control window to turn the measurement display on and off. -
Page 161: Measurement Tabs: Communications
Measurement Tabs: Communications To Use Use the Comm tab to select communications measurements, and then click a measurement button to add the measurement to the Measurements list. Behavior Measurements are updated approximately three times a second (or less for long record lengths). -
Page 162: Measurements List
Measurements List To Use To add a measurement to the list, select the waveform source, and click one of the measurement buttons. To delete a measurement, select the measurement, and click Clear. Click Display in the upper-right corner of the control window to turn the measurement displays on and off. -
Page 163: Measurement Statistics Control Window
Snapshot executes all of the single waveform measurements once; the measurements are not continuously updated. Any measurements previously taken are retained on the display until you complete a new snapshot. To take another snapshot, click the Snapshot Again button. Things to consider when taking snapshots: •... -
Page 164: Reference Levels Control Window
Reference Levels Control Window Access this control window from the Measure menu Reference Levels command. Overview Use the Reference Levels control window to define unique reference levels for each measurement. The default reference levels serve most general-purpose measurements. However, you can customize all measurements to use different reference levels. -
Page 165: Gating Control Window
reference point is being defined). Because the statistical approach ignores short-term aberrations (overshoot or ringing), the histogram method is the best setting for examining pulses. Gating Control Window Access this control window from the Measure menu Gating command, or from the Measurement Setup control window. -
Page 166: Histogram Control Window
Histogram Control Window Access this control window from the Measure menu Waveform Histograms command. Overview Use the Histogram control window to set up a vertical or horizontal histogram. Use vertical histograms to measure signal noise and horizontal histograms to measure signal jitter. To Use Use the Channel Selector tabs to select the source waveform for the histogram measurements. -
Page 167: Delay Measurement Setup
Use the front-panel channel buttons to turn the source waveform display off so that the waveform does not obscure the histogram. Data accumulation continues whether the waveform display is on or off. The instrument can perform up to eight automated statistical measurements on the histogram. Allow the histogram to accumulate data for a while, and then turn on the desired measurements. - Page 168 measurement to the measurement list, or click Cancel to cancel the measurement and return to the Measurement Setup control window. Behavior This measurement is the amount of time one waveform leads or lags another waveform. Phase is expressed in degrees, where 360° comprise one waveform cycle. The measurement is taken at the voltage level specified by the Mid Reference control.
-
Page 169: Mask Menu
Mask Menu Use the Mask menu commands to setup a mask, edit or create user masks or setup a limit test. Mask Setup Control Window Access this control window from the Masks menu and select Mask Setup…. Overview Use these controls to set up a mask test. You can set the type of mask, polarity, display, and alignment. - Page 170 ANSI T1.102 masks None DS1A DS1C 1.544 Mb/s 2.048 Mb/s 3.152 Mb/s DS4NA DS4NA 6.312 Mb/s 44.736 Mb/s 139.26 Mb/s Max Output 139.26 Mb/s STS–1 Pulse STS–1 Eye 51.84 STS–3 STS–3 51.84 Mb/s Mb/s 155.52 Mb/s Max Output 155.52 Mb/s Ethernet mask None 100Base–TX STP...
- Page 171 Fibre Channel Electrical masks None FC133E Elec. FC266E Elec. FC531E Elec. 132.8 Mb/s 265.6 Mb/s 531.2 Mb/s FC1063E Elec. FC1063E FC1063E FC1063E 1.0625 Gb/s Norm, Beta, Norm, Delta, Norm, Gamma, Transm Transm Transm FC1063E FC1063E FC1063E FC1063E Abs, Beta, Transm Abs, Delta, Abs, Gamma, Abs, Beta, Recv...
- Page 172 1394b masks None S400b T1 S400b T2 S400b Optical 491.5 Mb/s 491.5 Mb/s 491.5 Mb/s S800b T1 S800b T2 S800b Optical S1600b T1 983.0 Mb/s 983.0 Mb/s 983.0 Mb/s 1.966 Gb/s S1600b T2 S1600b Optical 1.966 Gb/s 1.966 Gb/s Rapid IO LP–LVDS masks None 500 Mb/s 750 Mb/s...
-
Page 173: Mask Display Control Window
IOF masks 3.125 Gb/s 1.24416 Gb/s PCI–Express masks None PCI–Express PCI–Express Recv Transm 2.5 Gb/s 2.5 Gb/s Mask Display Control Window To Use Click the On/Off control to turn the mask display on or off. Click the Config control to activate the Mask Configuration Display control window. Behavior When the On/Off control is on, the mask is displayed on the graticule. -
Page 174: Mask Source Control Window
Clicking the Autoset Config control will replace this control window with the Autoset Mask Configuration control window. Clicking the Autofit Config control will replace this control window with the Autofit Mask Configuration control window. Mask Source Control Window To access this control window, select Source… from the Masks menu. Overview Use this control window to select the source of the signal that you want to test. -
Page 175: Mask Pass/Fail Setup Control Window
tolerance that is > 0 demonstrates that the signal passes the test with a margin for further error. Setting the tolerance to < 0 makes a mask test easier to pass. A tolerance that is < 0 can be used to demonstrate by how much of a margin the signal fails. -
Page 176: Mask Test Pass/Fail Controls
Mask Test Pass/Fail Controls Overview Use the # of Wfms (Samples), Fail Thresh, and Test Delay to set the parameters for the mask test. Note If you are using Waveform Database mode, the # of Wfms text box changes to a Samples text box. To Use Click the # of Wfms (Samples) text box to activate the pop-up calculator. -
Page 177: Pass Fail Setup More
When SRQ is turned on in the Failure field, it sends a GPIB SRQ command if a test fails. When SRQ is turned on in the Completion field, it sends a GPIB SRQ command when a test completes. Clicking the Print control sends the waveform to a printer when a test fails. Clicking the More control switches to the E-mail, Save Wfm, Log Date, and Path controls. -
Page 178: Mask Test Repeat
Behavior When the Positive control is selected, the mask test is performed on the positive pulse. When the Negative control is selected, the mask test is performed on the negative pulse. When the Both control is selected, the mask test is performed on both the positive and negative pulses. Mask Test Repeat Overview Use the controls in the Pass/Fail Test field to start the test or to... -
Page 179: Mask Test Summary
Mask Test Summary Overview Use this window to view real time test results. To Use The Pass/Fail Summary is a read only field. Behavior The Pass/Fail Summary fields provide a real time summary of the test results. Waveforms or Samples Tested shows how many waveforms or samples have been tested in relation to how many were specified in the test setup. -
Page 180: Mask Test Start Or Reset
The segments of a mask are the polygonal regions on the screen. Segment one is the left upper most polygon. Segments are assigned from top to bottom and left to right on the screen. Mask Test Start or Reset Access these controls from the Masks Pass/Fail Results Setup control window. Overview Use this control window to start a test or reset the test to the starting point. -
Page 181: Mask Configuration Display Control Window
Mask Configuration Display Control Window Access this control window from the Masks menu and select Config… or from the Masks Setup control window. Overview Use this control window to set whether changes in the scale will also be made in the mask. You can also use this control window to return to the Mask Setup control window. -
Page 182: Mask Autoset Vertical Controls
Mask Autoset Vertical Controls Overview Use these controls to choose whether to have autoset affect the vertical scale or position. You can also choose whether to have autoset affect DC compensation. To Use Click the Scale, Position, and DC Compensation controls to turn these vertical control functions on or off. -
Page 183: Mask Autoset Trigger Level Control
Mask Autoset Trigger Level Control Overview Use this control to choose whether to have autoset affect the trigger level. To Use Click the Trigger Level control to turn it off or on. Behavior When the Trigger Level control is turned on, the trigger levels are adjusted to match the signal when autoset is performed. -
Page 184: Mask Configuration Autofit Control Window
Mask Configuration Autofit Control Window Access this control window from the Masks menu and select Config… or from the Masks Setup control window. Overview Use this control window to configure the limits for minimizing mask hits, return to default setting, or return to the Mask Setup control window. -
Page 185: User Mask Setup
User Mask Setup Overview Use this control window to access the Mask Edit control window or to copy a standard mask as a user mask. You can also select the standard that you want to copy or edit from the standard drop- down list. - Page 186 To Use Click the Mask Segment and Vertex up and down arrows to select the segment or the vertex of the mask to be edited. Click Add to add a point to the boundary in the selected segment and just after the selected vertex.
-
Page 187: Recall User Mask
Recall User Mask Overview Use this dialog box to recall saved user masks. Masks are saved in C:\TekScope\Masks unless you choose another directory. To Use Click the name of the mask file that you want to recall to select it, and then click Recall. You can also click the keyboard icon to access the pop-up keyboard and enter the file name. -
Page 188: Save User Mask
Save User Mask Overview Use this dialog box to save user masks. Masks are saved in C:\TekScope\Masks unless you choose another folder. To Use To save the mask with the default file name, click Save. To enter a different file name, click the keyboard icon and use the pop-up keyboard to enter a unique file name. -
Page 189: User Mask Edit Control Window
User Mask Edit Control Window Access this control window by clicking Controls in the Mask Edit control window. Overview Use this control window to select the segment and vertex for editing and set the Vertical and Horizontal Mask Values. To Use Click the up and down arrows to select the segment or the vertex of the mask to be edited. -
Page 190: Create Limit Test Template
Create Limit Test Template Access this control window from the Mask menu and select Limit Test Setup…. Overview You can specify vertical and horizontal tolerances, create, and store the limit test templates. To Use Click the Source drop-down list to select the source you want to use to create the template. -
Page 191: Compare Limit Test
Compare Limit Test Access this control window from the Mask menu and select Limit Test Setup… Overview Use these controls to specify which waveforms to use for limit testing and which waveforms to compare them against. To Use Click the Source drop-down list to select a waveform for comparing against the template. -
Page 192: Limit Test Options
Limit Test Options Access this control window from the Mask menu and select Limit Test Setup…. Overview Use these controls to set up test failure notification, lock the template to a waveform, and highlight hits. To Use Click Config to open the Failure Notification control window where you can set up the action you want your instrument to take if the limit test fails. -
Page 193: Limit Test Failure Notification Control Window
Limit Test Failure Notification Control Window Access this control window from the Mask menu, select Limit Test Setup…, and then click Config. Overview Use the Failure Notification control window to set the mode of notification, send commands, save waveforms, print, send email and log data when a limit test fails. To Use Click the On/Off buttons to turn that mode of notification on or off. -
Page 194: Limit Test Reset
Limit Test Reset Access these controls from the Mask menu and select Limit Test Setup…. To Use Click On/Off to turn the limit test on or off. Click Reset to clear the status and highlighted hits. Behavior When you turn the limit test on, the status will indicate either Passing or Failing. -
Page 195: Save Limit Test Dialog Box
Save Limit Test Dialog Box Overview Use this dialog box to save limit test templates. Template waveforms are saved in C:\TekScope\/Waveforms unless you choose another folder. To Use Use this dialog box to save the limit test template to a reference location or a file. To save the template to a reference location Select the Source from the drop-down list, and then select one of the four reference locations. -
Page 196: Math Menu
Math Menu Math menu options enable you to perform mathematical operations on waveforms, build algebraic expressions, perform math-on-math operations, analyze histograms, or use advanced spectral analysis. Math Setup Control Window Access this control window from the Math menu Math Setup command, or from the Math toolbar button. -
Page 197: Define Edit Expression
Define Edit Expression These buttons provide quick access to the Equation Editor and to the Math Parameter control window. Click Editor to open the Equation Editor control window. Use the Equation Editor to create a math equation for the selected waveform. Click Avgs to open the Adjust Math Parameters control window. -
Page 198: Spectral Analysis
When working with reference waveforms and FastFrame, if one or more reference waveforms are used as part of a math waveform, the number of frames in the math waveform is the smallest of all source waveforms (reference, math, or channel waveforms). If one or more reference waveforms are used in a math waveform, the record length is equal to the smallest of all the source waveforms (reference, math, or channel waveforms). -
Page 199: Time Domain Tab
Create a math expression from a text editor or from another application. Copy the text to the Windows clipboard. Right-click with the mouse to paste the text into the math expression. Click Apply to apply the math expression to the selected math waveform. Click Avgs to open the Math Parameter Adjustment control window where you can specify the number of times the math waveform is to be averaged. -
Page 200: Spectral Analysis (Freq) Tab
Some things to consider when working with math waveforms: Scale and position the source waveform so that it is contained on screen. Off-screen waveforms may be clipped, resulting in errors in the math waveform. Use the vertical position and vertical offset to position the source waveform. The vertical position will not affect the math waveform unless you position the source waveform off screen so that it is clipped. -
Page 201: Edit Controls
Edit Controls To Use Use the Edit controls to insert numerals, math operators, and variables into a math expression. Use the Text Edit controls to move the insertion point (cursor) within the expression. Click an individual button to enter its character or operator into the expression. Behavior The characters are entered into the math expression one at a time. -
Page 202: Math Variables Control Window
Math Variables Control Window Access this control window by selecting Set Math Variables… from the Math menu. Overview Use this control window to quickly set the math variables to use in your math expression. To Use Use the 1-4 or 5-8 tab to access the variables that you want. Click in the Var#= text box, and then use the multipurpose knobs to set the value for the variable. -
Page 203: Create Spectrum Tab
Create Spectrum Tab To Use Use these controls to insert spectral analysis-based functions into the math expression. Click one of the buttons to insert the function into the expression. Then select one of the input channel waveforms to create the Math waveform. Behavior These controls work similar to the controls under the Spectral Analysis... -
Page 204: Phase Scale Tab
Phase Scale Tab To Use Use these controls to specify the vertical scale for spectral phase waveforms. Click one of the Scale buttons to specify the vertical units in radians, degrees, or as group delay. Behavior Group delay unwraps and differentiates the phase. -
Page 205: Spectral Setups: Acquisition
Spectral Setups: Acquisition To Use Click the control that you want to change and use the multipurpose knobs to adjust the values. Behavior Rec Length (Record Length) is the total number of samples in the waveform acquisition. The maximum record length depends on the amount of memory. -
Page 206: Spectral Setups: Frequency
Gate Length displays the gate length in points. The default gate duration is the duration of the entire waveform record. Note The gating controls interact with the acquisition and frequency domain controls; changing one set of controls may change the other control settings. Spectral Setups: Frequency To Use Click the individual controls, and use the multipurpose knobs to select the... -
Page 207: Spectral Controls: Acquisition
Spectral Controls: Acquisition Access this control window from the Math menu Spectral Controls command or the Controls button on the Spectral Setup control window. Overview Use the time domain acquisition controls to view spectral waveforms. To Use Click the control that you want to change, and use the multipurpose knob to adjust the value. -
Page 208: Spectral Controls: Gating
Spectral Controls: Gating Access this control window from the Math menu Spectral Controls command or the Controls button on the Spectral Setup control window. Overview Use the gating controls to specify a segment of the time domain record to analyze in the frequency domain. -
Page 209: Spectral Controls: Frequency
Spectral Controls: Frequency Access this control window from the Math menu Spectral Controls command or the Controls button on the Spectral Setup control window. Overview Use the Frequency controls to operate the instrument like a spectral analyzer. To Use Click the individual controls and use the multipurpose knobs to select Center Freq, Freq Span, Res BW, and Ref Level (Reference Level). -
Page 210: Text Edit Controls
Then reduce the resolution bandwidth to spread out the lobe horizontally. You can then select different window functions and observe their shape. Window Attributes In the time domain, windows are typically bell shaped and go to zero at the ends of the record. For cases where you may be doing impulse response testing, the impulse should be centered at the zero phase reference point (for most windows, this is the 50% position of the gate and 20% for the Tek Exponential window). -
Page 211: Myscope Menu
MyScope Menu Use the MyScope Menu to create a new MyScope control window, open or edit an existing one, display the active MyScope window, or recall recently used ones. MyScope Setup Control Window Access this control window from the MyScope menu New Control Window… command. Overview MyScope allows you to create custom control windows that include only the controls that you use regularly. -
Page 212: Using Myscope Control Windows
Click Save or Save As… to save your MyScope control window. Click Close to close the control window without saving it. Behavior Clicking on a control in the list allows you to preview the control in the pane at the right. Selecting or clearing the checkboxes for the controls in the list adds or removes components. - Page 213 However if you select V Bars, then Cursor MPKs controls are not available and the Cursor Style controls change as shown below. Measure controls Measurement controls always include a Next Ch and Clear All button. The Clear All button clears all measurements on all channels.
-
Page 214: Open Or Edit Myscope Dialog Box
Open or Edit MyScope Dialog Box To Use Select the MyScope control window that you want from the dialog box, and then click Open. Or you can type a file name to select the MyScope control window. Click the Look in drop-down list to navigate to other directories. -
Page 215: Utilities Menu
Utilities Menu The Utilities menu provides access to utilities used by the instrument such as instrument calibration, instrument diagnostics, and user preferences. All utilities are accessible from the menu bar only. None of the utilities are directly accessible from the front panel controls or from the toolbar. -
Page 216: Gpib Configuration Control Window
GPIB Configuration Control Window Access this control window from the Utilities menu GPIB Configuration command. Overview Use the GPIB Configuration control window to configure the instrument for GPIB (General Purpose Interface Bus) applications. GPIB applications enable you to remotely control your instrument (take measurements, set controls, perform calculations, and so on). -
Page 217: External Signals Control Window
External Signals Control Window Access this control window from the Utilities menu External Signals command. Overview Use the External Signals control window to select the trigger signal to send to the AUX OUT BNC connector or to toggle the instrument clock reference source. To Use To send a signal to the AUX OUT BNC connector when the instrument triggers, click either A Trig or B Trig. -
Page 218: Instrument Calibration Control Window
The only user-accessible calibration is the signal path compensation (SPC). All other calibration is accessible to qualified service personnel only. For all calibrations, the Status control should indicate Pass. If it does not, contact your local Tektronix service personnel. Instrument Diagnostics Control Window Access this control window from the Utilities menu Instrument Diagnostics command. -
Page 219: E-Mail On Event Control Window
Remove the input signals before running any of the diagnostics. If diagnostic failures occur, record the failure information and contact your local Tektronix service personnel for more information. E-mail on Event Control Window... -
Page 220: E-Mail Configuration Dialog Box
To save your attachments on the instrument hard drive and still send an email, set the Max E-mail Size limit to 0. E-mail Configuration Dialog Box Access this dialog box from the E-mail on Event Setup control window and click the Config button. Overview Use this dialog box to enter the address of the mail server to use when sending e-mail on events. -
Page 221: User Preferences: Prompt Before Action
Behavior The number you enter in the Number Attempts to Send box is the number of times the system will try to send the e-mail if it isn’t successful on the first try. The default is 1. Entering an address in the From box puts that address in the From field of the e-mail. The default value is the instrument model number. -
Page 222: User Preferences: Record Length
By default: TTL fixes the trigger level at +1.4 V ECL fixes the trigger level at –1.3 V When you set the volts/div less than 200 mV, the instrument reduces the TTL or ECL trigger levels below their standards. This is because the trigger level range is fixed at ± 12 divisions from the center. - Page 223 Transparent Opaque The maximum length of time that you can leave readouts highlighted is 5 seconds. The readouts that are highlighted are Vertical Scale, Horizontal Delay, Trigger Level, Trigger Source, Trigger Slope, and Source Termination. User Preferences: Touch Screen Access this control window from the Utilities menu User Preferences command. Overview Use the Touch Screen control window to activate right-click menus via the touch screen and to calibrate the touch screen.
-
Page 224: Option Installation
Tektronix representative. To Use Click Continue in the first dialog box. Enter the Option Installation Key provided by Tektronix in the Current Option Information dialog box. Click Continue again and follow the instructions to install the option. Further instructions and information may be available with the option or application documentation. -
Page 225: Theory Of Operation
Theory of Operation Functional Model The instrument has four high-level subsystems or processes (consisting of both hardware and software functions) and the data that connects them: Digital Signal Acquisition System. Acquires a waveform record from each signal you probe using the following subsystems: Input Channels. -
Page 226: Process Overview
Process Overview 1 The instrument starts in the idle state; it enters this state upon power up, upon receiving most control setting changes, or upon finishing acquisition tasks. 2 Control settings are implemented as they are requested. When you toggle the RUN/STOP control to RUN, the instrument starts the hardware. -
Page 227: Signal Connection
Signal Connection This diagram displays the signal connection model for each input channel. Input Conditioning Use input conditioning to ensure that the instrument acquires the best possible data for processing. To do this: Set the vertical scale to control the size of the vertical acquisition window for each channel to capture all or part of the input signal’s vertical amplitude. -
Page 228: Probes And Signal Connection
Tektronix provides a variety of probes and cables for this product. You can also check your Tektronix catalog for connection accessories to support your probing requirements. For more information about a particular probe, read the documentation that came with that probe. -
Page 229: Vertical Acquisition Window Considerations
Waveform data outside of the vertical acquisition window is clipped; that is, the data is limited to the minimum or maximum boundaries of the vertical acquisition window. This causes inaccuracies in amplitude-related measurements. For more information see Vertical Acquisition Window Considerations on page 229. Adjusted Horizontal Acquired waveform Scale... - Page 230 Note Amplitude-related automatic measurements (for example, peak-to-peak and RMS) will be accurate for vertical windows like those shown in Figures A and B below because neither waveform is clipped (that is, both waveforms are acquired). But if signal amplitude were to extend outside the vertical acquisition window, the data acquired is clipped.
-
Page 231: Horizontal Acquisition Window Considerations
Horizontal Acquisition Window Considerations The instrument lets you define the horizontal acquisition window, that is, set several parameters that determine the segment of an incoming signal that becomes the waveform record when acquired. (For background, go to Waveform Record on page 235.) These common parameters specify a horizontal acquisition window that is applied to all channels in parallel. -
Page 232: Autoset Considerations
Autoset Considerations Autoset acquires samples from the input signal and attempts to take the following actions based on the input data: Evaluate the amplitude range of the input signals and set the size and vertical offset of the vertical acquisition window to acquire the signal with good resolution, but without clipping. Set the trigger to the approximate midlevel of the signal being Autoset and switches to edge trigger mode. -
Page 233: Independent Versus Shared Window
For example, at 200 ps/div and 10 divisions, the record length must be 500 points: Max Rec Length 500 samples = (10 divs x 200 ps/div) ÷ 4 ps/sample Max Rec Length = 500 samples Note As implied from the operation just described, Resolution and the equivalent elements, Sample Interval and Sample Rate, are derived and cannot be set directly. -
Page 234: Acquisition Hardware
Acquisition Hardware Before a signal can be acquired, it must pass through the input channel where it is scaled and digitized. Each channel has a dedicated input amplifier and digitizer, as shown in the following figure; each channel can produce a stream of digital data from which the instrument extracts waveform records. -
Page 235: Sampling Modes
Sampling Modes The acquisition system can process the data as it is acquired, averaging or enveloping the waveform data to produce enhanced waveform records. Once the waveform record exists (enhanced or not), you can use the post processing capabilities of the instrument to further process that record: perform measurements, waveform math, and so on. -
Page 236: Interleaving
Interleaving The instrument can interleave channels to attain higher real-time digitizing rates and longer record length when only 1 or 2 channels are turned on without equivalent-time sampling. The instrument applies the resources of unused channels (that is, channels that are turned off) to sample those that are in use (turned on). -
Page 237: Trigger Sources
Triggers create meaningful waveforms from signal displays. This instrument has simple edge triggers as well as a variety of advanced triggers. The Trigger Event The trigger event establishes the time-zero point in the waveform record. All waveform record data are located in time with respect to that point. The instrument continuously acquires and retains enough sample points to fill the pretrigger portion of the waveform record (that part of the waveform that is displayed before, or to the left of, the triggering event on screen). -
Page 238: Trigger Modes
Logic triggers are special-purpose triggers that are primarily used with digital logic signals. Two of the types, Pattern and State, trigger the instrument based on the Boolean operator you select for the trigger sources. A third type, Setup and Hold, triggers when data in one trigger source changes state within the setup and hold times that you specify relative to a clock in another trigger source. -
Page 239: Trigger Coupling
At the longer holdoff time for the top waveform, unstable triggering occurs. With a shorter holdoff set for the bottom waveform, triggers all occur on the first pulse in the burst to remedy the unstable trigger. The Holdoff setting range is 1.5 µs (minimum holdoff available) to 12 seconds (maximum holdoff available). -
Page 240: Advanced Triggering
Advanced Triggering You can check the advanced trigger status in the readout. The readout indicates the trigger type and then shows sources, levels, or any other parameters that are important for the particular trigger type. For details on advanced triggers see pages 240–244. Glitch Trigger A glitch trigger occurs when the instrument detects a pulse narrower (or wider) than some specified time. -
Page 241: Pattern Trigger
Pattern Trigger A pattern trigger occurs when the inputs to the selected logic function cause the function to become True or False. When you use a pattern trigger, you define: The precondition for each logic input: logic high, low, or "don't care"; the logic inputs are the instrument channels The Boolean logic function: AND, NAND, OR, or NOR The condition for triggering: the Boolean function becomes True (logic high) or False (logic... -
Page 242: State Trigger
State Trigger A state trigger occurs when the inputs to the logic function cause the function to become True or False at the time the clock input changes state. When you use a state trigger, you define: The precondition for logic input channels 1 through 3 (channel 1 on TDS5000B 2-channel instruments) The direction of the state change for the clock input, channel 4 (channel 2 on the TDS5000B 2-channel instruments) -
Page 243: Setup And Hold Trigger
Setup and Hold Trigger A setup/hold trigger occurs when a data signal changes state inside of the user specified setup and hold times relative to the clock. When you use setup/hold triggering, you define: The channel containing the logic input (the data source) and the channel containing the clock (the clock source) The direction of the clock edge to use The clocking level and data level that the instrument uses to determine if a clock or data... -
Page 244: Window Trigger
the data source) for transitions occurring within the setup/hold violation zone. If any occur, the instrument triggers with the trigger point located at the clock edge. Positive settings for both setup and hold times (the most common application) locate the setup/hold violation zone so it spans the clocking edge as shown above in the top waveform. -
Page 245: Triggering With Horizontal Delay Off
The traditional delayed trigger mode called "Runs After" is served by the TDS5000B feature Horizontal Delay. You can use horizontal delay to delay acquisition from any trigger event, whether from the A (Main) trigger alone or from a sequential trigger that uses both the A (Main) and B (Delayed) triggers. -
Page 246: Triggering With Horizontal Delay On
Triggering with Horizontal Delay On You can use horizontal delay when you want to acquire a waveform record that is separated from the trigger event by a significant interval of time. The horizontal delay function can be used with any trigger setup. You can turn horizontal delay on and off from the front panel, the Horizontal/Acquisition control window, and many of the Trigger control windows. -
Page 247: Triggering And Horizontal Delay Summary
Triggering and Horizontal Delay Summary The following figure shows all combinations of triggering and horizontal delay. Display Overview This instrument includes a flexible, customizable display that lets you control how waveforms appear. The following figure shows how the display features fit into the overall instrument operation. -
Page 248: Display Elements
Display Elements The waveform shown below is displayed as part of the user interface (UI) application. Some terms that are useful in discussing the UI follow. (1) The Display is the area where the waveforms appear. The display comprises the time base and graticules, the waveforms, histograms, and some readouts. -
Page 249: Acquisition Preview
Acquisition Preview The acquisition preview attempts to show what the next acquisition will look like when the acquisition is delayed due to slow triggers or long acquisition duration, or when the acquisitions have stopped. Acquisition preview recalculates math waveforms, but does not represent changes in trigger levels, trigger modes, or different acquisition modes. -
Page 250: Customizable Display Elements
In general, the method of adjusting (vertically scaling, offsetting, positioning, and so on) the waveform display is from the front-panel vertical SCALE and POSITION knobs. Note that math and reference waveforms are scaled and positioned from their setup control windows. For channel waveforms, the vertical and horizontal controls that you set also adjust the instrument acquisition parameters. - Page 251 Display attribute Access Options of the acquisition display settings. Use for displaying points that may occur outside the Display Setup control normal acquisition envelope. window Appearance Variable persistence accumulates tab (Disp toolbar record points on the waveform button) for a specified time interval. Each record point decays independently according to the time interval.
- Page 252 Display attribute Access Options waveform with the highest sample density appear in blue shades and the areas of lowest Display Setup control sample density appear in red window Colors tab shades. (Disp toolbar button) On the Temp (Temperature Grading) palette, areas of the waveform with the highest sample density appear in warmer colors (red shades) and the areas...
- Page 253 Display attribute Access Options submenu Refer to Interpolation on page 255 for more information. Display Setup control window Appearance tab (Disp toolbar button) When AutoBright is Off, the Waveform Display menu display simulates the appearance Intensity Appearance of analog oscilloscope signals. command Waveforms that trigger more frequently appear brighter than...
- Page 254 Display attribute Access Options LCD Backlight Display menu The LCD Backlight control turns the Timeout Objects command LCD backlight off after the amount of time in Delay has expired without any screen activity. When LCD Backlight Timeout is Display menu LCD On and the time in Delay has Save Enabled expired, the screen blanks out.
-
Page 255: Operations On The Time Base
Operations on the Time Base In general, to adjust the time base, use the front-panel horizontal SCALE, RESOLUTION, and POSITION knobs. Only channel waveforms can be set directly. Here are some key points to remember about how horizontal operations relate to the waveform types: Reference waveforms are shown with the horizontal settings in effect at the time that they are saved. -
Page 256: Using The Multizoom Feature
Using the MultiZoom Feature Use the instrument MultiZoom feature to magnify an acquisition vertically, horizontally, or in both dimensions to let you see the fine detail in your signals without changing the acquisition parameters (sample rate, record length, and so on). For example, to temporarily expand the front corner of a pulse to inspect its aberrations, push the front-panel MultiZoom button to expand it horizontally and vertically. -
Page 257: Cursor Measurements
Reference Levels Method A second set of levels affect the fidelity of time-related measurements. For example, the measurement system calculates rise time from the waveform edge that transitions from the Low to the High reference levels. The instrument provides the following calculation methods (see the following figure): Relative Reference is calculated as a percentage of the High/Low range. - Page 258 You cannot move a cursor off the graticule unless you are in Zoom mode. Also, if you resize waveforms, the cursors do not track. That is, a cursor stays at its screen position, ignoring changes to horizontal and vertical scale and position and vertical offset (Waveform and Screen cursors will track a waveform vertically).
-
Page 259: Cursor Types
Cursor Units Depend on Sources A cursor that measures amplitude or time will read out in the units of its source as indicated in the table below. Note mixed sources require delta cursor readouts to use the units of the Cursor 1 source. -
Page 260: Histograms
Cursor function Measurements T2 = Time @ Cursor 2 with respect to the trigger point ∆T = Time @ Cursor 2 - Time @ Cursor 1 Time is divisions of displacement of the cursor from its source trigger point multiplied by the source in time/div. Waveform cursors measure vertical parameters (typically volts) and horizontal parameters (typically time or frequency) simultaneously. -
Page 261: Math Waveforms
Math Waveforms Once you have acquired waveforms or taken measurements on waveforms, the instrument can mathematically combine them to create a waveform that supports your data-analysis task. For example, you might have a waveform clouded by background noise. You can obtain a cleaner waveform by subtracting the background noise from your original waveform. - Page 262 This instrument supports mathematical combination and functional transformations of waveforms it acquires. The following figure shows this concept: You create math waveforms to support the analysis of your channel and reference waveforms. By combining and transforming source waveforms and other data into math waveforms, you can derive the data view that your application requires.
-
Page 263: Creating Math Waveforms
you do, the Math1 definition is rejected with an error because a circular definition is not allowed. Fast Acquisitions: Math is not allowed in Fast Acquisitions mode. Roll Mode: Math is not allowed in roll mode until you push STOP. Different Length Sources: If you use two waveforms (channel and reference waveforms) of different lengths, the length of the math waveform will be the shorter of the two lengths. -
Page 264: Math Waveform Sources
Offset, Position, and Scale The settings that you make for offset, scale, and position affect the math waveform you obtain. Here are some tips for obtaining a good display: Scale and position the source waveform so that it is contained on the screen. (Off-screen waveforms may be clipped, resulting in errors in the derivative waveform). -
Page 265: Math Waveform Differentiation
| <UnaryOperator> ( <Expression> ) <BinaryExpression> := <Term> <BinaryOperator> <Term> | <Scalar> <BinaryOperator> <Term> | <Term> <BinaryOperator> <Scalar> <Term> := <Waveform> | ( <Expression> ) <Scalar> := <Integer> | <Float> | <Meas-Result> <Waveform> := <ChannelWaveform> | <ReferenceWaveform> | <MathWaveform> <ChannelWaveform> := Ch1 | Ch2 | Ch3 | Ch4 <ReferenceWaveform>... -
Page 266: Offset, Position, Scale, And Math Waveforms
Cursor Measurements You can also use cursors to measure derivative waveforms. Use the steps in Taking Cursor Measurements on page 355. When using that procedure, note that the amplitude measurements on a derivative waveform will be in volts per second rather than in volt-seconds as is indicated for the integral waveform measured in the procedure. -
Page 267: Defining Spectral Math Waveforms
scale is the output scale factor T is the time between samples Since the resultant math waveform is an integral waveform, its vertical scale is in volt-seconds (its horizontal scale is in seconds). The source signal is integrated over its entire record length; therefore, the math waveform record length equals that of the source waveform. -
Page 268: Using The Spectral Math Controls
Spectral Averaging: You can turn on averaging in the frequency domain for phase and magnitude waveforms. Multiple Analyzer Control Locks: Up to four spectral analyzers can be used simultaneously. They can all be assigned to different gates on the same source waveform or to different channel sources. -
Page 269: Using The Gating Controls
Examples of how duration and resolution affect the acquired waveform are shown in the following figure. Using the Gating Controls Gating determines which portion of the acquired waveform is transformed into the frequency domain. The gate has a position and a width control. The gate position is the time in seconds from the trigger location to the center 50% position of the gate interval (see the figure below). -
Page 270: Using The Frequency Domain Controls
The width of the gate affects the resolution bandwidth of the spectral analyzer. Gate width has units of seconds. The resolution bandwidth directly controls the gate width, but the numerical value is entered in units of Hz. Therefore, the time domain gate markers move as you adjust the resolution bandwidth control. -
Page 271: Using The Magnitude Controls
Using the Magnitude Controls Vertical units can be either linear or log. You may select these choices by clicking the Math menu button. Then select the Spectral Analysis Setup command. On the Mag tab, select the desired scale type from Linear, dB, or dBm. Linear: When the spectrum is linear magnitude the vertical units are the same as the source waveform. - Page 272 Reference Level: This sets the vertical position of the displayed spectrum. Its value is the magnitude at the top of the display screen. When this control is adjusted, the spectral waveform along with its zero reference marker move vertically on the screen as shown. This control does not change the spectral data.
-
Page 273: Using The Phase Controls
Using the Phase Controls You can set the vertical units to Degrees, Radians, or Group Delay in seconds. To do this, click the Math toolbar button, click Spectral Analysis Setup, and select the Phase tab. Then select the desired scale type from Degrees, Radians, or Group Delay. Phase Reference Position: Phase is a relative measurement that must have a time domain reference point. -
Page 274: Using Spectral Analyzer Windows
Impulse Response Testing: When performing impulse response testing of a system, place the impulse at the zero-phase reference position of the acquisition. This produces a correct phase display. Because the Tek Exponential window has its zero phase reference position at the 20% point, more of the impulse response is captured. - Page 275 Your choice of window function will depend on the input source characteristics that you want to observe and the characteristics of the window function. The window characteristics are shown in the following table. Window 3 dB BW Scallop Nearest Zero Coefficients in bins loss...
-
Page 276: Gaussian Window
Nearest Side Lobe: This is the difference in magnitude between the spectral lobe peak in the spectrum and the next side lobe that occurs due to energy leakage. Different windows have different leakage characteristics. The more narrow the resolution bandwidth of the window the more leakage in the spectrum. -
Page 277: Rectangular Window
Rectangular Window This window is equal to unity (see the figure below). This means the data samples in the gate are not modified before input to the spectral analyzer. This window has the narrowest resolution bandwidth of any of the windows, but it also has the most spectral leakage and the highest side lobes. -
Page 278: Hamming Window
Hamming Window This window is unique in that the time domain shape does not taper all the way to zero at the ends. This makes it a good choice if you wanted to process the real and imaginary parts of the spectrum off line and inverse transform it back to the time domain. -
Page 279: Hanning, Kaiser-Bessel, And Blackman-Harris Windows
Hanning, Kaiser-Bessel, and Blackman-Harris Windows These windows have various resolution bandwidths and scallop losses (see the figures below). Choose the one that best allows you to view the signal characteristics you are interested in. The Blackman-Harris has a low amount of energy leakage compared to the other windows. The Hanning has the narrowest resolution bandwidth, but higher side lobes. - Page 280 Blackman-Harris window...
-
Page 281: Flattop2 Window
Flattop2 Window This window has the lowest scallop loss of any of the windows. It also has a wider resolution bandwidth but lower side lobe attenuation. Also, it is unique because the time domain shape has negative values. The Flattop2 window is useful for high accuracy magnitude measurements for signals that do not require very narrow bandwidth. -
Page 282: Tek Exponential Window
Tek Exponential Window The Tek Exponential window was invented at Tektronix. In the time domain, it is not a symmetrical bell shape as is the case with the other windows. Instead, it is exponential with a peak at the 20% position of the time domain gate. The frequency domain shape is triangular. Use this window for impulse-response testing where the 20% position is the zero phase reference point. -
Page 283: Recognizing Aliasing
Turn on averaging for a math waveform by editing the math expression. Sometimes, it is more desirable to average in the spectrum than in the time domain. For example, consider a signal that has time domain components that are asynchronous to the trigger. If you turn on averaging in the time domain, these components may go to zero or produce strange, nondeterministic effects on the resultant waveform. -
Page 284: Mask Key Points
If a standard listed in this manual is not available on your instrument, it is because the configuration or bandwidth of your instrument cannot test that standard. Although the TDS5000B Series instruments are not calibrated optical reference receivers, you can use them with mask testing to evaluate general optical signal characteristics and wave shape, using an external O/E converter. -
Page 285: Levels Used In Taking Eye Measurements
Only one mask standard is active at any one time. If you have one mask selected or enabled and then select a new mask, the new mask replaces the previous mask. You cannot test to multiple standards simultaneously. Autofit and Persistence Interaction The Autofit function moves the waveform vertically and horizontally in a mask to reduce the number of segment hits within a mask. - Page 286 The figure below shows an eye-diagram and the areas from which values are taken that are used to calculate measurements. P Values The P values include the mean and standard deviation of the vertical location of PTop and PBase. These areas are used with a specified sample size to statistically measure the following values: PTop , the mean value of PTop mean...
-
Page 287: Communication Triggering (Option)
Communication Triggering (Option) Communication (Comm) triggers are one type of trigger. Comm triggers are designed to work with communication masks and standards. When you select a mask to test, it is associated with a specific communication standard. The mask you select determines the comm trigger needed for that standard. -
Page 288: Saving And Recalling Setups
The following figure represents how the instrument creates the template waveform limit test envelope from user-entered vertical and horizontal division units. Division units are referenced to graticule divisions, where 1 major division contains 1000 millidivisions, or mdivs. The minimum mdiv unit is 20, which equals one screen pixel. When a source waveform is compared with an envelope waveform, each source waveform sample point value is compared to the vertical and horizontal min/max values of the corresponding envelope waveform sample point. -
Page 289: Saving And Recalling Waveforms
Recalling a setup replaces the current setup with the recalled setup. If you do not want to lose your current setup, save the setup file for later recall. Saved setups may contain settings inappropriate for waveforms currently in your instrument. For example, if you save a setup that displays a math waveform that is the average of reference waveform 1, when you recall the setup, if the reference is empty, the math and reference waveforms are not displayed. - Page 290 Bitmap creates files (.bmp) in a bitmap file format usable by many graphic programs. (Available for screen captures.) JPEG creates files (.jpg) in a compressed image format usable by many graphic programs. (Available for screen captures.) Spreadsheet creates files (.CSV) in a format usable by spreadsheets (Excel, Lotus 1-2-3, and Quattro Pro).
-
Page 291: Spectral Analysis Overview
Spectral Analysis Overview You can use math waveforms to perform FFT (Fast Fourier Transform) measurements with the instrument. The FFT process mathematically converts the standard time-domain signal (repetitive or single-shot acquisition) into its frequency components, providing spectral analysis capabilities. The ability to quickly look at a signal’s frequency components and spectrum shape is a powerful research and analysis tool. -
Page 292: The Fft Display
The FFT Display The following illustration shows a typical time-domain waveform and the frequency components of that signal as part of the math FFT waveform. FFT Windows The FFT process assumes that the part of the waveform record used for FFT analysis represents a repeating waveform that starts and ends at or near the same voltage of a cycle. -
Page 293: Fft Window Characteristics
transitions between the start and end points cause discontinuities in the waveform that introduce high- frequency transients. These transients add false frequency information to the frequency domain record. Applying a window function to the waveform record changes the waveform so that the start and stop values are close to each other, reducing the discontinuities. -
Page 294: Time Domain Gating
Time Domain Gating You can use time domain gating to select a specific segment of your signal for spectral analysis. Two controls, gate position and gate duration, determine the location and size of the gate. The resulting spectrum corresponds to the frequency components of the signal in the gated segment. Time domain gating is inversely proportional to the resolution bandwidth of the spectral waveform. -
Page 295: Eliminating Aliasing
Eliminating Aliasing Use the following methods to eliminate aliases: Increase the sample rate by adjusting the horizontal scale to a faster time-per-division setting. Since you increase the Nyquist frequency as you increase the time per division, the aliased frequency components should appear at their proper frequency. If the increased number of frequency components shown on the screen makes it difficult to measure individual components, use MultiView Zoom to magnify the FFT waveform. -
Page 296: Overview Tasks
Overview Tasks Setting Up Signal Input Use this procedure to set scale and position parameters for input signal acquisition. Set the acquisition system to run continuously. Prerequisites Connect the probe to the input signal source using proper Connect input signal probing/connecting techniques. -
Page 297: Setting Acquisition Modes
set the trigger level to 50%. Setting Acquisition Modes Use this procedure to set the data acquisition mode and specify acquisition start/stop methods. Power on the instrument and set up the horizontal and vertical Prerequisites controls and triggering. Select Acquisition Mode from the Horiz/Acq menu to open the Access the acquisition Acquisition Mode control window. - Page 298 Power on the instrument and set up the horizontal and vertical Prerequisites controls and triggering. Click the Horiz toolbar button to open the Enable roll mode Horizontal/Acquisition Setup control window. Select the Acquisition tab. Click Roll Mode Auto to enable roll mode. The resolution, record length, horizontal scale, and number of active channels on are dependent variables.
-
Page 299: Using Fast Acquisitions
Using Fast Acquisitions Use this procedure to set up Fast Acquisitions mode. Set up the horizontal and vertical controls and the triggering. Prerequisites Enable Fast Acquisitions Click the Horiz toolbar button to open the mode Horizontal/Acquisition Setup control window. Select the Acquisition tab. -
Page 300: Time Stamping Frames
Select the color palette Select the Display Setup control window Color tab. Click a Color Palette button in the Fast/Acq WfmDB Palette. In Fast Acquisitions mode, Temp and Spectral show more detail than the other color palettes. For a definition of each color palette, see page 145. - Page 301 Select the FastFrame and To set the Selected Frame and Reference Frame from the time stamps selection Selection Controls window: controls Click Selection Controls from the FastFrame control window to display the FastFrame controls. In the FastFrame controls window, click Selected Frame Source, and select the source of the frame that you want to view.
-
Page 302: Triggering From The Front Panel
Triggering from the Front Panel The front panel provides quick access to the most frequently used trigger controls. The trigger readout shows you the state of the trigger system. The SLOPE, COUPLING, and SOURCE controls only apply to edge triggering. To access the advanced trigger controls, open the Trigger Setup control window by pushing the ADVANCED button (See Advanced Triggering on page 240 for more information). -
Page 303: Checking Trigger Status
Set the trigger coupling Push the up and down arrow buttons to set COUPLING: • DC passes both AC and DC components of the input signal. • AC passes only the AC components of an input signal. • HF REJ attenuates signals above 30 kHz. •... -
Page 304: Triggering From The Trigger Setup Window
To quickly determine the settings of some key trigger Trigger status from acquisitions readout parameters, check the Trigger readout at the bottom of the display. The readouts differ for edge and the advanced triggers. Trigger level on display To see the trigger level on the waveform display, turn on a trigger level indicator (marker). - Page 305 7. Click a Trigger Type button to select a trigger, such as Edge, that uses a level adjustment. A trigger uses a level adjustment if the Level control appears on the right side of the screen with the trigger type setup controls. 8.
-
Page 306: Triggering On A Glitch
The instrument acts on Force Trigger even if selected before the end of pretrigger holdoff. However, the button has no effect if the acquisition system is stopped. Triggering on a Glitch Use this procedure to detect and trigger on a glitch or to ignore a glitch. Select glitch triggering 1. -
Page 307: Triggering On A Runt Pulse
Triggering on a Runt Pulse Use this procedure to detect and trigger on a runt pulse. The instrument can look for positive or negative runt pulses. These pulses can also be qualified by time or by the logical state of other channels. Select runt triggering 1. -
Page 308: Triggering On A Pulse Width
the specified threshold voltage; a value is considered low if the channel input voltage is less than the specified threshold voltage. Use the "don't care" selection for any channels that will not be used as part of the pattern. (Available only on 4- channel instruments.) Set the thresholds 7. -
Page 309: Triggering On Transition Time
pulses that are outside the range. 8. Click Level and use the multipurpose knob or pop-up Set the level keypad to set the trigger level. 9. Mode and holdoff can be set for all standard trigger types. Set mode and holdoff Refer to trigger mode on page 137 and Set holdoff on page 122 to learn more about trigger mode and holdoff. - Page 310 To use the trigger level marker to help in setting the threshold levels, open the Display Setup control window, and click Long on the Objects tab. 7. To finish specifying the slew rate (transition time), set the time component by clicking Time and using the multipurpose knob or keypad to set the delta time value.
-
Page 311: Triggering On Pulse Timeout
Triggering on Pulse Timeout Use this procedure to detect and trigger on pulses longer than a specified time. The instrument will trigger at the end of the timeout period. Select timeout triggering 1. Push the front-panel ADVANCED button. 2. On the Trigger Setup control window, select the A Event tab. -
Page 312: Triggering On A Pattern
Triggering on a Pattern Use this procedure to trigger the instrument when the logic inputs cause the selected function to become True or False. You can also specify that the logic conditions must be satisfied for a specific amount of time before the instrument triggers. Select pattern triggering 1. -
Page 313: Triggering On Logic State
When you select Less Than and specify a time, the input conditions must drive the logic function True for less than the specified time. Conversely, the True for More Than item requires the Boolean function to be True for longer than the time you specify. -
Page 314: Triggering On Setup/Hold Time Violations
6. To set the threshold voltages, click the channel threshold Set threshold voltages control, and use the multipurpose knobs or pop-up keypad to set each threshold. Define logic 7. Select the Boolean logic function for the combination of the input channels. The instrument will trigger on a clock edge when the input waveforms match the specified logic pattern. - Page 315 6. The Clock Edge determines whether the instrument finds the trigger point on the rising edge (left button) or the falling edge (right button) of the clock signal. Click a Clock Edge button. Set the data and clock 7. To set the data transition level, click Data Level, and use the levels multipurpose knobs or pop-up keypad to set the value.
- Page 316 11. Mode and holdoff can be set for all standard trigger types. Set mode and holdoff Refer to trigger mode on page 137 and Set holdoff on page 122 to learn more about trigger mode and holdoff. Set up and hold violation trigger...
-
Page 317: Triggering On Window Threshold Violations
Triggering on Window Threshold Violations Use this procedure to trigger the instrument when the input signal rises above an upper threshold level or falls below a lower threshold level. Select window triggering 1. Push the front-panel ADVANCED button. 2. On the Trigger Setup control window, select the A Event tab. -
Page 318: Triggering On A Video Signal
Triggering on a Video Signal Use this procedure to detect and trigger on a video signal. Only composite signal formats are supported. Graphic display formats such as RGB and VGA are not supported. Select video triggering 1. Push the front-panel ADVANCED button. 2. -
Page 319: Triggering On A Sequence
Select the polarity and 8. Select Normal or Inverted polarity: graticule type Normal generally triggers on negative polarity, since the sync pulse leading edge is negative for most standard formats. Use Inverted when probing circuitry that inverts the video signal. 9. -
Page 320: Triggering On A Communication Signal
To trigger on B events 1. To set the time base to trigger after an A trigger and a specified number of B trigger events, click Trig on the toolbar, and select the A->B Seq tab of the Trigger Setup control window. -
Page 321: Displaying Waveforms
Select the source and 5. To specify which channel becomes the trigger source, click type Source, and then select the source from the list. 6. Select either Clock or Data from the Type list. If you select Clock, you will also need to select the polarity. Select coding format and 7. -
Page 322: Using Multiview Zoom With Waveforms
point is the same as the horizontal position. 7. Release the Horizontal Reference, and then adjust the Horizontal Scale to expand or contract the waveform. Using MultiView Zoom with Waveforms Prerequisites 1. The instrument must be installed and operating, with a signal connected to an input channel, and horizontal and vertical controls and triggering set up. -
Page 323: Taking Automatic Measurements
11. Click the Lock and Scroll tab to select a Zoom Lock and scroll setting: To scroll a single zoomed area, click Zoom 1–4, and then click an AutoScroll button. To scroll multiple zoomed areas simultaneously, click Lock, and then click the Zoom 1–4 buttons that you want to scroll through. - Page 324 Take automatic 5. Select the tab on the Measurement Setup control window measurements that contains the measurement you want to take: Ampl, Time, More, Histog, or Comm. 6. Click the button for the measurement. The readout for the measurement and associated statistics is automatically displayed, and the measurement is added to the Measurements list in the control window.
- Page 325 click Setup Ref Levs to open the Reference Levels setup control window. 14. To set how the instrument determines the base and top of the waveform, click Determine Base, Top From: • Min-Max to use the highest and lowest values of the waveform record.
-
Page 326: Localizing A Measurement
Localizing a Measurement Use this procedure to take a measurement over a segment of the waveform. Prerequisites 1. The instrument must be installed and operating, with a signal connected to an input channel, and horizontal and vertical controls and triggering set up. 2. -
Page 327: Starting And Resetting Histogram Counting
If you are using H Bars or V Bars there is only one source for both Cursor 1 and 2. If you are using Waveform or Screen cursors, select a source for both Cursor 1 and 2. If a waveform is not available, it appears shaded in the drop-down list. - Page 328 Set, display, and reset 3. Select the Source Ch, Math, or Ref tab, and then select the histogram source and waveform source for the histogram. type 4. Click either Histogram Mode button to start histogram counting and display the histogram data: Horiz displays a horizontal histogram that shows how time varies in the histogram box.
-
Page 329: Creating A Math Waveform
Creating a Math Waveform Use this procedure to create a math waveform. Ensure that the sources you want to use exist. The sources do not have to be displayed. 1. All waveforms and automatic measurement scalars that Prerequisites you want to use must be available. 2. -
Page 330: Using Math Waveforms
Select a function, build an 6. Select the Time, Freq, or Meas tabs to display the available expression, and apply to functions. the waveform 7. Click a function button to enter the function in the math expression. Click an operand button (+, -, *, /) to insert an operand. - Page 331 If the waveform is not displayed, click Display. Set scale and position 4. Click Position and Scale, and use the multipurpose knobs or pop-up keypad to size and position the waveform on the screen. Keep in mind the following: The position is in divisions, so changing the scale can make the math waveform disappear until position is also changed (the same effect happens with channel waveforms).
-
Page 332: Using A Predefined Spectral Math Waveform
upper right corner of the graticule area. Note that amplitude measurements on a derivative waveform are in volts per second, and volt-seconds for an integral waveform measurement. Using a Predefined Spectral Math Waveform The following procedure is an example of setting up the instrument to perform spectral analysis of a signal. -
Page 333: Defining A Spectral Math Waveform
to 0.0 Hz and the Curs2 Pos to 125 kHz. The cursor readout now indicates the frequency span set in step 9. 13. Use the multipurpose knobs or keypad to set the Curs2 Pos to 62.5 kHz. The cursor readout now indicates the center frequency set in step Measure the test results 14. - Page 334 Averaging under Creating a Math Waveform on page 329 for details.) 6. Select the tab and channel number for the source waveform. If you want to redefine your waveform, click Clear button, and repeat the above steps. 7. To display your spectral waveform, click Apply or OK. Display the spectral waveform Set the magnitude scale...
- Page 335 Set the phase scale 12. Select the Phase tab. 13. To select the vertical scale factor click Scale: Degree to set the phase units to degrees. Phase is displayed using degrees as the scale, where degrees wrap from –180° to +180°. Radian to set the phase units to radians.
- Page 336 21. Resolution bandwidth determines how small of a frequency difference can be resolved in the frequency domain output data. It basically defines the bandwidth of the filters used to do the frequency domain analysis. To set the resolution bandwidth, Click Res BW, and use the multipurpose knobs or keypad to set the resolution bandwidth.
-
Page 337: Setting Up Mask Testing
30. Read the results in the cursor readout. The cursor readout is displayed under the multipurpose readouts as shown here or in the upper right corner of the graticule area. The figure shows the cursor measurement of a frequency magnitude on an FFT. The readout reads 0 dB because it is aligned with the 1 VRMS level. - Page 338 horizontal, vertical, and trigger settings to those appropriate for displaying a waveform of the specified type. If the signal is not within the mask, click the Autoset button to center the waveform in the mask. If Autoset did not align the signal in the mask, adjust the instrument vertical and horizontal controls.
- Page 339 horizontal and vertical divisions), return to default settings, or return to the Mask Setup control window. Use the keypad to change the vertical or horizontal autofit parameters. 11. Click the Masks button to return to the Mask control window. Set mask test tolerance 12.
-
Page 340: Creating A User Mask From A Defined Mask (Option)
pulses. Both tests the first half of the tested waveforms in positive polarity mode, then tests the remaining waveforms in negative polarity mode. 19. Toggle the Repeat button to On to set the instrument to repeat (continue) mask testing on the completion of each test. -
Page 341: Editing A User Defined Mask
Editing a User Defined Mask Access the mask edit 1. From the button bar, click Masks, and select the Masks tab. window 2. Click the User Mask button. 3. Click the Edit User Mask button. The instrument displays the Mask Edit control window. 4. -
Page 342: Saving A User Mask To Disk
Saving a User Mask to Disk Access the Mask Setup 1. From the button bar, click Masks and select the Masks tab. window 2. Click the User Mask button. 3. Click the Edit User Mask button. The instrument displays the Mask Edit control window. Save the user mask to 4. -
Page 343: Creating A New User Mask
Creating a New User Mask To create a new user mask that is not based on an existing mask, do the following procedure. 1. Use the communications trigger features to trigger the Set instrument settings instrument on a signal. The instrument saves these settings with the mask information. -
Page 344: Using Limit Testing
Using Limit Testing 1. Make sure the waveform that you want to use for a Prerequisites template exists. Your source can be either an active or a saved channel, math, or reference waveform. Create template 2. Select the source for your template. 3. -
Page 345: Sending E-Mail On Events
Sending E-mail on Events You must have Option SM installed to be able to send e-mail on Prerequisites Mask Test Failure. Setup E-mail on Event 1. From the Utilities menu, select E-mail on Event Setup. 2. Enter the recipients’ e-mail addresses in the box. 3. -
Page 346: Selecting The Sound Source
Selecting the Sound Source Your instrument is shipped with an internal speaker that some of the software features use to send an audible alert to the user. To enable this speaker, the sound card in your instrument must be turned off. With the sound card off, you will not have access to standard Windows audio features, such as the ability to listen to a music CD. - Page 347 5. Select the location (Ref 1–4) under Save in Oscilloscope Save the waveform to a reference Memory. Click Save to save your waveform to that reference location. Data in the existing reference will be overwritten. Save the waveform to a 6.
-
Page 348: Saving A Screen Capture
Frames to enter a range of frames to include in the saved waveform All Frames to include all frames in the saved waveform 15. If you are exporting Fast Acquisitions data, select the data ordering from the list. 16. Click OK, and then click Save to save the waveform file. To cancel without saving, click Cancel. -
Page 349: Saving Measurements
Saving Measurements Use this procedure to save measurements to a spreadsheet or text format.. 1. Measurements that you want to save must be selected. Prerequisites 2. From the File menu select Save or Save As. Under Save Open the Save dialog box What, click Measurement. - Page 350 Full Screen exports a bitmap of all screen contents Graticule exports a bitmap of only the graticule area Waveform exports waveform data Measurements exports measurement data 3. Select Copy Setup from the Edit menu to open the Copy Select setup for copy Setup control window.
-
Page 351: Creating Myscope Control Windows
that are displayed on screen, or Measurements Snapshot to copy the current snapshot data. If there is no valid snapshot data, the default snapshot values are copied. 18. Click Copy to save your setup information. The copy Copy the data operation takes place after you click Copy. -
Page 352: Editing Myscope Control Windows
C:\TekScope\MyScope. 13. From the MyScope menu, click Open Control Window…. Recall 14. Select the MyScope control window that you want from the Open MyScope Control Window dialog box and click Open. Editing MyScope Control Windows Use this procedure to edit previously defined MyScope control windows. 1. -
Page 353: Tasks
Click Calibrate Probe to begin the calibration procedure. The Probe Status indicator changes to Pass when the procedure is complete. If the procedure does not pass, contact your local Tektronix service personnel. Remove the connections from the terminals. Calibrating Passive Probes Use this procedure to optimize gain and offset accuracy at the probe tip. -
Page 354: Deskew
To compensate for timing differences between voltage and current probes, order the Probe Calibration and Deskew Fixture (067-0405-02). The fixture requires a user-supplied pulse generator when used with a TDS5000B Series instrument. Signal Path Compensation Use this procedure to compensate the internal signal acquisition. You should perform this procedure if the temperature has changed more than 5°... -
Page 355: Signal Path Compensation Status
Fail One or more failures occurred during the signal path compensation procedure. Contact your local Tektronix service representative for further action. Temp The operating temperature is not within 5° C of the previous signal path compensation. -
Page 356: Creating Reference Waveforms
Creating Reference Waveforms Use this procedure to create reference waveforms from active or math waveforms. Click Save on the toolbar or click Save As from File menu. Select Waveform from the Save As dialog box. From the Source list, select the waveform that you want to save as a reference. Click Ref(n) under Save in Oscilloscope Memory to save the waveform to nonvolatile memory. -
Page 357: Recalling Reference Waveforms
Recalling Reference Waveforms Use this procedure to recall a reference waveform from a file. Click Recall on the toolbar or select Recall from the File menu. Select Waveform from the Recall dialog box. Select the waveform that you want to recall and the Destination (Ref 1–4). Click Recall to load the waveform into memory. -
Page 358: Setting Up For Fastframe Operations
Setting up for FastFrame Operations Follow these steps to use FastFrame mode: Set up the Trigger control window to trigger on the signal of interest. Adjust the horizontal and vertical controls to display a waveform without any clipping. Adjust the Resolution controls to set the number of samples you want to acquire with each acquisition. -
Page 359: Setting Up A Dual Display
Setting up a Dual Display Use the following steps to set up the instrument for dual display operation. You can use the main display for most instrument operations while you use a second monitor to access other PC applications that you may have installed. You can also drag up to five dockable control windows from the TekScope application onto the display of the second monitor. -
Page 360: Creating Math Waveforms Using Predefined Expressions
Note To disable the external monitor, click the Settings tab in the Display Properties dialog box. Click the external monitor and clear the Extend my Windows desktop onto this monitor checkbox at the bottom of the dialog box. Creating Math Waveforms using Predefined Expressions Use the following steps to create math waveforms using predefined expressions: Open the Math Setup control window by clicking Math on the toolbar or by clicking... -
Page 361: Minimizing The Instrument Application
Minimizing the Instrument Application To minimize the instrument application so that you can use other programs on the Windows interface, select Minimize from the File menu or right-click anywhere in the graticule and select Minimize from the shortcut menu. To restore the application, click the application name on the Windows task bar. Shutting Down the Instrument When you push the front-panel On/Standby switch, the instrument starts a shutdown process (including a Windows shutdown) to preserve settings and then go into standby mode. -
Page 362: Creating An Emergency Startup Disk
Creating an Emergency Startup Disk Now that you have completed the basic installation process, you should create an emergency startup disk that you can use to restart your instrument in case of a major hardware or software failure. Store this disk in a safe place. CAUTION Create this disk and store it in a safe place. -
Page 363: Tds5000B Series Gpib Programmer Online Help
See the instructions in the TDS5000B Series Product Software CD booklet. The help file is also available as a PDF file on the TDS5000B Series Product Software CD-ROM shipped with the instrument. Refer to the CD-ROM instructions for installation information. -
Page 364: Triggering On A B Event
Triggering on a B Event Use this trigger sequence to trigger the instrument after a specified number of B events. Set the A trigger type and source from the A Event tab in the Trigger Setup control window. Set the B trigger type and source from the B Event tab. Select the A->B Seq tab, and then click Trig on nth Event. -
Page 365: Printing The Screen To A Printer
Printing the Screen to a Printer The easiest way to print the contents of the screen is to press the front panel PRINT button. The instrument will print the screen contents according to the settings in the Page Setup dialog. Use the File menu Page Setup dialog to select the Type of printing, Palette, View, and Image before printing. -
Page 366: Saving Instrument Setups
Select either Displayed Measurements (make sure that measurements are displayed in the graticule via the Measurement Setup control window) or Measurement Snapshot (to copy measurement snapshots). Click Copy to paste the measurements to the clipboard. You can now paste the measurements into your other applications. -
Page 367: Deleting Instrument Setups
Deleting Instrument Setups Use this procedure to delete an instrument setup saved to oscilloscope memory. Select the Delete submenu from the File menu. Then select the Setup that you want to delete, or select All Setups. Use this procedure to delete an instrument setup that you saved to a Windows directory. Select Recall from the File menu. -
Page 368: Setting The Horizontal Delay
Setting the Horizontal Delay Use the following steps to set up the horizontal delay mode of the instrument. Open the Horizontal/Acquisition Setup control window. Turn on the Horizontal Delay mode by clicking On under Delay Mode or pressing the front panel DELAY button. -
Page 369: Enabling A Network Connection
Enabling a Network Connection Use the following steps to enable network access to the instrument. This procedure requires that you begin with the instrument powered off, so you may want to print these instructions before you proceed. Attach a keyboard and mouse to the instrument. Power on the instrument. -
Page 370: Probe Compensation
Probe Compensation Printing Banners Use the following steps to print banners. Banners can only be printed on the integrated thermal printer. Open the Print dialog box from the File menu Print command. From the Name drop-down list, select Integrated Thermal Printer (the default). Click OK. Open the File menu Page Setup dialog box. -
Page 371: Inverting Channel Waveforms
Inverting Channel Waveforms Use the following steps to invert a channel waveform on the screen. Select the Invert command from the Vertical menu. From the Channel Selector tabs, click the waveform that you want to invert. Click Invert to toggle the button On. The waveform appears flipped on its zero volt axis. Other waveforms on the screen remain unchanged. -
Page 372: Using Mask Testing With Option Sm
Select the Color tab. Adjust slider controls for desired contrast. Click Apply, and then click OK. Using Mask Testing with Option SM Follow these steps to perform mask testing. Select Mask Setup… from the Masks menu or touch the Masks button on the toolbar to display the Mask Setup control window. -
Page 373: Saving Masks
Saving Masks Use the Mask Edit Setup control window to save a mask. Select Mask Edit Setup… from the Masks menu to display the Mask Edit Setup control window. Click Save to open the Save As dialog box. Select User Mask under Save What. You may need to click More to access the User Mask selection. -
Page 374: Glossary
Glossary Absolute Value Inserts the text FABS( into the math expression. The FABS function takes the absolute value of the expression. ACos Inserts the text ACOS( into the math expression. Acquisition Interval The acquisition interval is the time between sample points. For mathematical purposes, it is the time covered by the waveform record divided by the record length. - Page 375 signal nodes such as oscillations when you first set up the instrument. The length of time it waits for a trigger event depends on the time base setting. Average Inserts the text AVG( ) into the math expression. Enter an argument to the function. The average function produces the average of the argument.
- Page 376 Clock Source Channel Select the input channel that is connected to the clock signal. Clock Threshold Level To set the clock threshold voltage level, click Clock Level, and then use the multipurpose knob to set the voltage level. Comm Trigger Source Use the Source drop-down list to select the channel for the comm trigger source.
- Page 377 Cycle Mean This voltage measurement is the arithmetic mean over the first cycle in the waveform or the first cycle in the gated region. Cycle RMS This voltage measurement is the true Root Mean Square voltage over the first cycle in the waveform or the first cycle in the gated region.
- Page 378 Editor Button Closes this window and opens the Equation Editor control window so you can edit the math expression. E-mail on Trigger To send e-mails on a trigger event, click the E-mail on Trigger button On. E-mail on Event must be configured to enable E-mail on Trigger from the Trigger Mode control window.
- Page 379 Eye Width Eye width is the measurement of eye width in seconds. Eye Width = (tCross2Mean - 3 x pTopSigma) - (tCross1Mean + *tCross1Sigma) Fall Time This timing measurement is the time required for the falling edge of the first pulse in the waveform or gated region to fall from the high reference value (default = 90%) to the low reference value (default = 10%) of the final value.
- Page 380 Glitch Width The glitch width controls specify the maximum width of the glitch. Click the Width control and set the width with the multipurpose knob. Then click the < button to trigger the instrument only on glitches narrower than the specified width; or click the > button to trigger the instrument only on pulses wider than the specified width.
- Page 381 Horizontal Position Use the Position control to move the trigger point within the acquired waveform. To acquire waveform data only after the trigger event, set the Position control to zero. To acquire waveform data leading up to the trigger event, set the Position control to any value greater than zero. Click the control and use the multipurpose knob or the front-panel HORIZONTAL POSITION knob to enter a value.
- Page 382 Leakage Leakage results when the time domain waveform used to create the FFT function is periodic but contains a noninteger number of waveform cycles. When the record contains a fraction of a cycle, there are discontinuities at the ends of the record. These discontinuities cause energy from each discrete frequency to leak over on to adjacent frequencies.
- Page 383 Logic State Trigger Criteria Use the Trigger When Pattern selection to determine when the instrument should trigger. Select True to trigger the instrument when the logic patterns go true. Select False to trigger the instrument when the logic patterns go false. The low level measurement is the value used as 0% whenever high reference, mid reference, or low reference values are needed, such as in fall time or rise time measurements.
- Page 384 Mid Reference The Mid reference defines the middle reference level of a waveform; the default level is 50%. This reference value is primarily used for making measurements between edges such as pulse widths. To change this level, click the control, and then set the level with the multipurpose knob. Mid2 Reference The Mid2 reference defines the middle reference used on the second waveform specified in delay or phase measurements;...
- Page 385 Negative Width Measurement This timing measurement is the distance (time) between the mid reference (default 50%) amplitude points of a negative pulse. The measurement is made on the first pulse in the waveform or gated region. Noise Peak-to-Peak Noise p-p is the peak-to-peak value of the noise of the top or base of the signal as specified by you.
- Page 386 Phase This timing measurement is the amount of time that one waveform leads or lags another waveform. The measurement is expressed in degrees where 360° comprise one waveform cycle. Phase Argument Inserts the text SpectralPhase( ) into the math expression. Select one of the waveforms as an argument to the function.
- Page 387 Posttrigger Data The data acquired and displayed after the trigger event. You can set the amount of pretrigger data with the Horizontal Position control. Pretrigger Data The data points of the waveform acquired and displayed before the trigger event. You can set the amount of pretrigger data with the Horizontal Position control.
- Page 388 For most settings, descriptions of amplitude accuracy due to scallop loss (as discussed in other publications) do not apply to the TDS5000B Series Oscilloscope when used as a spectral analyzer because of zero-fill. Full span is the most likely setting where scallop loss might occur.
- Page 389 Setup and Hold Times Use the Setup Time and the Hold Time controls to specify the setup and hold limits. Click one of the highlighted areas in the control window, and then use the multipurpose knobs to set the limits. Signal to Noise Ratio S/N ratio is the ratio of the signal amplitude to the noise of the top or base of the signal as specified by you.
- Page 390 Inserts the text TAN( into the math expression. Tanh Inserts the text TANH( into the math expression. TekProbe Interface The TekProbe interface enables the instrument to sense information about the probe such as the serial number and other unique identification information. It also allows the instrument to provide power directly to the probe.
- Page 391 Noise rejection provides stable triggering by increasing the trigger hysteresis. Increased hysteresis reduces the trigger sensitivity to noise but may require greater signal amplitude. Trigger Delay Use the Trig Delay control to trigger the instrument a specified period of time after the A trigger. After the A trigger arms the trigger system, the instrument triggers on the next B trigger event that occurs after the time that you specify with the Trig Delay control.
- Page 392 Trigger Level Marker Trigger On Select a value from the Trigger On drop-down list to specify where the trigger will occur on the video signal. The Trigger On drop-down list contains the options Field, All Lines, and Line #. If you select Field, use the drop-down list to select Odd, Even, or All. If you select Line #, use the multipurpose knob to set the line number.
- Page 393 Trigger When To qualify the trigger for Window triggering, select from these drop-down list combinations: Inside Limits and Trigger the instrument when the signal enters (or leaves) the Occurs or window defined by the threshold levels. Outside Limits and Occurs Inside Limits and Trigger the instrument when the signal enters (or leaves) the Wider or Outside...
- Page 394 Upper and Lower Threshold Values The upper and lower threshold levels define the voltage limits of a runt pulse. To adjust the upper threshold level, click the Upper Limit control and then use the multipurpose knob to set the voltage level. To adjust the lower threshold level, click the Lower Level control and then use the other multipurpose knob to set the voltage level.
- Page 395 XY format pairs When you use the XY display format, channel and reference waveforms are assigned to the axis indicated in the following tables. You cannot display math waveforms in XY format.
- Page 396 Index 3 dB BW in Bins ............................275 A Event trigger types..........................119 Absolute Value ............................374 AC line voltage............................237 Access Shortcut Menus with Right-Click..................... 46 Accessories..............................34, 35 recommended............................35 standard..............................34 ACos................................374 Acquire data ............................... 227 Acquired waveform ............................ 229 Acquisition ............................104, 105 Acquisition Mode control window ......................
- Page 397 ATan................................374 Attenuation ............................50, 90, 93 Audio port ..............................61 AutoBright............................140, 141 Autofit ..........................173, 174, 183, 184 masks ..............................173 Auto-increment file name........................73, 356 Automatic measurements ........................... 159 taking ..............................331 Automatic Measurements ........................... 324 AutoScroll Control Window......................... 80 Autoset ........................116, 173, 174, 183, 227 AUTOSET button .............................
- Page 398 Color palette ..........................48, 251, 367 black and white ............................70, 74 color ..............................70, 74 custom..............................367 grayscale ..............................70, 74 monochrome gray ..........................48, 367 monochrome green ..........................48, 367 normal ..............................145 spectral..............................145 Comm trigger control window ........................130 Comm trigger pulse form ........................... 138 Comm triggering ............................
- Page 399 Coupling ..............................85 Cursor Position ............................152 Cursor Setup ............................150 Cursor Type Setup ..........................151 Deskew ..............................89 Display On-Off ............................81 Display Setup............................139 docking ..............................45 Edge Trigger ............................122 Equation Editor ............................198 FastFrame Controls..........................116 FastFrame Setup .............................
- Page 400 Copy Setup control window ......................... 74 Images............................... 74 Measurements ............................75 Waveforms..............................74 copying ............................... 365 images ..............................51, 74 measurements........................51, 75, 365, 366 screen ................................ 51 waveforms..............................74 Copying Waveform Data........................289, 349 copyright information........................... 22 Cos................................376 Cosh................................376 coupling..............................93, 228 AC..............................93, 228 Coupling control window .........................
- Page 401 Cursor Setup ............................150 Cursor Type ............................151 Cursors On .............................. 150 Cursors Using XY Display Format ......................156 Custom control window ........................47, 211, 352 editing ..............................352 customer support ............................32 customize color............................146 Customizing Color Palettes ........................367 date ................................
- Page 402 Displayed waveform........................... 228 Displaying Waveforms..........................321 displays................................. 81 appearance ............................139, 371 color palette............................. 144 colors............................... 144 contrast.............................371, 372 Display On/Off control window ....................... 81 Display Setup control window..................139, 142, 143, 144 LCD backlight............................144 objects ..............................143 persistence............................... 140 screen objects............................143 screen text ...............................
- Page 403 exporting files............................... 70 images ............................... 70 measurements............................72 waveforms..............................72 external reference ..........................52, 104, 217 External Signals control window........................ 217 external trigger ............................. 52 Eye aperture..............................286 Eye diagram..............................285 failure log ..............................178 Failure notification ..........................189, 193 fast acquisition............................48, 106 Fast acquisition turning on and off ...........................
- Page 404 setup............................333, 335, 336 Frequency Domain Averaging........................282 Frequency Domain Controls........................270 Front Panel triggering from............................302 front panel controls............................56 channel buttons ............................56 DEFAULT SETUP ........................... 46 INTENSITY.............................. 48 POSITION ..............................56 SCALE..............................56 termination button............................. 56 TOUCH SCREEN ............................ 63 Front Panel controls Autoset..............................
- Page 405 Hardware ..............................234 Acquisition.............................. 234 hardware applications..........................361 adding ..............................361 removing ..............................361 harmonics ..............................283 Hi Res mode ..............................97 high input impedance probes........................56, 95 High Res acquisition mode effects of ..............................282 High/Low Method ............................256 histogram.........................49, 53, 164, 166, 260, 364 automated measurements ........................
- Page 406 Input resistance..............................228 termination .............................. 228 Input amplifier............................234 Input channels..........................225, 234, 237 Input Conditioning ............................. 227 Input signal setting up..............................296 installation manual ............................31 installing options ............................224 Installing software ............................29 instrument calibration..........................218 Instrument Calibration control window ....................218 Instrument Diagnostics control window.....................
- Page 407 procedure ..............................344 Limit Testing Concepts ..........................287 Linear interpolation ............................ 255 linear magnitude ..........................271, 272 Localizing a Measurement ......................... 326 Lock Mask..............................181 Log ................................177 Logic state triggering..........................313 Logic triggers ............................. 120 low input impedance probes ........................56, 95 Magnitude Controls ............................
- Page 408 Repeat ..............................178 Start or Reset............................180 Summary..............................179 Mask testing ........................49, 244, 283, 284, 372 setting up..............................337 using................................ 372 Mask testing overview..........................284 Mask tolerance ............................174 Mask type ..............................337 Mask Types and Standards ......................... 169 Math Colors..............................250 math equations............................
- Page 409 Measurement gating ..............................326 localizing..............................326 Measurement Save Options .......................... 72 measurement setups............................ 167 delay................................ 167 phase ..............................167, 168 measurements ..........................161, 358, 364 automatic..........................324, 358, 364 cursor ..............................355 gating ..............................165 histogram .........................160, 164, 165, 364 horizontal ..............................154 horizontal parameters..........................
- Page 410 Option limit test............................192 Option SM ..............................283 options ............................38, 53, 54, 55 application software packages ........................ 224 installation............................... 224 Options Waveforms............................71 Overview functional ..............................225 process ..............................226 P value ................................ 285 Page Setup dialog box ..........................69 paired cursors .............................
- Page 411 Print ................................70 PRINT button ............................... 59 Print screen ..............................70 printer ..............................69, 70 external ............................37, 51, 61 internal ............................51, 69, 370 page setup ..............................69 selecting .............................69, 370 thermal ...............................51, 370 printing ................................. 69 banners............................51, 69, 370 capturing the screen ..........................365 color palette..........................51, 69, 365 copying ..............................
- Page 412 RBW................................270 Readouts ..............................222, 223 rebuild hard disk............................362 Recall Dialog Box Instrument Setups ......................67 Recall Instrument Setup control window ..................... 67 Recall User Mask ............................187 Recalling............................288, 357, 373 masks ..............................373 Setups..............................288 template..............................357 Waveforms.............................. 289 Recalling a Template Waveform........................
- Page 413 Save As Dialog Box Histogram........................72 Save As Dialog Box Instrument Setup ......................66 Save As Dialog Box Measurement......................72 Save As Dialog Box Screen Capture ......................70 Save custom window..........................214 Save failed waveforms ..........................177 Save Instrument Setup control window......................66 Save Limit Test ............................
- Page 414 recalling ............................288, 289 saving..............................288 shortcuts ............................... 46 Shutting down the oscilloscope ........................361 Side Lobe.............................275, 276 Side Panel Connectors..........................61 signal characterization ..........................49 Signal connection ..........................227, 234 Signal input..............................296 signal path compensation procedure......................87, 354 Signal Processing and Transformation ....................... 225 Sin................................
- Page 415 32 Tek Exponential Window........................... 282 defined ..............................282 Tek Secure Erase ...........................46, 224 TekProbe interface..........................46, 390 Tektronix Toolbar for Word ......................... 42 Template..........................189, 287, 288, 357 recall ............................... 357 termination.............................92, 228 and coupling.............................. 84 Termination control window........................84 Test failure..............................
- Page 416 Resolution ............................268, 269 Time domain setup................................ 333 Time domain controls..........................268 time domain gating ............................. 294 Time duration ............................. 232 Time measurements............................ 159 Time Stamp Table ..........................73, 114 Time Stamping Frames..........................300 Time stamps ............................... 114 Timeout Trigger ............................240 defined ..............................
- Page 417 Trigger threshold ............................132 Trigger Types ............................. 237 triggering .............................226, 302, 303 Triggering from the Front Panel......................... 302 Triggering from the Trigger Setup Window....................304 Triggering on a glitch ..............................306 a pattern ..............................312 a pulse width ............................308 a Runt pulse ............................
- Page 418 Turning Fast Acquisition On and OFF ....................... 299 Type of mask .............................. 337 Upgrades............................... 38 User color palette..........................146, 367 user interface ..........................23, 28, 30, 44 User mask ............................343, 372 creating ............................340, 343, 374 editing ..............................341 saving..............................342 User mask edit ............................189 User Mask Setup ............................
- Page 419 Vertical menu options........................... 77 Attenuation ............................... 90 Bandwidth..............................86 Coupling ..............................85 Deskew ..............................89 Invert................................. 94 Label ................................. 82 Offset ................................ 84 Probe Cal ..............................87 Termination............................84, 85 Vertical Setup ............................77 Zoom Controls ............................79 Zoom Graticule ............................77 Zoom Setup............................77, 78 Vertical offset .............................
- Page 420 defined ..............................240 Window Bin Width ............................ 270 Window threshold violations triggering ..................... 317 window trigger ............................128, 244 defined ..............................244 windows ..............................359, 360 dockable..............................359 Windows interface............................39 Zero Phase Reference ..........................275, 276 Zoom ............................47, 48, 142, 256 graticule ..............................47 using................................
Need help?
Do you have a question about the TDS5000B Series and is the answer not in the manual?
Questions and answers