Table of Contents
Advertisement
Operation Manual for PQWT-S150/S300/S500
Geophysical Prospecting Instrument
Foreword.................................................................................................................................2
Caution....................................................................................................................................2
Product Overview...................................................................................................................2-3
Advantages..............................................................................................................................3
Technical Parameters.............................................................................................................4
Instrument structure and name.............................................................................................5-6
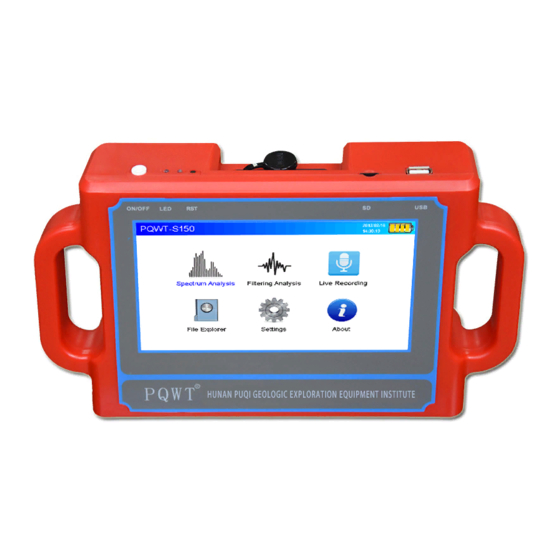
PQWT-S150......................................................................................................................5
PQWT-S400......................................................................................................................5
PQWT-S500......................................................................................................................6
Instrument Host Panel............................................................................................................6-7
The use of the Instrument.......................................................................................................7-13
Instrument Works Introduction..........................................................................................7
Main Screen Description....................................................................................................7-11
M N Electrode Description................................................................................................11-12
Wiring method...................................................................................................................12
Data Transmission and Data Format..................................................................................12-13
Instrument Drawing Methods.....................................................................................................14-33
Case Show..................................................................................................................................33
Advised Measurement Approach...............................................................................................34
Configuration Table....................................................................................................................35
Guide for After-sale Services.....................................................................................................35
Statement....................................................................................................................................35
Contents
1
Advertisement
Table of Contents

Related Manuals for PQWT PQWT-S Series


Summary of Contents for PQWT PQWT-S Series
-
Page 1: Table Of Contents
Operation Manual for PQWT-S150/S300/S500 Geophysical Prospecting Instrument Contents Foreword..........................2 Caution............................2 Product Overview........................2-3 Advantages..........................3 Technical Parameters......................4 Instrument structure and name.....................5-6 PQWT-S150........................5 PQWT-S400........................5 PQWT-S500........................6 Instrument Host Panel......................6-7 The use of the Instrument.......................7-13 Instrument Works Introduction..................7 Main Screen Description....................7-11 ... -
Page 2: Foreword
Product Overview PQWT-S Series geophysical prospecting instrument: the use of natural electric field source as a working farm, with resistivity contrasts underground rocks and minerals or groundwater, based on measuring the natural electric field on the surface of the N different frequency electric field component, according to their different variation to study Abnormal changes in geological bodies produce, reaching solve geological problems one electrical prospecting methods. -
Page 3: Advantages
as natural potential frequency method. According to this theory the design and production of equipment called potential frequency of detecting instrument, referred to natural selected frequency electric field instrument or instruments for geological exploration work. Therefore, from a professional point of view to classify, geological equipment should belong to this category in the instrument geophysical equipment among electrical equipment. -
Page 4: Technical Parameters
Technical Parameters Model No. Depth Accuracy Channel Frequency Other Automatic noise reduction, super anti-jamming. DC12V 4500mAh PQWT-S150 150 meter 0.1mv Triple, Multiple User-friendly interactive 320x420 Built-in Battery interface , high-speed CPU control, the menu prompts. Automatic measurement, storage of data, drawing curves. -
Page 5: Instrument Structure And Name
Instrument Structure and Name PQWT-S150 PQWT-S400... -
Page 6: Pqwt-S500
PQWT-S500 Instrument Host Panel 1. LCD Screen Display data and curves and the various operating states and measurement results during the operation. 2. M N Input terminal, insert M, N electrode connector. 3. -2 -1 0 1 2 Switch Special anti-jamming design: 0 for the basic interference set , -2 -1 for the strong signal jamming design, 1 2 for the weak signal jamming design. -
Page 7: The Use Of The Instrument
Charging time 4-8 hours. ( Only could be charged after turned off the machine ) . The use of the Instrument (PQWT-S150 as the sample) Instrument Works Introduction By the M, N electrode probe ( transducer ) via a cable earth's magnetic field to electrical signal... - Page 8 Figure 2 Main Screen Tri-band Status : When you enter the main screen, " Tri-band " selected by default, Press OK button, enter the three frequency measurement mode, you can proceed three -frequency related measurements operations. Multi-band status : When you enter the main screen, " Tri-band " selected by default, Press " →...
- Page 9 Line The instrument can store 30 measuring lines, each measuring line can store 30 measuring points. The display information of measuring line and measuring point is shown at the bottom, the number behind "Line=" indicates the current line number, the number behind " Site=" indicates the stored measuring points on the current measuring line.
- Page 10 Export After plug U disk into the USB port of instrument, select " Export" on the main screen and press the OK button, then the status bar display: Start output data, until show " output the data to USB sucess", before pull out U disk.
-
Page 11: M N Electrode Description
Delete: Unforeseen circumstances during measurement, you need to delete a measuring point data, press the "→" button to move to " Delete " and press the "OK" button, point number ( the number behind " Site =" ) minus 1 , indicating that the point data is deleted. ... -
Page 12: Wiring Method
Figure 5 Wiring method Geophysical lines are generally arranged perpendicular to the line to be constructed , can detect tectonic crushed zone on both sides of the border and its different physical characteristics , contrast is strong, crushing width , extending distinctive characteristics. In order to accurately locate, confirmed the location of the abnormal ground point, generally use measuring rope ( or tape ) pull straight line, and mark with paint at the beginning of the measuring line, so that find、measure position according to the test results of drawing later. - Page 13 Boot into the main screen , as shown below in Figure 7, Figure 7 Select the data needed transfer in " Tri-band ", " Multi -band " or select " Delete ". Note: Select " Delete " and "OK" will clear all data in instrument. When you enter the main screen, "...
-
Page 14: Instrument Drawing Methods
Instrument Drawing Methods Method No. 1:Line Chart 1. Open the record data as shown in figure 1: Figure 1 2. Copy all values exclude L and N columns as shown in figure 2: Figure 2 3. Then paste to (the red area) as shown in figure 3,... - Page 15 Figure 3 4. Select all coiped data as shown in figure 4: Figure 4 5. Then click “Insert-Chart-Line” as shown in figure 5,...
- Page 16 Figure 5 6. Select the first group in Line, then click “ Next” as shown in figure 6: Figure 6 7. Choose “Columns”, then click “ Finish” as shown in figure 7.
- Page 17 Figure 7 8. Now, the Line Chart is finished. Judge from the chart, point 13 will be recommended to drill. Figure 8 Method No. 2:Contour Map...
- Page 18 ,copy all velaues exclude L and N columns as shown 1. Open the recorded data in figure 1: Figure 1 ,the steps and position 2. Then the values through-Paste Special-Values-Transpose to as shown in figure 2 and figure 3, Figure 2...
- Page 19 Figure 3 3. Copy the values of A、B、C columns(Note: the quantity of points you record=the quantity of groups which are copied. ) For example, there are 19 sets of data above, copy until No. 19 set as shown in figure 4. Figure 4 , then through “Paste Special-Values,...
- Page 20 Figure 5 Figure 6 After Click “ Ok”, then click “ Save” . 5. Next step is drawing, launch , the interface as shown in figure 7.
- Page 21 Figure 7 6. Select “Grid-Data”, choose the new created Excel form above, then will choose the items as shown in figure 8, Figure 8 7. Click “ Ok”. The file will be created as shown in figure 9.
- Page 22 Figure 9 8. Then select” Map-Contour Map-New Contour Map, choose the file saved above as shown in figure 10. Figure 10 Here, the contour map is created. 9. Double click the map above, then will appear dialog box as shown in figure 11,...
- Page 23 Figure 11 10. Check “Fill Contour & Smooth Contours & Color Scale, Choose Amount: High. Then choose “Levels-Fill-Foregroud-Load as shown in figure 12 & 13 & 14. Figure 12...
- Page 24 Figure 13 Figure 14 Load the file as shown in figure 15, Figure 15 11. Then select “ Scale” as shown in figure 16:...
- Page 25 Figure 16 12. Then cross off “ Proportional XY Scale “ , modify length of X Scale and Y Scale as shown in figure 17, Figure 17 Click “ Apply” and “ Ok” as shown in figure 18,...
- Page 26 Figure 18 13. Double click x-axis, choose “ Scaling”, moify “Major and First Major” as 1, “ Last Major” 19, as shown in figure 19. Figure 19 11. Then click “ok”, here Contour Map is finished as shown in figure 20. The data of Y-axis is the detection depth, the data of X-axis is the detection points.
- Page 27 Figure 20 Here, the contour map is finished.
- Page 28 Method No. 3:Data Assimilation For some special data, the difference of high value and low value is very big. The the blue area is very large, and it’s difficult to find the effective position. In this situation, we can use the method of data assimilation to make the graph, then compare it with the Contour Map for reference.
- Page 29 The selected reference line and reference point corresponding to column and row, mark colour for column and row on the form , as shown below in figure 3, Figure 3 3. Copy the “row” of marking color, paste it into the right position AT 1 as shown below in figure Figure 4 4.
- Page 30 5. After processing the above steps , as shown in Figure 6 below: Figure 6 6. Make a Line Chart using the data in red frame above, then compare with the original line chart as shown below in figure 7, Figure 7 7.
- Page 31 need to lower the high values into 0.2 area. For example, we lower the hig value 0.8 into 0.2, as shown in figure Figure 8, Figure 8 Based on this method, lower other high values into 0.2 area, then the line chart will be changed as shown below in figure 9, you can find that other low values will be more obvious than the original one.
- Page 32 Figure 10 9. After processed the data, then we can make the graph according to the method No. 2 above, here is the contrast between Data Assimilation and Contour Map (It’s the graph according to the original data) in figure 11, the point 11 is recommended. Figure 11 Here, the Data Assimilation graph is finished.
-
Page 33: Case Show
Case Show: This case diagram is from the actual case diagram of Douala, Cameroon. The field prospecting is completely consistent with drilling result. Well position was designed with 13 walls 45m deep. After well completion, there is 9 m3 water per hour, to which client was very satisfield. -
Page 34: Advised Measurement Approach
Advised Measurement Approach In order to locate accurately, judge the location of the abnormal ground point, generally using lining rope as straight line, carry out paint markers at the beginning or middle position, so that find the corresponding position according to the test results of graph after measuring. ... -
Page 35: Configuration Table
Guide for After-sale Services Within two years of the purchase date, if instrument quality problems, please send us the photos, we will send the required part or repair for you. Each of us shall take care of the corresponding shipping cost on each side.
Need help?
Do you have a question about the PQWT-S Series and is the answer not in the manual?
Questions and answers