Table of Contents
Advertisement
Quick Links
FTS4USB™ USB 2.0 Analyzer
Quick Start Guide
Copyright © 2000-2011 Frontline Test Equipment, Inc. All rights reserved. You may not reproduce,
transmit, or store on magnetic media any part of this publication in any way without prior written
authorization of Frontline Test Equipment, Inc. FTS, Frontline, Frontline Test System, and ComProbe are
registered trademarks of Frontline Test Equipment, Inc. FTS4BT is a trademark of Frontline Test
Equipment, Inc. The Bluetooth SIG, Inc. owns the Bluetooth word mark and logos, and any use of such
marks by Frontline is under license. All other trademarks and registered trademarks are property of their
respective owners.
Advertisement
Table of Contents

Related Manuals for FrontLine FTS4USB


Summary of Contents for FrontLine FTS4USB
- Page 1 Frontline Test Equipment, Inc. FTS4BT is a trademark of Frontline Test Equipment, Inc. The Bluetooth SIG, Inc. owns the Bluetooth word mark and logos, and any use of such marks by Frontline is under license. All other trademarks and registered trademarks are property of their respective owners.
-
Page 2: Table Of Contents
CONTENTS Minimum System Requirements ........................1 Introduction ..............................2 Hardware Description ........................... 3 Connecting the USB ComProbe II to the Device Under Test (DUT) ............5 Connecting only one Device Under Test ....................5 Connecting more than one Device Under Test ..................6 Connection tips ............................ -
Page 3: Minimum System Requirements
MINIMUM SYSTEM REQUIREMENTS • PC with Windows XP 32 bit, (Service Pack 2 or higher), Windows 7 (32 and 64 bit). • Pentium 2 GHz processor • RAM Requirements: 2 GB minimum • 50 MB free Hard Disk Space (capture file size is limited only by disk size) •... -
Page 4: Introduction
USB ComProbe II, USB Captures and decodes USB bus activities and transactions. For this document we will assume that you have already installed the software for FTS4USB. If our assumption is correct, you can move to the next section and we will get started. If, however, you haven't installed the software and ComProbe drivers, you need to stop here, open FTS4USB How to Install.pdf., and follow the instructions to take care of installation. -
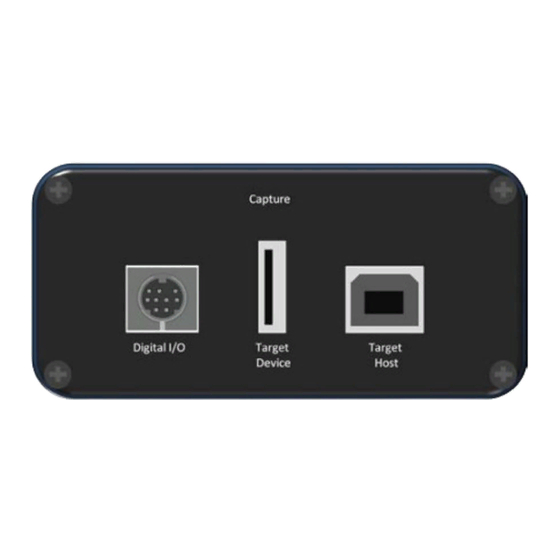
Page 5: Hardware Description
Figure 1a – Front Panel The back panel has one USB connection labeled "Analysis PC" for connecting the USB ComProbe II to the computer running FTS4USB (Figure 1b). Figure 1b – Back Panel There are three LED’s on top of the ComProbe (Figure 1c). - Page 6 • The orange LED (TST) serves as a Capture Port connection indicator. It glows when the Target Host is connected. • The red LED (ACT) indicates bus activity. • The yellow LED (PWR) serves as an Analysis Port connection indicator. The PWR LED will be illuminated when the analyzer has been correctly connected to the analysis computer and is receiving power from the USB.
-
Page 7: Connecting The Usb Comprobe Ii To The Device Under Test (Dut)
Connecting the USB ComProbe II to the Device Under Test (DUT) Once you have the software and the drivers loaded, the next step is to connect your hardware. The USB ComProbe II is a high speed, full speed and low speed USB 2.0 protocol analyzer that sends data using a high speed USB 2.0 connection. -
Page 8: Connecting More Than One Device Under Test
Connecting more than one Device Under Test USB analyzers are able to analyze traffic coming only from devices connected under them. If a device is connected above the analyzer, it will only register data packets coming from the host. Figure 2b shows an incorrect connection: the USB mouse is connected 'above' the analyzer. -
Page 9: Connection Tips
Connection tips Most performance problems such as input buffer overflow are the result of improper connections. To achieve optimal performance from the USB analyzer, we recommend the following configuration: • Use two high-speed computers, one for the analyzer and one for the device under test •... -
Page 10: Opening/Selecting Data Capture Method
Now that the software and drivers are installed and the hardware is positioned correctly, the next step is to open FTS4USB and select the data capture method. 1. Open "FTS4USB" from the Start menu or from the Desktop folder. 2. Select "Frontline FTS4USB". - Page 11 3. Select "one of the options". 4. Select "Run". FTS4USB will open with the Control Window (Figure 3b) visible. Figure 3b - Control WIndow Now you are ready to begin capturing and analyzing data. P a g e...
-
Page 12: Capturing Data
CAPTURING DATA FTS4USB can capture data to a single file or series of files. Data capture can be initiated from the Control window, the Event Display or the Frame Display. You do not need any window other than the Control window open to capture data. -
Page 13: Analyzing Data
Figure 4a - Control Window FTS4USB is organized around this window. The Control window allows you to control data capture and access the other windows used to view data. While there are a number of dialogs you can use to analyze the data, let's look quickly at some of the options you have. - Page 14 Panes Frame display allows you to see an amazing amount of information from your protocol. The Frame Display is divided into panes, where each pane shows a different view of the data. • The Summary pane (Figure 4c) stretches across the top of the display. Each line in the Summary Pane represents one frame, except when running in one of the USB HCI Sniffing modes where each line represents one transaction.
- Page 15 • The three smaller panes on the bottom right of the Frame Display show the data in hex, binary and ASCII (Figure 4e). The user can choose to have these panes show the data in other radixes or character sets. Select any field in the Decode pane and the corresponding bit(s) or byte(s) will be selected in the data panes.
-
Page 16: Event Display
Event Display The Event Display window (Figure 4f) provides detailed information about every captured event. Events include data bytes, data related information such as start-of-frame and end-of-frame flags, and the analyzer information, such as when the Data Capture Was Paused. Data bytes are displayed in hex on the left side of the window, with the corresponding ASCII character on the right. -
Page 17: Common Features
Common Features Display Synchronization The system synchronizes the display in the Frame Display with the Event Display. Select a frame in the Frame Display and the other windows automatically update to highlight the bytes in the selected frame. Select a byte in the Message Sequencing Chart and the Frame Display and Event Display updates to show the frame containing the byte. -
Page 18: Technical Support
TECHNICAL SUPPORT Technical support is available in several ways. The online help system provides answers to many user related questions. Frontline’s website has documentation on common problems, as well as software upgrades and utilities to use with our products. Web: http://www.fte.com, click Support...
Need help?
Do you have a question about the FTS4USB and is the answer not in the manual?
Questions and answers