Table of Contents
Advertisement
Quick Links
Advertisement
Table of Contents

Related Manuals for BNC 7000 Series


Summary of Contents for BNC 7000 Series
- Page 1 User Manual V3.0 (May 2019) 7000 Series Signal Source Analyzer...
- Page 2 All Berkeley Nucleonics (BNC) instruments are warranted against defects in material and workmanship for a period of two years from the date of shipment. BNC will, at its option, repair or replace products that prove to be defective during the warranty period, provided they are returned to BNC and provided the preventative maintenance procedures are followed.
-
Page 3: Table Of Contents
Table of Contents GENERAL REMARKS ..............................5 ............................5 ALIDITY OF THIS ANUAL ................................. 5 ASING ............................... 5 ONNECTIONS ............................. 6 IGNAL ONNECTIONS ..............................6 RANSPORTATION SAFETY INFORMATION ............................7 ..............................7 IGNAL YMBOL ............................. 7 ABELS ON RODUCTS ..........................8 ENERAL AFETY ONSIDERATIONS... - Page 4 Installing the 7000 Series Graphical User Interface (7000 Series GUI) ............16 Troubleshooting the LAN Interconnection....................17 Shutting Down the 7000 Series ........................17 Perform Firmware Upgrade ........................17 Serial Number .............................. 18 USING THE GRAPHICAL USER INTERFACE (GUI) ....................19 7000 S GUI ..........................
- Page 5 REMOTELY PROGRAMMING THE 7000 SERIES ..................... 40 LAN ..............................40 CCESS VIA VXI-11 ........................... 40 SING AND ONFIGURING USB-TMC I VISA ......................41 SING THE NTERFACE WITH USB-TMC I IVI D ....................41 SING THE NTERFACE WITH RIVERS GPIB I ...........................
-
Page 6: General Remarks
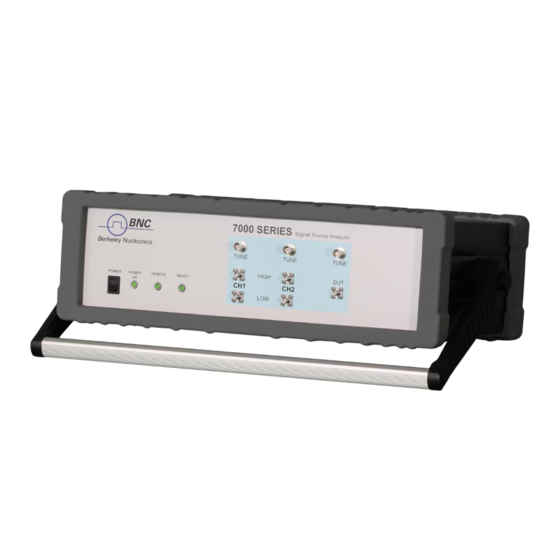
Model 7340 Casing The instrument is available as a benchtop case. Figure 1: 7000 Series in 3U benchtop case Data Connections The instrument may only be connected to a network or a computer by using a shielded LAN or USB cable. -
Page 7: Signal Connections
Signal Connections In general, all connections between the instrument and another device should be made as short as possible and must be well shielded. It is recommended to use high-quality cables with low loss especially for frequencies above 20 GHz. Transportation The instruments must only be transported with the packaging supplied by the manufacturer. -
Page 8: Safety Information
Safety Information The following information is important to prevent personal injury, loss of life or damage to the instrument. Please read them carefully. If the instrument is used in a manner not specified by this manual, the protection provided by the instrument may be impaired. Signal Symbol In this manual, the following symbols are used to warn the reader about risks and dangers. -
Page 9: General Safety Considerations
General Safety Considerations FCC notice This equipment has been tested and found to comply with the limits for a Class A device, pursuant to Part 15 of the FCC Rules. These limits are designed to provide reasonable protection against harmful interference when the equipment is operated in a commercial environment. -
Page 10: Technical Specifications
Technical Specifications Dimensions Dimensions of the 3U benchtop case: 467mm 153mm 518mm 341mm 400mm Weight: 10 kg Berkeley Nucleonics Corporation info@berkeleynucleonics.com | www.berkeleynucleonics.com V3.0 2955 Kerner Blvd, San Rafael, CA 94901 | 800-234-7858... -
Page 11: Connectors
Disconnects the instrument from the DC power input completely. DUT region DUT TUNE port This female BNC connector is the tune voltage output for the Device under Test (DUT), designed to supply a bias or control voltage for the DUT. DUT RF IN port This female SMA or 2.92 mm connector is the DUT signal input. -
Page 12: Rear Panel
Figure 3: 7000 Series Rear Panel View 1 /2 BASEBAND IN port These female BNC connectors are the baseband signal inputs used for the FFT analyzer measurement mode. They are AC coupled and have an input impedance of 1 k ohms. EXT TRIG port This female BNC connector is the external trigger input (TTL). -
Page 13: Minimum Distances
Interface Bus (GPIB) connector enables configuration and control by an automatic test equipment (ATE) system. This GPIB connector is used solely for controlling the 7000 Series from an external controller and cannot be used as a control connection for other devices. -
Page 14: Energizing And De-Energizing
Energizing and de-Energizing To energize the instrument, apply the following voltage to the following connector. Position of the power connector shown on the left. Voltage: 24V DC Max. current: 2.7A Use the supplied power adapter from Berkeley Nucleonics to supply the Instrument. -
Page 15: Introduction
Introduction This instruction manual is valid for the Berkeley Nucleonics model 7000 series. The following chapters give guidance for a quick and easy setup and use of your new instrument. General Features and Functions (Model Overview) Berkeley Nucleonics Signal Source Analyzer model overview... -
Page 16: Getting Started
Using other supplies may lead to malfunction and damage of the Instrument. Use the power switch on the front panel to turn on the 7000 Series. The green LED marked POWER on the front panel will indicate that the power supply is connected, and the instrument is starting. During the initialization process, the green LED marked READY will start to flash briefly. -
Page 17: Connecting To Lan Via Dhcp Router
169.254.xxx.xxx (excluding 169.254.1.0 and 169.254.254.255) and network mask 255.255.0.0 to match the fallback IP that the 7000 Series will assign itself after network timeout. The 7000 Series will automatically choose an IP address according to ZEROCONF standard. Therefore, the exact fallback address can’t be predicted. -
Page 18: Troubleshooting The Lan Interconnection
To install the GUI on the computer, insert the 7000 Series Software and Manual CD into the CD/DVD drive or download the latest GUI setup file from the Berkeley Nucleonics website. If the setup doesn't start automatically, double click on the setup.exe to run the installer. -
Page 19: Serial Number
Serial Number Each instrument is manufactured with a unique serial number shown on the sticker on the rear panel. This serial number is also internally stored and determines the instrument configuration and guides the software accordingly. Berkeley Nucleonics Corporation info@berkeleynucleonics.com | www.berkeleynucleonics.com V3.0 2955 Kerner Blvd, San Rafael, CA 94901 | 800-234-7858... -
Page 20: Using The Graphical User Interface (Gui)
Starting the 7000 Series GUI Double-click the 7000 Series shortcut that will appear on the desktop after the software has been successfully installed. Ensure that the 7000 Series is turned on and connected to the computer using either Ethernet or USB connectivity. -
Page 21: Menu Bar
Plots can be exported into the following file types: png, csv, xls, mat, and apph (proprietary format to allow reimporting into a 7000 Series GUI). The configuration of a spec line can be seen below. The data can be input manually in table format on the left or by clicking and dragging in the plot on the right. -
Page 22: Measurement Tabs (Modes)
Help Menu To view information about the 7000 Series GUI itself, the help menu can be used. It also offers the possibility to log a session or some interaction in an encrypted way for support purposes. Activating this option will slow down performance significantly so it is only advised to so when instructed by Berkeley Nucleonics support staff. -
Page 23: Mode: Absolute Phase Noise Measurement
Spectrum Analysis Clicking on a tab will activate the corresponding measurement setup. The following sections describe each measurement mode and how to configure the 7000 Series to successfully perform a measurement. Mode: Absolute Phase Noise Measurement Use this tab to measure absolute phase noise of a continuous waveform (CW) or a pulse modulated signal. -
Page 24: Absolute Phase Noise Measurement Of A Continuous Wave (Cw) Signal
After clicking on the Measure button, the phase noise measurement is initialized. A couple of calibration steps are automatically performed, and phase noise data is acquired from the 7000 Series. Figure 7 shows the GUI during the measurement process. The measurement trace is displayed in red, detected spurs are marked black. -
Page 25: Absolute Phase Noise Of A Pulsed Signal [Requires Option Pulse]
Absolute Phase Noise of a Pulsed Signal [requires Option PULSE] The 7000 Series can be configured for pulsed signal measurements by activating the pulsed mode checkbox in the Signal Detection area. The 7000 Series will automatically detect all the necessary parameters such as pulse rate and duty cycle and adjust the measurement process accordingly. -
Page 26: The Plot Window Tabs
Figure 8 Absolute phase noise measurement of a pulsed signal. The Plot Window Tabs The plot window is comprised of six tabs: Measurement, Time Domain, Data Table, Statistics, DUT Info, and Measurement Status: Measurement is the main tab to display frequency domain results like phase noise plots. Time Domain provides time domain measurement information during idle state (frequency and power detection, calibration), and during the measurement process (locking, and data acquisition). -
Page 27: List Of Traces
Figure 9 The Statistics tab provides additional information about the selected data trace DUT Info constantly monitors the DUT CW frequency and power while in idle mode and shows the tuning voltage of internal references during the measurement process. The values are updated approximately once per second, while in GUI idle state. -
Page 28: Plot Windows
Add: The current measurement trace (red trace) can be stored in the trace list by clicking on the “add” button. The stored trace is named with “trace <i>” (where <i> is the smallest number not already taken by another trace). Additional information, such as DUT frequency, number of correlations, and time and date of measurement are included in the trace list. -
Page 29: Saving And Loading Traces
7000 Series: All traces in an internal format; the internal file format can be loaded back into the GUI Traces can be imported if they were previously saved in the 7000 Series internal format. Use the Plot → Load Trace(s) menu or drag the file into the application. Select the 7000 Series file to import and confirm by clicking the Open button. -
Page 30: Measurement Time (Using Gui)
Measurement Time (using GUI) The measurement time required by the 7000 Series depends on several parameters. The total measurement time consists of the setup time, sampling time, and post processing time. Setup Time The setup time largely depends on the user settings and reference sources used. Very low noise references tend to have a small tuning sensitivity and bandwidth. -
Page 31: Additive Phase Noise Measurement
Additive Phase Noise Measurement The additive phase noise measurement tab provides single channel or two channel cross-correlation additive phase noise measurements. It supports measurements of active or passive, non self-oscillating devices such as amplifiers in linear and non-linear operation or even frequency-translating devices such as mixers, frequency multipliers or dividers. -
Page 32: Additive Phase Noise Of A Pulsed Signal (With Option Pulse Only)
Additive Phase Noise of a Pulsed Signal (with Option PULSE only) To configure the 7000 Series for additive pulse modulated signals, activate the pulse option in signal detection. The signal is automatically detected, and duty cycle and pulse repetition frequency are shown (see Figure 12). -
Page 33: Amplitude Noise Measurement
The measurement procedure is identical to unmodulated signals. For the pulsed signals, the beat signal will be a flat line when this is achieved. Amplitude Noise Measurement From an interface standpoint, the amplitude measurement tab is equal to the absolute phase noise tab (see section 0). -
Page 34: Measurement Procedure
Figure 14 Absolute phase noise (high drift) or a frequency modulated signal (110 kHz modulation frequency, 100 kHz deviation). Measurement Procedure Connect your signal source to the RF input port of the DUT section on the front panel of the instrument. Choose the frequency offset range and number of averages and correlations. -
Page 35: Measurement Procedure
Measurement Procedure Connect your signal generator to the DUT input connector of the 7000 Series. Choose the parameters to be measured by activating the corresponding check boxes on the right side of the GUI. -
Page 36: Fft Analyzer Measurement
WB frequency, NB frequency or external. This will visually show the trigger configuration in the plot (in green). The external trigger port is located at the rear panel of the 7000 Series and is marked EXT TRIG. The trigger level is 1 V +/- 0.1 V. - Page 37 Select either “Single Channel” or “Two channel cross-correlated” measurement. Press the Measure button to run the measurement. Figure 17 FFT analyzer mode Berkeley Nucleonics Corporation info@berkeleynucleonics.com | www.berkeleynucleonics.com V3.0 2955 Kerner Blvd, San Rafael, CA 94901 | 800-234-7858...
-
Page 38: Time Stability
Time Stability The Time Stability mode provides the ability to measure the long-term stability of a CW signal. It measures frequency versus time for long time periods (10 seconds to multiple days) and can derive Allan deviation from the measurement. After starting the measurement, the instrument starts to gather data. After a couple of seconds, the first measurement is shown. -
Page 39: Vco Characterization
Figure 19 Time stability mode An external 10 MHz reference can be used to improve absolute accuracy and noise floor. VCO Characterization The VCO characterization tab provides the ability to fully characterize a voltage-controlled oscillator (VCO or VCXO), including Kvco, current draw, power output, pushing and spot phase noise over a specified control voltage range. -
Page 40: Measurement Procedure
Measurement Procedure Connect the VCO to the 7000 Series. Use the DC SUPPLY 1 port on the rear panel of the 7000 Series as supply voltage, the DUT TUNE port on the front panel of the 7000 Series as control voltage and connect the RF output of the VCO to the DUT RF IN port of the 7000 Series. - Page 41 Remotely Programming the 7000 Series The 7000 Series can be remote controlled via three independents, but functionally equivalent interfaces: USBTMC, LAN, and (optionally) GPIB. Access via LAN The signal analyzer can be remotely programmed via a 10/100/1000Base-T LAN interface and LAN-connected computer using one of several LAN interface protocols.
- Page 42 The GPIB interface operates with IEEE488.2 and SCPI. The instrument can be controlled by a GPIB external controller. When controlling the 7000 Series using GPIB commands from the external controller connected to the GPIB connector, the talker/listener GPIB address of the 7000 Series requires setting. The default GPIB address of the 7000 Series is 1.
- Page 43 Maintenance and Warranty Information Adjustments and Calibration To maintain optimum measurement performance, the instrument should be calibrated every 24 months. It is Berkeley Nucleonics recommended that the instrument be returned to or to an authorized calibration facility. For more information please contact our Customer Service Department as indicated on www.BerkeleyNucleonics.com.
Need help?
Do you have a question about the 7000 Series and is the answer not in the manual?
Questions and answers