Table of Contents
Advertisement
Quick Links
Advertisement
Table of Contents

Subscribe to Our Youtube Channel
Related Manuals for Bruker M1 MISTRAL

Summary of Contents for Bruker M1 MISTRAL
- Page 1 MISTRAL Micro-XRF Benchtop Spectrometer User Manual...
- Page 2 Suggestions for improvement are welcome. Order no. DOC-M81-EXX024. Issue: 07/07/15 © 2015 Bruker Nano GmbH, Berlin. All trademarks and registered trademarks are the sole property of their respective owners. Printed in the Federal Republic of Germany.
-
Page 3: Table Of Contents
4 The M1 ORA/MISTRAL System ....................28 Product Description ..................... 28 Product Versions ......................28 4.2.1 M1 ORA ......................28 4.2.2 M1 MISTRAL ....................29 Hardware System Components ................... 30 Technical Parameters ....................31 Hardware Installation ....................33 4.5.1 Room Planning ..................... 33 4.5.2 Electrical Connection .................. - Page 4 Contents System Spectra Measurements .................. 54 5.4.1 Measuring Reference Spectra ..............54 5.4.2 Measuring Pure Element Spectra ..............55 5.4.3 Measuring Primary Spectra ................. 56 5.4.4 Measuring Standard Spectra ............... 57 Sample Measurement ....................59 5.5.1 Measurement Methods ................61 5.5.2 Keyboard Shortcuts ..................
- Page 5 Typical XRF spectra of glass, precious metal alloy and steel ......... 24 Fig. 8 M1 ORA with computer ................... 29 Fig. 9 M1 MISTRAL with computer ..................29 Fig. 10 Main components of the M1 ORA/MISTRAL ............30 Fig. 11 Room planning for the installation of the M1 ORA/MISTRAL .........
- Page 6 Table of Figures Fig. 58 List of files needed to save a list of standards ............78 Fig. 59 Basic data editor ...................... 79 Fig. 60 Sample editor ......................79 Fig. 61 Methods workspace ....................81 Fig. 62 Method editor – Structure tab .................. 82 Fig.
- Page 7 List of Tables List of Tables Table 1 Safety equipment of the M1 ORA/MISTRAL ............15 Table 2 Name plates and warning labels on the M1 ORA/MISTRAL instrument ....17 Table 3 Steps during spectrum evaluation ................25 Table 4 Connections of the M1 ORA/MISTRAL system components ........
-
Page 9: Introduction
A solid understanding of these instructions is mandatory for the operation of the M1 ORA/MISTRAL instrument by Bruker Nano GmbH. Please, familiarize yourself with the contents and follow the safety instructions, particularly those regarding the handling of the product. This way you can be sure of taking full advantage of the product’s capabilities. -
Page 10: Intended Usage
Information on protecting the environment. Intended Usage The X-ray spectrometers M1 ORA/MISTRAL by Bruker Nano GmbH may solely be used for material analysis, in particular for the determination of element composition of materials as well as analysis of layered sample systems with respect to thickness determination and layer composition. -
Page 11: Warranty And Liability
The general conditions of sale and supply devote to the operator of the M1 ORA/MISTRAL instruments upon delivery by Bruker Nano GmbH. Warranty and liability claims for personnel and material damage are excluded if they are a result of any of the following reasons: ... -
Page 12: Safety Instructions
Safety Instructions 2 Safety Instructions X-ray energy levels (up to 50 keV) of the excitation beam as used for excitation in the M1 ORA/MISTRAL cause damage to tissue and bone if exposed to it directly. As a result, poorly healing wounds and, in extreme cases, loss of individual limbs (e.g. fingers) could occur. Other than radiation damages caused by an accidental exposure to high dosages of radiation over short time, so-called nondeterministic damages, such as increased risk of cancer, can be a result of exposure to lower radiation doses over a prolonged period of time. -
Page 13: Safety Requirements On The Place Of Installation
Safety Instructions Safety Requirements on the Place of Installation Caution! The M1 ORA/MISTRAL spectrometers weigh 24 kg, respectively 46 kg. Dropping the instrument can cause injuries or lead to damage of the device and subsequent failure. The following safety measures must be observed when installing the instrument: ... -
Page 14: Protection From Electric Current
Safety Instructions The following basic safety rules must be observed at any time: It is strictly prohibited to modify or remove parts of the system housing or to open the instrument. It is prohibited to operate the instrument when parts of the housing or other components of the instrument appear to be seriously damaged (e.g. -
Page 15: Staff Requirements
Safety Instructions Staff Requirements The following requirements are made relating to the operating staff of the M1 ORA/MISTRAL: In case of fatigue as well as under the influence of alcohol or drugs operating the instrument is not allowed. The operating staff must not have any physical or emotional restrictions that impair the attention or judgment either temporarily or permanently. -
Page 16: Fig. 1 Safety Equipment On The Front Panel Of The M1 Ora/Mistral
Safety equipment on the front panel of the M1 ORA/MISTRAL The key switch (1) for the M1 MISTRAL is located on the front panel and for the M1 ORA it can be found at the back side close to the mains power supply connector. The safety equipment parts 2, 3, and 4 are located on the front panel of the instrument (see Fig. -
Page 17: Name Plates And Warning Labels
Safety Instructions 2.7 Name Plates and Warning Labels Table 2 Name plates and warning labels on the M1 ORA/MISTRAL instrument Element Location Function Front panel Company logo Front panel Product name Rear panel Name plate of the instrument Rear panel Warning label of the X-ray source and the HV generator M1 ORA/MISTRAL... -
Page 18: Functional Principles
Functional Principles 3 Functional Principles This section offers a short overview over the basic physics of Micro-XRF and the functional principles of some of the components of the M1 ORA/MISTRAL. 3.1 Physical Background of X-ray Generation In the electromagnetic spectrum X-radiation is found between the ultraviolet regime and γ-radiation. Even though there is no clear threshold between these spectral ranges, usually X-rays are assigned the regime from 10 nm to 0.01 nm. -
Page 19: Bremsstrahlung
Functional Principles Characteristics of X-ray fluorescence include: Electrons that change between two orbits can do so only by absorbing or emitting specified quanta of energy which correspond to the binding energy difference between the two shells. Every single kind of atom, i.e. each individual element, has its own set of allowed radii of electron orbits. -
Page 20: Detection Of X-Ray Quanta
Functional Principles In the X-ray tube, where fast moving electrons are used to produce the continuous excitation spectrum for the measurements, some electrons will by collision transfer energy to inner shell electrons bound to the target material atoms and ionize the atom. Subsequently a relaxation process will take place that leads to the emission of characteristic X-rays, as described above. -
Page 21: Digitalization And Channel Allocation
Functional Principles Fig. 3 Schematic working principle of a silicon drift detector (SDD) 3.3 Digitalization and Channel Allocation In order to enable software based element identification and quantitative analysis, the measured electronic pulses which are a measure for the energies of the detected photons have to be translated into a digital spectrum (see Fig. -
Page 22: Spectrometer Resolution
Functional Principles Fig. 4 Origin of a X-ray fluorescence spectrum X-ray spectra are accumulated over time. The detection of X-ray quanta is an integration process which is subject to statistical fluctuations and cannot be compared to the instantaneous measurement of a current or a voltage. The quality of a spectrum and hence the reliability of the analytic results considerably depend on the X-ray fluorescence intensity and the duration of the accumulation process. -
Page 23: Fig. 5 Fitting Process With Two Gaussian Shaped Profiles
Functional Principles The lines which are displayed in the recorded X-ray spectrum, however, are significantly broader. This broadening is to large extent caused by statistical effects in the detection process of the X-ray quanta and the subsequent signal processing. Therefore it is above all dependent on the used detector (PC or solid state detector) and secondly on the design and quality of the signal processing electronics. -
Page 24: Composition Of A Spectrum
Functional Principles Fig. 6 Definition of the full width at half maximum (FWHM) 3.5 Composition of a Spectrum Typical XRF spectra of different sample types are shown in Fig. 7. The inset depicts the same spectra but with a square root y-scale to emphasize the background. Fig. -
Page 25: Evaluation Of X-Ray Fluorescence Spectra
Functional Principles The spectra reveal the following features: Abscissa in units of kiloelectronvolts (keV). Ordinate in units counts per seconds (cps). Can be changed to detected pulses. X-ray fluorescence peaks of the main matrix elements of the samples. These include Si and Ca for the glass sample, Cr, Fe, and Ni in the steel and Cu and Au in the precious metal alloy. - Page 26 Functional Principles Procedure Spectrum Element identification Element identification is usually an iterative process where recorded peak positions are compared to the energetic positions of each elements X-ray fluorescence lines as listed in a database. Background correction The spectral background is identified and subtracted from the spectrum for the subsequent evaluation.
- Page 27 Functional Principles Procedure Spectrum Fit quality (Chi is a measure for the quality of the fit Here the difference between the measured channel contents and the fitted peak profile are squared weighted by the statistical significance respective channel. The value for the quality of the fit should be small.
-
Page 28: The M1 Ora/Mistral System
The M1 ORA/MISTRAL System 4 The M1 ORA/MISTRAL System 4.1 Product Description The M1 ORA/MISTRAL is an energy dispersive X-ray fluorescence spectrometer that can be used for the analysis of elements with atomic numbers higher than 17 (Chlorine). The special analytical task is the investigation and analysis of very small, delicate and inhomogeneous jewelry and alloy samples as well as the coating thickness analysis of single and multi-layer coatings. -
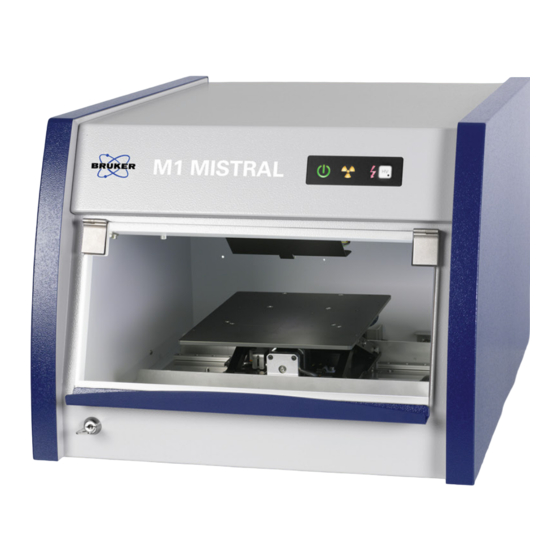
Page 29: M1 Mistral
(depending on element and matrix). 4.2.2 M1 MISTRAL Like the M1 ORA, the M1 MISTRAL can also be equipped with either a PCD or optional with a SDD. The detector dependent energy resolution and the detection limits comply with the values already described in section 4.2.1. -
Page 30: Hardware System Components
The M1 ORA/MISTRAL System 4.3 Hardware System Components The M1 ORA/MISTRAL consists of the following system components (Fig. 10): Spectrometer (M1 ORA or M1 MISTRAL) Control computer Key switch Control panel Control computer Fig. 10 Main components of the M1 ORA/MISTRAL The connections of the M1 ORA/MISTRAL system are listed in Table 4. -
Page 31: Technical Parameters
The most important technical parameters of the M1 ORA/MISTRAL are displayed in Table 5. Table 5 Technical parameters of the M1 ORA/MISTRAL Parameter M1 ORA M1 MISTRAL Instrument cabinet Size (W x D x H) 380 mm x 420 mm x 350 mm 550 mm x 680 mm x 430 mm... - Page 32 The M1 ORA/MISTRAL System Parameter M1 ORA M1 MISTRAL Detector Manufacturer Bruker Nano GmbH Type PCD / SDD Sensitive area 1100 mm / 30 mm Energy resolution 1100 eV / < 150 eV for Mn K Max. count rate 30 000 cps / 100 000 cps...
-
Page 33: Hardware Installation
The M1 ORA/MISTRAL System 4.5 Hardware Installation 4.5.1 Room Planning The instrument must be installed on a load-bearing and vibration-free support. A minimum distance of 20 cm between rear panel of the instrument and the wall is required to ensure free cooling air circulation. -
Page 34: External Requirements
The M1 ORA/MISTRAL System 4.5.3 External Requirements The installation of the M1 ORA/MISTRAL requires several external prerequisites which are listed in Table 7. Table 7 External installation requirements Room / Instrument Requirements Optimal room temperature 22 °C – 28 °C The main components have a temperature compensation that allows the user to work in a wide temperature range. -
Page 35: Program Installation
4.6.2 Program Installation The installation and setup of the software programs XSpect Pro and XData is usually done in- house after assembling at Bruker Nano GmbH. Thus, an instrument which is ready for operation is delivered to the customer. If the instrument is purchased without the computer the customer will be provided with an install file and a factory backup of the instrument for installation. -
Page 36: Fig. 13 Select Setup Language
The M1 ORA/MISTRAL System Fig. 13 Select setup language. If an older version of the software is found on the computer, the type of installation has to be selected (Fig. 14). As indicated in the corresponding dialog, the update option keeps all previous user data accessible while “Remove and install”... -
Page 37: Fig. 15 Select Folder For Installation
The M1 ORA/MISTRAL System Fig. 15 Select folder for installation Define the folder which will contain all data related to the actual work with the instrument, such as calibration spectra, database entries, log-files or methods (Fig. 16). It is recommended to use the default settings. -
Page 38: Fig. 17 Select Components For Installation
The M1 ORA/MISTRAL System Fig. 17 Select components for installation After installing the XSpect Pro and XData components, the installation of additional software packages will be initialized. Those softwares are: The driver for the instrument video camera. This installation only has to be performed during the first time install of the software. -
Page 39: Fig. 19 Installation Of Acrobat Reader
The M1 ORA/MISTRAL System Fig. 19 Installation of Acrobat Reader Fig. 20 Installation of XML Notepad In case of a software update, XSpect Pro and/or XData are now ready for use. If the software is installed for the first time or an older version was de-installed completely prior to the installation, the install wizard will ask for a restart of the computer to finalize the generation of the database structure (Fig. -
Page 40: Installation Of Drivers
To access the driver installation menu start the Windows device manager. If no driver has been previously installed, the M1 ORA/MISTRAL will be listed under “Other devices” as “Bruker AXS MA A-1” (Fig. 22). The other unknown device is the USB camera which needs the exact same driver installation process like described now for the instrument. -
Page 41: Fig. 22 Windows Device Manager After Connecting The M1 Ora/Mistral
The M1 ORA/MISTRAL System Fig. 22 Windows Device manager after connecting the M1 ORA/MISTRAL Right-Click on this entry and choose Properties. In the next dialog go to the tab and choose Driver (Fig. 23). Update Driver… Fig. 23 Properties dialog for the M1 ORA/MISTRAL before installing the correct driver In the next dialog select the option and then choose Locate and install driver software manually... -
Page 42: Fig. 24 Setting The Driver Path Manually For The Unknown Devices
The M1 ORA/MISTRAL System Fig. 24 Setting the driver path manually for the unknown devices If a Windows security warning pops up about an unverified publisher, select the Install this driver option (Fig. 25). software anyway Fig. 25 Windows security warning during driver installation The installation process commences. -
Page 43: Configuration Files
Table 4. Switch on the spectrometer using the key switch on the front panel (M1 MISTRAL) or rear Key switch panel (M1 ORA). The light up of the green POWER lamp on the keypad indicates the correct connection with the mains supply. - Page 44 Bruker. Start the measurement software Start by clicking on the corresponding icon on the desktop or via Start >>...
- Page 45 The M1 ORA/MISTRAL System Step Procedure Figure Select the measurement method A measurement can only be started if a prepared method is loaded from a list of available methods or if the pre-examination option is set. Pre-examination intended quick unbiased overview whereas the measurement method has to be chosen according to the sample and the analytical task.
-
Page 46: Using The Xspect Pro Program
In the next step the software is started either using the desktop icon or starting the software via Start >> Programs >> Bruker >> XSpect Pro. During the start-up of the software the following dialog is displayed. -
Page 47: Fig. 29 Main Screen Of The Xspect Pro Program
Using the XSpect Pro Program Independent of the dialog for switching on the HV a motorized stage will be initialized. In case that the instrument is equipped with multiple collimators, the initialization of the collimator changer motor will be done before the main screen of the software is displayed. The Graphical User Interface of XSpect Pro is divided into three panels (Fig. -
Page 48: Display And Control Elements
Using the XSpect Pro Program 5.2 Display and Control Elements 5.2.1 Instrument Status Bar The instrument status bar shows the current status of the spectrometer and the current measurement conditions. Table 9 compiles the different displays. Table 9 Displays in the instrument status bar Display Description Sample chamber door is closed or open. -
Page 49: Print Report/ Additional Information
Using the XSpect Pro Program Button Description Hints Service functions and system settings Access to XData program (direct start) Load data from disk Save data to disk Copy data or graphic to clipboard Print data or graphic For creating and editing report templates and for input of additional information on the current report and report template section, please refer to section 6.7.1. -
Page 50: Stage Control And Video Settings
Stage control for the manual Z stage 5.3.2 Motorized Z Stage The motorized Z stage is available as standard equipment for the M1 MISTRAL or an optional accessory for the M1 ORA. The sample is manually positioned in the XY plane, whereas the optimal sample height is adjusted via the motorized Auto Focus function. -
Page 51: Motorized X-Y-Z Stage
Using the XSpect Pro Program 5.3.3 Motorized X-Y-Z stage With an motorized X-Y-Z stage the sample can be positioned in all three spatial directions. Display of the sample image in the optical microscope Scroll bars for the stage movement in X, Y, and Z direction ... -
Page 52: Easy Load
Using the XSpect Pro Program Button Description Display of the current stage position in mm calculated from the initial position It is also possible to enter the desired coordinates in the box and confirm with ENTER. The table then moves to that position. Go to given XYZ coordinates as defined in the current stage position box (see line above). -
Page 53: Fig. 35 Video Settings Dialog
Using the XSpect Pro Program Fig. 35 Video settings dialog Note The video settings may negatively affect auto focus capabilities. High contrast and sharpness settings are suggested. Clicking the icon opens the dialog, where the folder and the name of the image file can SAVE be selected to save the video image (Fig. -
Page 54: System Spectra Measurements
Using the XSpect Pro Program 5.4 System Spectra Measurements To access the system spectra workspace, click the button. Fig. 37 Main screen of the System spectra workspace There are four different types of system spectra measurements: Reference spectra: for tracking the long time stability of the instrument ... -
Page 55: Measuring Pure Element Spectra
Using the XSpect Pro Program 3. Put in and align a pure element Ag sample. 4. Start the measurement with 5. After the measurement different parameters are displayed as text (infobox at the bottom) or graph (Tendency tab). Fig. 38 Recording reference spectra After measurement the following information is displayed in the infobox: ... -
Page 56: Measuring Primary Spectra
Using the XSpect Pro Program If your instrument is equipped with a changeable collimator the pure element spectrum can automatically be measured for all collimator sizes by activating the respective radio button. These steps have to be followed to perform a measurement of a pure element spectrum: 1. -
Page 57: Measuring Standard Spectra
Using the XSpect Pro Program 1. Select the tab. Elements 2. Select the measurement parameters (Primary spectra can be recorded for different preset conditions such as tube voltage and current). 3. Choose whether the primary spectrum is to be recorded for all collimators automatically or only for the currently set one. -
Page 58: Fig. 41 Recording Standard Sample Spectra
Using the XSpect Pro Program 1. Select the tab. Standards 2. Select the measurement parameters (for every standard sample spectra can be recorded and stored for different excitation conditions). 3. Choose a standard, which is to be measured, from the list (the standard has to be defined in the XData program prior to the measurement under the preset measurement conditions and marked with a green “Y”. -
Page 59: Sample Measurement
Using the XSpect Pro Program 5.5 Sample Measurement To access the measurement workspace click the button. Fig. 42 Measurement workspace The measurement workspace is subdivided into four tabs: single result presentation showing the result of the last measurement Results: ... - Page 60 Using the XSpect Pro Program Button Description Hints Start/ Stop measurement with selected When a method is selected the software will method or pre-examination automatically perform quantification once the measurement is finished. If the pre-examination option is selected the user has to select the elements in the spectrum tab and start the quantification manually.
-
Page 61: Measurement Methods
Using the XSpect Pro Program Button Description Hints Start/Stop stage program measurement The selected stage program will be executed. For quantification the selected method will be used every position. Measurement conditions, measurement times repetitions have to be defined during stage program setup (see section 5.6). -
Page 62: Keyboard Shortcuts
Using the XSpect Pro Program 5. When the checkbox is selected, result tables and the evaluation method will be Archive data transferred to the archive which is accessible via the XData program. Therefore, all data can be re-evaluated offline. Prior to a measurement the option can be checked. -
Page 63: Fig. 45 Measurement Workspace - Results Tab
Using the XSpect Pro Program Fig. 45 Measurement workspace - Results tab 5.5.4 Table Tab Quantitative results of any repeated measurement or analyses of multiple positions with identical specifications are best viewed in the tab. Here an easy comparison of the results is possible. Table Fig. -
Page 64: Trend Tab
Using the XSpect Pro Program below the table allow showing additional information: Display options display: if the quantified value of any of the individual parameters (layer thickness Pass/Fail and/or concentration) is outside the preset control limits (refer to section 6.4.1) the row and the individual value will be highlighted with a red background. -
Page 65: Spectrum Tab
Using the XSpect Pro Program The left column of the tab shows a tree structure of the sample. Highlighting the name of a Trend layer will display the quantified thickness of this layer while clicking on one of the elements will show the quantified concentration of this element in the layer. -
Page 66: Table 14 Display Options In The Spectrum Tab
Using the XSpect Pro Program Table 14 Display options in the spectrum tab Button Description This icon shows or hides the periodic table. To quickly identify characteristic fluorescence lines of elements check expected element in the periodic table or set the cursor on one peak and use the option. -
Page 67: Touch Screen User Interface
Using the XSpect Pro Program Table 15 Peak identification Dialog Description Display of the line markers in the spectrum The elements must be selected and highlighted. Line markers in the spectrum have the same color as the highlighted elements periodic table. -
Page 68: Fig. 49 Touch Screen User Interface
Using the XSpect Pro Program Fig. 49 Touch screen user interface The instrument status bar of the touch screen GUI only displays HV on/off, shutter open/closed, and the progress of the current measurement. The main working area is divided into the video image on the left and the result display on the right side. -
Page 69: Stage Program Workspace
Using the XSpect Pro Program 5.6 Stage Program Workspace The stage program makes use of the motorized x-y-z-stage of the M1 Mistral allowing for a definition of patterns of measurement positions which then can be measured automatically. A stage program can be defined by the user adapted to the layout of the used sample. By setting reference points an existing stage program can be transferred to another sample of the same layout, even if the new sample is not aligned in exactly the same way as the “master sample”. -
Page 70: Load/Create Stage Programs
Using the XSpect Pro Program Table 17 Main functions in the stage program workspace Button Description Hints Select/ Create/ Edit stage program Access to all existing stage programs and option to create a new program, edit existing ones or delete outdated programs. Start test run of the selected stage The stage will be positioned at all defined program... -
Page 71: Graphic Display Of Measurement Points
Using the XSpect Pro Program 2. To create a new stage program first type in the name of the program and click then the button. The program is then displayed in the list and can be selected and opened with 3. -
Page 72: Measure Points Table
Using the XSpect Pro Program If reference points are set, all measurement points are defined relatively to those positions. This allows to transfer a large list of measurement points to multiple samples even if the samples are shifted or rotated. When a stage program is loaded, move to the first reference point and click the accept ref button. -
Page 73: Fig. 54 Create/Edit A Stage Program
Using the XSpect Pro Program Setup rectangle: Add measurement points in two opposite corners of the rectangle. Mark both points in the measurement positions table using the <Shift> key and mouse. Select in the Rectangle Line/Rectangle dialog and type the number of points in x- and y- direction (including the already existing corner points). -
Page 74: Table 19 Options For Selected Multiple Entries In The Measure Points Table
Using the XSpect Pro Program Button Description Allows for corrections of different sample heights. Using the <Shift> key a group of adjacent entries can be selected. Using the <Ctrl> key non- adjacent entries can be selected. Selecting multiple entries unlocks the options listed in Table 19. Table 19 Options for selected multiple entries in the measure points table Button Description... -
Page 75: Using The Xdata Program
Using the XData Program 6 Using the XData Program 6.1 XData Program Start-up The XData program manages the database behind all XSpect methods, standard samples, and archive data. Specifically the following tasks are supported: Management of standard samples for calibration ... -
Page 76: Fig. 56 Start-Up Screen Of The Xdata Program
Using the XData Program Fig. 56 Start-up screen of the XData program The control buttons in the XData navigation bar are listed and described in Table 20. Table 20 Functions in the navigation bar of XData Button Description Hints Standard samples management Lists all available standards and allows for adding, editing and deleting standard samples. -
Page 77: Managing Standards
Using the XData Program Button Description Hints Data management Access to archived data Load data from disk Save data to disk Copy data or graphic to clipboard Print data or graphic Close the XData program 6.3 Managing Standards Standards are used to increase the precision of a quantification method. A defined and measured standard can be used to calibrate a measurement method as described in section 6.4.1. -
Page 78: Saving A List Of Standards
Using the XData Program A standard is a specific sample with known or even certified properties. Especially two properties are of interest for X-ray fluorescence analysis: the elemental composition within and the thickness of the individual layers of a sample. This data and some additional information can be entered into the database in the standards workspace. -
Page 79: Creating New Standards
Using the XData Program Fig. 59 Basic data editor To create a new , highlight the option in the list. Then type a new name in sub type main type bulk the sub type field and choose the elements which will be present by clicking them on the periodic table. -
Page 80: Managing Methods
Using the XData Program 1. Type in a name in the field and make a choice at every drop down menu sample description in the area on the left hand side of the additional data SAMPLE EDITOR: choose for bulk samples or for samples consisting of main type: bulk... -
Page 81: Creating A Method
Using the XData Program Fig. 61 Methods workspace 6.4.1 Creating a Method Using an adequate measurement/quantification method for the required measurement task improves the accuracy of quantification significantly. In the process of creating a new method it is necessary to define the measurement conditions for the method. -
Page 82: Fig. 62 Method Editor - Structure Tab
Using the XData Program Fig. 62 Method editor – Structure tab 1. Name the method 2. Select type (here standard-based bulk (LT)) 3. Select the spectrum deconvolution mode (use default settings) 4. Define the measurement parameters 5. Define the layout of the samples (here a bulk sample containing Au, Ag and Cu) 6. -
Page 83: Fig. 63 Element Properties Editor
Using the XData Program Fig. 63 Element properties editor The available settings for the selected element are listed in Table 21. Table 21 Settings in the element properties editor Description Hints The default value is normal. A critical element is an element which should not Element type but might be in a sample (e.g. - Page 84 Using the XData Program Description Hints Threshold In order to avoid a false positive identification of an element in a spectrum the software has to be kept from fitting lines into the statistical background fluctuations. Therefore a limit can be set below which an element will be omitted in all subsequent fitting cycles.
-
Page 85: Fig. 64 Method Editor - Normation Tab
Using the XData Program Fig. 64 Method editor – Normation tab 10. Check the availability of pure element spectra: green: already normalized blue: Element not yet normalized but pure element spectrum found in database red: No pure element spectrum found in database for preset measurement conditions. 11. -
Page 86: Fig. 65 Method Editor - Calibration Tab Without Added Standards
Using the XData Program Fig. 65 Method editor – Calibration tab without added standards 12. Load the standards that shall be used for the calibration. Clicking the button opens the dialog (Fig. 65). AVAILABLE SAMPLES Out of all entries in the database only those standards are shown which - based on their structure and element selection - can be used for calibrating the method. -
Page 87: Fig. 67 Method Editor - Calibration Tab With Added Standards Before Calibration
Using the XData Program 14. Save and exit the dialog. AVAILABLE SAMPLES Fig. 67 Method editor – Calibration tab with added standards before calibration 15. Start the calibration process by clicking the button. Fig. 68 Method editor – Calibration tab after calibration M1 ORA/MISTRAL... -
Page 88: Fig. 69 Method Calibration With Several Calibration Ranges
Using the XData Program The quantitative results obtained with the active Lucas-Tooth calibration are plotted against the corresponding values of the standard as predefined during standard sample creation. By highlighting different columns of the table, the displayed data can be selected. The calibration coefficients are displayed in the bottom-left corner. -
Page 89: Fig. 70 Method Calibration Tab With Highlighted Outlier
Using the XData Program Fig. 70 Method calibration tab with highlighted outlier 17. If individual values are far off the red 1:1 line, the following options are available: a) In order to check if it is a problem in the numerical calculation process, repeat the calibration process by clicking (reset calibration data). -
Page 90: Fig. 71 Method Editor - Structure Tab
Using the XData Program 6.4.1.2 Standard-supported Bulk Method (FP) The fundamental parameter (FP) calculation algorithm takes into account the physical properties of every component involved in the measurement. Physical laws that describe the measurement process are transformed into a formula to calculate concentration or thickness values. FP methods can be used in versatile situations and do not necessarily need measured standard samples to apply. -
Page 91: Fig. 72 Element Properties Editor
Using the XData Program 4. Define the measurement parameters 5. Define the layout of the samples (here a bulk sample containing Au, Ag and Cu) 6. If the samples have roughly known concentrations, the start concentration values can be predefined accordingly. 7. -
Page 92: Fig. 73 Method Editor - Normation Tab
Using the XData Program Fig. 73 Method editor – Normation tab 10. Check the availability of pure element spectra: green: already normalized blue: Element not yet normalized but pure element spectrum found in database red: No pure element spectrum found in database for preset measurement conditions. 11. -
Page 93: Fig. 74 Method Editor - Calibration Tab Without Added Standards
Using the XData Program Fig. 74 Method editor – Calibration tab without added standards 12. Load the standards that shall be used for the calibration. Clicking the button opens the dialog (Fig. 75). AVAILABLE SAMPLES Out of all entries in the database only those standards are shown which - based on their structure and element selection - can be used for calibrating the method. -
Page 94: Fig. 76 Method Editor - Calibration Tab With Added Standards Before Fp Calculation
Using the XData Program Fig. 76 Method editor – Calibration tab with added standards before FP calculation 15. Click the button to perform a FP calculation for all selected standards. The calculated FP values will be plotted against the given values of the selected standards. The displayed data can be selected by highlighting different columns of the table. -
Page 95: Fig. 78 Method Editor - Calibration Tab After First Calibration
Using the XData Program 16. Start the calibration process by clicking the button. After the calibration is processed, the chart will be updated showing the calibrated results. The calibration coefficients are displayed in the bottom-left corner. The results should be much closer to the red line than before the calculation. -
Page 96: Fig. 79 Method Editor - Structure Tab
Using the XData Program 18. Save the method by clicking and exit the METHOD EDITOR. Note If you edit an already existing calibrated method and make some changes in the basic structure or in the normation, you need to renew the calibration as well. -
Page 97: Fig. 80 Element Properties Editor
Using the XData Program 6. Define the elements which are expected in the individual layers by highlighting the layer (indicated by a red frame) and then add the respective elements by clicking in the periodic table (here Zn and Ni in the coating and Fe in the base) 7. -
Page 98: Fig. 81 Method Editor - Normation Tab
Using the XData Program Proceed to the tab. Normation Fig. 81 Method editor – Normation tab 12. Check the availability of pure element spectra: green: already normalized blue: Element not yet normalized but pure element spectrum found in database ... -
Page 99: Fig. 82 Method Editor - Calibration Tab Without Added Standards
Using the XData Program Fig. 82 Method editor – Calibration tab without added standards 14. Load the standards that shall be used for the calibration. Clicking the button opens the dialog (Fig. 83). AVAILABLE SAMPLES Out of all entries in the database only those standards are shown which - based on their structure and element selection - can be used for calibrating the method. -
Page 100: Fig. 84 Method Editor - Calibration Tab With Added Standards Before Fp Calculation
Using the XData Program 16. Save and exit the dialog. AVAILABLE SAMPLES Fig. 84 Method editor – Calibration tab with added standards before FP calculation 17. Click the button to perform FP calculation for all selected standards. The calculated FP values will be plotted against the given values of the selected standards. The displayed data can be selected by highlighting different columns of the table. -
Page 101: Fig. 85 Method Editor - Calibration Tab After Fp Calculation, But Before Calibration
Using the XData Program Fig. 85 Method editor – Calibration tab after FP calculation, but before calibration 18. Click the button to start calibration process. After the calibration is processed, the chart will be updated with the calibrated results. The calibration coefficients are displayed in the bottom-left corner. -
Page 102: Fig. 86 Method Editor - Calibration Tab After First Calibration
Using the XData Program Fig. 86 Method editor – Calibration tab after first calibration 19. If individual values are far off the red 1:1 line, the following options are available: a) In order to check if it is a problem in the numerical calculation process, repeat the calibration process by clicking (reset calibration data). -
Page 103: Managing System Spectra
Using the XData Program Note If you edit an already existing calibrated method and make some changes at the basic structure or at the normation, you need to renew the calibration as well. In this case click first, and then perform a new calibration. 6.5 Managing System Spectra The spectra workspace can be accessed by clicking the button in the navigation bar. -
Page 104: Adding Spectra To The Database
Using the XData Program 6.5.1 Adding Spectra to the Database 1. Click the load data button and select all the spectra you want to add to the database. Then the spectra are displayed in the spectrum chart and listed in the corresponding table below the spectrum chart. -
Page 105: System Settings
Using the XData Program 6.6 System Settings The system workspace can be accessed by clicking the button in the navigation bar. In this workspace the initial hardware setup is performed. After the initial setup the system settings are only displayed and cannot be modified by the user. 6.7 Managing the Database The data workspace can be launched by clicking the button in the navigation bar. -
Page 106: Fig. 90 Report Editor
Using the XData Program Fig. 90 Report editor Use the icon in the editor to import data (images, spectra, text). Report Use the options to set the display. Zoom in by clicking the icon and dragging with the Zoom mouse over the range to be displayed. Zoom out to full page by clicking the icon. -
Page 107: Integrity
Using the XData Program To move an object highlight it by clicking into it and then drag it while holding the mouse key. To scale an object it has to be selected and then be dragged by using one of the displayed seizing handles. -
Page 108: Fig. 91 Data Processing - Selection Tab
Using the XData Program Fig. 91 Data processing – Selection tab There are three different types to browse data: Selection method, By stage program customer. The corresponding dropdown menu in the center lists all datasets for which archived data exists. If a method is selected, all jobs with archived data are displayed in the table (Fig. 91). To display the results select one job by clicking and highlighting the respective row in the Selection table. -
Page 109: Fig. 92 Data Processing - Results Tab
Using the XData Program Fig. 92 Data processing – Results tab M1 ORA/MISTRAL... -
Page 110: Shutdown
Shutdown 7 Shutdown 7.1 Switching off the Instrument The instrument should be switched off for transport, for service purposes and when it is not used for a longer period of time. Procedure for switching the instrument off: 1. Stop the measurement 2. -
Page 111: Maintenance Of The M1 Ora/Mistral
Replace the fuses and reinsert the fuse holder Plug back the mains plug into the mains socket If the fuses blow again upon replacement, the instrument must be disconnected from the mains supply and the service of Bruker Nano GmbH should be informed. M1 ORA/MISTRAL... -
Page 112: Cleaning The Sample Chamber
Maintenance of the M1 ORA/MISTRAL 8.2 Cleaning the Sample Chamber The sample chamber should always be kept clean because contamination can influence the analytical result. For cleaning, it is recommended to use a soft tissue or exhaust in case of stronger contamination. -
Page 113: Transportation
Risk of injury by dropping or lifting the spectrometer. The M1 ORA weighs 24 kg and the M1 MISTRAL weighs 52 kg. Whether it is packed or not, the device should be lifted and carried with the help of two people. -
Page 114: Disposal
The components X-ray tube and detector contain the toxic substance Beryllium and, thus, are taken back by the manufacturer. In case of disposal, please send the X-ray tube and the detector to the following address: Bruker Nano GmbH Am Studio 2D 12489 Berlin... -
Page 115: A Standard Delivery Contents
A Standard Delivery Contents Table 23 Standard delivery contents of the M1 ORA/ MISTRAL Amount Component/ Parts M1 ORA / M1 MISTRAL Control computer, Windows 7, control software programs XSpect Pro and XData Mouse Serial connection cable Power connection cable... -
Page 116: B General Safety Precautions
If you suspect that the safety system does not work correctly or that radiation protection is impaired for any reason, immediately switch off the system and contact your local Bruker Service Representative. Manipulations and modifications of the safety systems are strictly forbidden! -
Page 117: C Biological Effects Of X-Ray Radiation
Biological Effects of X-ray Radiation C Biological Effects of X-ray Radiation (Extract from www.princeton.edu/main/) Mechanisms of damage Injury to living tissue results from the transfer of energy to atoms and molecules in the cellular structure. Ionizing radiation causes atoms and molecules to become ionized or excited. These excitations and ionizations can: ... - Page 118 Biological Effects of X-ray Radiation Delayed effects: effects such as cancer induction that may appear months or years after a radiation exposure. Delayed effects of radiation exposure Cancer Studies of people exposed to high doses of radiation have shown that there is a risk of cancer induction associated with high doses.
-
Page 119: Index
Index Index Auto ID ............67 XData ............35 Background correction ....... 26 XSpect Pro ..........35 Beam shutter ..........16 Instrument status bar ......... 48 Beryllium ........... 114 Integrity ............. 107 Bremsstrahlung .......... 19 Intended usage .......... 10 Channel allocation ........21 Key switch .......... - Page 120 Index Product versions ......... 28 Workspace ..........69 Pure element spectra ........55 Stage program workspace ......69 Radiation protection ........13 Standard delivery contents ....... 115 Reference Standard spectra ........57 Points ............71 Standards ........... 77 Spectra ............ 54 Load ............
- Page 121 Index Control elements ........48 X-Y-Z stage ..........51 Display elements ........48 Z stage Installation ..........35 Manual ............ 50 Start-up ........... 46 Motorized ..........50 Using the program ........46 M1 ORA/MISTRAL...
Need help?
Do you have a question about the M1 MISTRAL and is the answer not in the manual?
Questions and answers