Table of Contents
Advertisement
Quick Links
Advertisement
Table of Contents

Related Manuals for Spotsee ShockLog Series

Summary of Contents for Spotsee ShockLog Series
- Page 1 USER MANUAL...
-
Page 2: Table Of Contents
USER MANUAL CONTENTS INTRODUCTION ........................7 Product Overview ............................7 ShockLog 298 ..............................8 ShockLog 248 ..............................9 OVERVIEW OF ACCESSORIES/OPTIONS ................10 ShockLog Accessory Kit ...........................10 ShockLog Cellular Communication Module ..................10 ShockLog Satellite Communication Module ..................10 ShockLog H/T Sensor ..........................11 HPT (Humidity Pressure Temperature) Sensor..................11 ShockLog 298 Tilt and Roll ........................ - Page 3 USER MANUAL Slots ................................27 Slot Contents ................................27 Slot Interval ................................28 Summary Interval ..............................28 Journey Duration Option for Slot & Summary Intervals ................28 Events ................................29 Record ..................................29 Length ..................................29 Max Time ..................................30 Ordered Data ................................30 Thresholds .................................
- Page 4 USER MANUAL Slot Graph Selection ............................... 48 Event Data Graphs ..............................49 Event Summary Graph ............................49 Detailed Event Curve .............................. 50 Drag ‘n’ Zoom ................................50 Settings ................................51 Slots ................................52 Select Slots ................................54 Tilt & Roll ..................................55 Drag ‘n’...
- Page 5 USER MANUAL Read ................................77 Passwords ..............................78 iButton Passwords ............................78 ShockLog Passwords ..........................79 Program .................................79 Setup Passwords ............................80 SECURITY LOG ......................... 81 MULTIPLE FILE EXPORT ......................82 DATABASE MANIPULATION ....................82 Explorer Window............................82 Records Table ...............................83 Column Data ................................83 File Sorting ................................
- Page 6 IMPORT OF LEGACY DATA FILES ..................95 APPENDIX ..........................96 APPENDIX A - SHOCKLOG SATELLITE ................. 97 APPENDIX B - SHOCKLOG CELLULAR ................102 APPENDIX C - SPOTSEE PLATFORM ................... 106 This document is written and published by ShockWatch, Inc. All rights reserved.
-
Page 7: Introduction
USER MANUAL INTRODUCTION Welcome to the ShockLog product family. The manual has been ® designed to provide useful information to all levels of users from new users to those expert users of the legacy ShockLog products. The ShockLog User Manual has been written to address the full range of ShockLog products. -
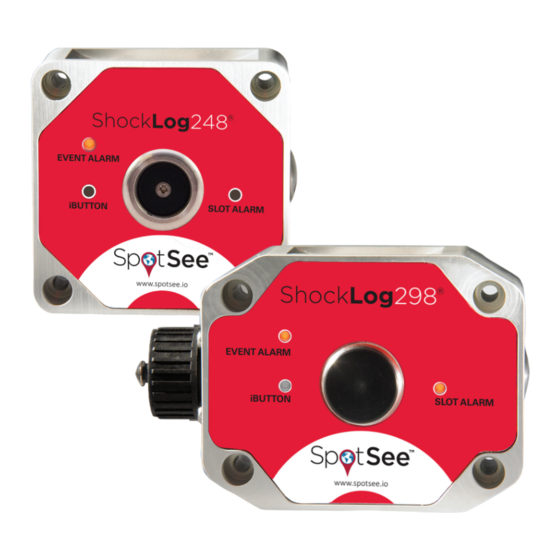
Page 8: Shocklog 298
USER MANUAL SHOCKLOG 298 The ShockLog 298 combines advanced tri-axial piezoelectric accelerometer technology, the latest electronic technology, software and optional connectivity modules into a world class shock and vibration recorder. The ShockLog 298 monitors shock and vibration based on acceleration or velocity measurements. The wake up, warning and alarm levels, frequency of data collection, setting of the acceleration or velocity range and cut-off frequency of the filter are programmed by the user. -
Page 9: Shocklog 248
USER MANUAL SHOCKLOG 248 The ShockLog 248 combines advanced tri-axial piezoelectric accelerometer technology, the latest electronic technology and software into an advanced shock and vibration recorder. The ShockLog 248 monitors shock based on acceleration measurements. The software allows the wake up, alarm levels and frequency of data collection to be programmed by the user. -
Page 10: Overview Of Accessories/Options
The ShockLog Cellular Communication Module delivers real-time notifications of unacceptable handling in the supply chain. Alarm and location summary are transmitted via the global cellular network to the SpotSee Cloud where the information is accessible from anywhere in the world. -
Page 11: Shocklog H/T Sensor
USER MANUAL SHOCKLOG H/T SENSOR The HT sensor measures humidity and temperature. It enables any version of the ShockLog 298 or 248 to monitor an extended range of environmental factors. HPT (HUMIDITY PRESSURE TEMPERATURE) SENSOR The HPT sensor measures humidity, pressure and temperature. It enables any version of the ShockLog 298 to monitor an extended range of environmental factors. -
Page 12: Getting Started
USER MANUAL GETTING STARTED The ShockLog manual applies to ShockLog software version 10.2.4.1 or greater and is to be used in conjunction with all ShockLog units (298 and 248 products). It also applies to most legacy ShockLog ranges including the RD298 ShockLog (embedded code version 103 or higher) and RD317 Micro ShockLog units (embedded code version 103 or higher). -
Page 13: Shocklog Software Installation
USER MANUAL SHOCKLOG SOFTWARE INSTALLATION To get started with the ShockLog, the first step is to install the software. Please note that many IT systems prevent individual users from installing software on their machines or users may have restricted rights. Therefore, it is essential that you consult your IT Department to ensure you have sufficient rights to install the software. - Page 14 USER MANUAL The Microsoft Access database engine installation wizard will run next. Click “Next” to continue. Accept the Microsoft Access End - User License Agreement terms. The Access database location is set up next. Click “Install” to continue. Click “OK” to complete the setup of the Access Database. Microsoft.net framework will install next.
- Page 15 USER MANUAL Next, another ShockLog Setup window will prompt the user for the product options to install. Verify that both “Create a shortcut for this program on the desktop” and “Install Software Update Utility” are checked. Click “Next” to continue. Users can select the location of the software installation.
- Page 16 USER MANUAL The system will begin the installation of the ShockLog software. At this stage a number of progress bar windows will appear. A Microsoft software installation warning stating that the software has not been verified for compatibility to Windows XP will appear. Click on the “Continue anyway” button. The same window will appear a second time. Click on the ‘Continue anyway’...
-
Page 17: Automatic Check For Updates
USER MANUAL A window with a Microsoft software installation warning stating that the software has not been verified for compatibility to Windows XP will appear. Click “Continue anyway”. The appropriate drivers now will be loaded on the PC and will allow the ShockLog device to communicate with the ShockLog Software. -
Page 18: Installing The Batteries
If this corrosion occurs, the ShockLog will not function correctly, and the unit will need to be returned to SpotSee for repair. This document is written and published by ShockWatch, Inc. All rights reserved. -
Page 19: Shocklog Mounting Recommendations
USER MANUAL SHOCKLOG MOUNTING RECOMMENDATIONS Mounting Orientation The ShockLog axes are indicated on the side of the unit. Mount the ShockLog either vertically or horizontally and note the orientation. Variation from the orientation of the ShockLog should be noted in order to assist with data analysis at the end of the journey. Securing the ShockLog Whenever possible, it is recommended you mount the ShockLog directly to the product being monitored. - Page 20 USER MANUAL Avoid building special brackets to mount the ShockLog. If a cover is required, place the cover over the ShockLog but do not attach it to the ShockLog. When mounting inside packaging or crates, make sure the product is secured by foam or mounting screws to ensure the unit records accurate impacts during shipment.
-
Page 21: Opening The Software & Initial Layout Setup
USER MANUAL OPENING THE SOFTWARE & INITIAL LAYOUT SETUP The ShockLog user interface has a variety of “dockable” windows that allow the user to view information of interest. These windows make it easy for users to move around in the journey data files. To get started the software can either be opened by double clicking the ShockLog shortcut icon or by selecting the ShockLog program from the Start menu. - Page 22 USER MANUAL When the dockable windows are in the desired locations, adjust the size of each window by dragging the border of each window. Adjust the window size in order to maximize the available screen area for the File Viewer. Windows can be moved and adjusted at any time.
-
Page 23: Creating A Setup File
USER MANUAL CREATING A SETUP FILE SELECT MODEL OR FILE To create or modify a setup file, go to the “View” menu at the top of the screen and select “Setup.” A new window will appear listing the available ShockLog models. The user will select a ShockLog model and create a setup file or open and modify an existing file that has been created in the past. -
Page 24: Firmware Options
USER MANUAL FIRMWARE OPTIONS The first tab in the Setup screen is “Firmware Options.” This section defines what factory or peripheral accessories are being used with the selected ShockLog. If the options are grayed out and selected, they are default options and cannot be changed. -
Page 25: Peripherals
Click the box for any options that will be utilized with the ShockLog, then click “Continue.” RD401 These settings are available for a customized legacy solution from SpotSee. They are not supported by the ShockLog 298 or 248. IBUTTON PASSWORD Users are able to create password protection in the iButton system. -
Page 26: Settings
USER MANUAL SETTINGS The Settings window allows the user to select the protocol, create setup name, enter mission comment and set start date. PROTOCOL Protocol 400 is the appropriate setting unless the RF module is installed and being used. If the ShockLog has an RF module installed, P400 and ZigBee should automatically set. -
Page 27: Start Date
USER MANUAL START DATE If the user would like the ShockLog unit to begin monitoring at a future date/time, click on the right-hand arrow to bring up a calendar selector and select the desired date. If the unit should start recording at a specific time, it is possible to set the start time as required. -
Page 28: Slot Interval
USER MANUAL TIP: Selecting additional parameters will decrease the amount of time in which data can be recorded. Only select parameters that are of interest in order to maximize recording time available. SLOT INTERVAL The Slot Interval defines the how often a time slot will be recorded. The window below the Slot Interval setting will show how long the maximum number of slots and run time based on the setting. -
Page 29: Events
USER MANUAL EVENTS Impacts above the user defined threshold are defined as events. The Events section allows the user to define the criteria to be considered when recording a potentially damaging event. RECORD This section allows users to specify the resolution / memory to be allocated to each event. From the resolution and memory setting, the number of recorded events is calculated by the software. -
Page 30: Max Time
USER MANUAL MAX TIME Max time is the length of any recorded event. All events are recorded for at least 1 second. The longer the event, the more the data will be compressed. In certain situations, it may be desirable for the ShockLog to record the full length of an event (potentially up to 128 seconds). -
Page 31: Understanding Threshold Levels
USER MANUAL to high levels of resonance. These resonances will create a “bell-like” ring that a ShockLog can detect as a high g event if the appropriate filters are not applied. Filters are recommended in environments where a high frequency vibration is probable such as rail freight applications. - Page 32 If you are unsure of how to set your thresholds, please contact SpotSee Technical Support for assistance. This document is written and published by ShockWatch, Inc. All rights reserved.
-
Page 33: Slot Alarms
USER MANUAL SLOT ALARMS The Slot Alarms window allows the user to specify alarm settings depending on the factory options and peripherals that have been specified in the Firmware Options tab. GRMS (VIBRATION) gRMS alarms allow ShockLog 298 users to set slot alarms for gRMS data. In the setup window, users must select the gRMS option (Firmware Options) for this measurement to be available. -
Page 34: T&R Alarms
USER MANUAL T&R ALARMS The T&R Alarm window is used when either the Tilt & Roll option (internal) has been purchased as part of the ShockLog 298 or the legacy Tilt & Roll accelerometer (external) is being used. The alarms of interest should be enabled, and the degree of tilt / roll should be entered by the user. -
Page 35: Saving Setup File
USER MANUAL SAVING SETUP FILE After a setup has been defined, it must be saved before it can be sent to a ShockLog. Click the disk save icon to save the file. The system will automatically save the file in the default setup directory and can be retrieved for editing or sending to a ShockLog at any time. -
Page 36: Start Monitoring
USER MANUAL START MONITORING Once the ShockLog has been programmed, the unit must be started to begin recording. It is recommended that the ShockLog be mounted prior to starting the recording to prevent the capture of impacts resulting from the mounting process. -
Page 37: Stopping The Shocklog Satellite
USER MANUAL 3. Event Alarm • Tri-color LED (green, amber & red) • Flashes every ten (10) seconds when in Waiting State, or every five (5) seconds when in Running State • Condition • No events - Flashes green • Warning event(s) recorded (with no Alarm events) - Flashes amber •... -
Page 38: Downloading The Shocklog
USER MANUAL DOWNLOADING THE SHOCKLOG Two methods are available for downloading the ShockLog: connection through a USB port or through an RF connection (ShockLog 298 only). USB COMMUNICATION Open the Communications Window and connect a ShockLog through the USB to the PC. The ShockLog USB port is on the side of the ShockLog under a silver screw connector. -
Page 39: Rf Communications
USER MANUAL Setup Passwords and Security Log can be activated from the View menu at the top of the screen. Once activated the buttons enable users to setup passwords and view the security log of the attached ShockLog. These capabilities are described in more detail later in this manual. RF COMMUNICATIONS RADIO DOCKABLE WINDOW To enable the ShockLog software to communicate with the RF Base unit, a special “Radio”... - Page 40 USER MANUAL A summary of information will be visible in the Radio window – number of slot alarms, event alarms and warnings, date and time as well as an indication of signal strength. The number of alarms includes the total number of alarms experienced during the measurement period.
-
Page 41: Overview Of Software Screens
USER MANUAL OVERVIEW OF SOFTWARE SCREENS FILE VIEWER WINDOW The File Viewer Window is the main section of the software window and displays all of the information related to the selected file. REPORT In the File Viewer, the Report View is the first screen displayed. -
Page 42: Event Table
USER MANUAL From this screen, users have the ability to sort the database by the columns of data. This feature will be discussed in more detail in the Analyzing the ShockLog Data section of the manual. EVENT TABLE When a file with “Events” is selected, the “Event Table” will refresh to display details of all the events associated with the highlighted data file. -
Page 43: Communications Window
USER MANUAL COMMUNICATIONS WINDOW The Communications Window displays live data from a connected ShockLog. It allows a user to perform tasks while connected to the ShockLog. Information displayed in the Communications Window includes: Model of the ShockLog connected, Serial Number (not available on legacy products), Version of firmware, State (running or stopped), Connection (USB or Serial), Date/Time, Range (impact scale), Status (alerts if memory is full), Alarms (number recorded) and Protocol of the attached ShockLog. -
Page 44: Slot Breaks Grid
USER MANUAL SLOT BREAKS GRID The Slot Breaks table displays a list of breaks in the Time Slot data. These breaks can include all communication with an iButton, the first slot record or could relate to alarm resets from a Remote Monitoring System. The list will be shown in date/time order and will indicate what slot had a break in it and what the break event was. -
Page 45: Analyzing The Shocklog Data
USER MANUAL ANALYZING THE SHOCKLOG DATA REPORT When a file is opened, the Report View is displayed. The report provides an overview of the entire file (journey / storage period experiment), providing information in both text and graphical formats. The text data is broken down into two separate tables providing the following data: DATA FILE SUMMARY The file summary provides an overview of the ShockLog that was... -
Page 46: Summary Of Events
USER MANUAL Report Start: Beginning date of the report. If the report has been adjusted to display only a section of the data file, this field provides the starting point. Data viewed on the Report page will begin with the Report Start Date. Report End: Date the data on the report ends. -
Page 47: Slot Graph
USER MANUAL the full data set; it only allows the report to focus on the areas of interest. This information can be found in the trip summary section of the Report. At the top right-hand corner of the File View window, just below the tabs, there are two drop down windows with dates. -
Page 48: Slot Graph Selection
USER MANUAL SLOT GRAPH SELECTION When a data file is first opened, the report tab will display four time slot graphs, usually X, Y & Z acceleration and Internal Temperature. These values will vary depending on what was selected for the recorded period. To view any of the alternative channels of information recorded during this file, the user can change the display selection. -
Page 49: Event Data Graphs
USER MANUAL EVENT DATA GRAPHS The right side of the Report Tab contains information about the event data recorded. This section will appear blank when viewing a file where no event has been recorded. The data is split into two different graphs: Event Summary and Detailed Event Curve. EVENT SUMMARY GRAPH This bar chart graph shows the modulus value of all events recorded within the data file and highlights the most severe event by displaying it in red. -
Page 50: Detailed Event Curve
USER MANUAL DETAILED EVENT CURVE The event curve displays the detailed data curve for a given event. It will display the most severe event when the report is first opened. Different events are displayed by clicking on them from the Event Summary Graph. The detailed event curve shows the magnitude and duration of the impact event, with the horizontal axis displaying the time in milliseconds and the vertical axis showing the force of the impact in g. -
Page 51: Settings
USER MANUAL SETTINGS The settings tab provides a summary of the ShockLog setup associated with the data file. Information regarding the accelerometer, event, slot and summary settings is detailed. Setup Name: The name of the setup used for the data file. Mission Comment: Displays the mission comment if one was entered during the creation of the setup file. -
Page 52: Slots
USER MANUAL Filter Frequency Displays the selected hardware filter frequency Always Max If this is set, an event will always record for the maximum length set and drop out threshold is ignored. Slots: Displays the following information: Interval The time slot interval setting, i.e. the length of time each time slot is measured. Total Run Time Shows the maximum length of time that the unit is able to record before the time slot memory is full. - Page 53 USER MANUAL The text information on the right side of the screen provides additional information about the slot graph being viewed. More specifically, it provides information regarding the highlighted area or where the cursor is positioned. When the slot tab is first selected, the cursor will be at the far left zero position and is depicted by a red line.
-
Page 54: Select Slots
USER MANUAL Value at Cursor: Shows the channel value where the cursor has been positioned. In this example, it is at zero, because the cursor has not been moved from its original starting position. This feature can be used to highlight spikes/peaks in the data and quickly ascertain actual values at these points. -
Page 55: Tilt & Roll
USER MANUAL TILT & ROLL These two data points are separated into two graphs, named Roll Traces and Tilt Traces. Any breaks in the communication channel that can occur during the recording period are represented as a red cross on the respective graph. -
Page 56: Export
USER MANUAL EXPORT From all the detailed graph tabs it is possible to export the raw data from the data files to allow manipulation of the data in alternative packages such as Excel and MATLAB. To export the Slot data from the Slots tab, click the “Export”... -
Page 57: Slot Alarms
USER MANUAL SLOT ALARMS In the File Viewer screen, the slot alarms tab will bring up a table of slot alarm levels and indicate if they are in an alarm condition. SUMMARIES In the File Viewer screen, the Summaries tab will bring up a table of data, summarizing what has happened in each of the summary periods including the number of events, peak acceleration and any environmental conditions recorded. -
Page 58: Column Data
USER MANUAL COLUMN DATA The information is presented as a grid with columns of data that relate to the data file being viewed. The potential columns of data include: Date/Time: Specifies the date and time of the summary record. Warns: Specifies the number of warning events recorded in summary period. Alarms: Specifies the number of alarm events recorded in summary period. -
Page 59: Sorting Summary Data
USER MANUAL SORTING SUMMARY DATA Summary data is presented in a spreadsheet style grid and can be sorted via the column headings. An example is to view the data based on number of alarms. Click on the column header and the data will be sorted into ascending or descending order. -
Page 60: Export
USER MANUAL Each summary period has several time slot periods within it, and the slot graphs scales to show all the relevant slots for a given summary period. To view the Slot graphs, it is necessary to click “Show Slots” in the top left menu of the Summary tab. The software will move to the Slots tab with the slot graphs zoomed into the summary period time frame. -
Page 61: Events
USER MANUAL EVENTS The final tab in the file viewer is the “Events Tab”. This tab displays the detailed event curves for alarm and warning events. Text data related to a graph is displayed. Above the text there are two arrow buttons that allow the user to scroll through the events. -
Page 62: Drag 'N' Zoom
USER MANUAL Maximum in View: Considers the values for the event currently visible on the graph and tells the user the highest value seen. If the user zooms in on the data, this action will potentially change if the original peak is not within the zoomed area. Minimum in View: Considers the values for the event currently visible on the graph and tells the user the lowest value seen. -
Page 63: Frequency Calculations
USER MANUAL FREQUENCY CALCULATIONS The ShockLog can calculate frequency and period (duration) of an event on a per axis basis. In the example below, the axis of interest is the Z axis. The X and Y axes have been deselected on the right side of the screen. To calculate the frequency between two points, right click on the first point and select the starting point per axis and then move the cursor to the ending point of interest and right click on the point. -
Page 64: Zoom All
USER MANUAL ZOOM ALL Pressing this button allows the user to return to the original view of the graph, canceling all zoomed-in areas. SHOW SLOTS Like the Slot and Summary tabs, the Events tab contains hyperlinks that allow the user to move between relevant sources of data. -
Page 65: Export
USER MANUAL The columns of data include: Sample: A straight count from zero to the maximum number of samples, with 4096 being the highest possible, for a given event. Time: The number of milliseconds from the start of the event that the sample relates to. X, Y, Z: The g value seen by each of the axes at the given sample point. -
Page 66: Graph Scaling
USER MANUAL TIP: It is not advisable to scroll through the events when the Events data table is open as it will dramatically reduce the speed at which the software is able to load the next event. To add any of the summary or slot information in addition to the event data, check the appropriate boxes to be exported. -
Page 67: Filters
250Hz filter in Figure A and 10Hz filter in Figure B. The peak of the Z-axis is reduced from over 10G in Figure A to below 0.2G in Figure B. If you are unsure whether it is advisable to post-filter your data, please contact SpotSee Technical Support to discuss your application. -
Page 68: Report And Post Processing Options
USER MANUAL REPORT AND POST PROCESSING OPTIONS The ShockLog software allows users to perform several post processing functions that enable additional analysis of impact event waveforms. To enable these functions, select Tools>Post Processing Options. The Report & Post Processing Options screen will open. FFT/PSD FFT tools transforms time-based data into the frequency domain. - Page 69 USER MANUAL The Rectangular (Boxcar) is the equivalent of having no windowing. The Hanning window is a common windowing tool. The various window tools allow the user to address the beginning and ending of an impact event which by its nature is not a continuous signal.
-
Page 70: Srs Analysis
USER MANUAL SRS ANALYSIS Shock response spectrum (SRS) is a means to graphically represent an impact event in terms of how a single degree of freedom system would respond to that event. The horizontal axis shows the natural frequency of the system and the vertical axis shows the peak acceleration the system would undergo as a result of the impact event. - Page 71 USER MANUAL SRS Table SRS Graph This document is written and published by ShockWatch, Inc. All rights reserved.
-
Page 72: Delta V Analysis (Δ V)
USER MANUAL DELTA V ANALYSIS (Δ V) To enable this function, select Tools>Post Processing Options. The Report & Post Processing Options screen will open. Click Enable Energy Analysis and/or Enable Energy Analysis in Event Table to enable the tool. Enable Energy Analysis displays the Δ V analysis for each event separately (Figure C). Enable Energy Analysis in Event Table displays the Δ... - Page 73 USER MANUAL The table created for each event, is illustrated below: Time Sample (sec)– time at which the max peak of the individual event occurred T Shock (sec)– duration of the individual pulse Xmax, Ymax, Zmax (g) - maximum amplitude of the event Emax (g) –...
-
Page 74: Exercise: Desk Top Test
USER MANUAL EXERCISE: DESK TOP TEST The following exercise will allow the user to practice the fundamental skills necessary to enter a basic setup, create a few impact events and view the downloaded data. CONNECTING THE SHOCKLOG TO A PC The USB communication port is located on the right side of the ShockLog opposite the connector with the black cover. -
Page 75: Drop Test
USER MANUAL Select the default.setup413 file and click “Open.” Select “Yes” when prompted with the question “Set the ShockLog unit’s clock to the current PC date and time?” The information bar at the bottom of the screen will show a connecting status and change to “OK.” A confirmation window will appear after the setup has been successfully sent to the ShockLog unit. -
Page 76: Download The Data
USER MANUAL DOWNLOAD THE DATA After allowing the ShockLog to run for a short period of time and generating a number of events, reconnect the ShockLog to the PC via the USB cable. From the Communications window, it will be possible to view the status of the ShockLog and verify that a number of events have been recorded. -
Page 77: Ibutton Communications
USER MANUAL IBUTTON COMMUNICATIONS The ShockLog family of products allows for an efficient method of communication through an iButton interface. This interface allows users to perform basic ShockLog operations without a PC connection. iButtons are available to setup, start, stop, set clock and download the ShockLog report. -
Page 78: Passwords
USER MANUAL PASSWORDS With iButtons and ShockLog units, there are two levels of password protection. The iButton password is the first level and is user definable. The ShockLog password is the second level and is factory set. The ShockLog password cannot be changed by the user. -
Page 79: Shocklog Passwords
USER MANUAL SHOCKLOG PASSWORDS The ShockLog Passwords are factory defined and cannot be changed by the user. The ShockLog passwords work in a similar way to the iButton passwords, preventing communication with the ShockLog from iButtons that do not have the appropriate passwords. However, the ShockLog passwords are unique to each ShockLog and are supplied with the units when purchased. -
Page 80: Setup Passwords
USER MANUAL desired setup file. Please note that if passwords are required, they must have been setup within the setup file before sending to the iButton. Refer to the File Setup section earlier in this manual. SETUP PASSWORDS ShockLog passwords allow users to protect their units from unauthorized access, download and corruption. The ShockLog passwords are factory defined for every ShockLog and are unique to each ShockLog serial number. -
Page 81: Security Log
USER MANUAL SECURITY LOG The Security Log provides users with a detailed list of communication activity for the ShockLog unit. This data includes dates and times of activities, a description of the activity and provides an additional audit trail for a data file. The ShockLog Security Log can only be cleared by the factory during the ShockLog calibration process. -
Page 82: Multiple File Export
USER MANUAL MULTIPLE FILE EXPORT It is possible for users to export batches of data files as well as individual files via the records table. Within the records table, by highlighting an individual record and then pressing the right hand mouse button you will be presented with a small menu with the option of “Export to Database.”... -
Page 83: Records Table
USER MANUAL be displayed on the main viewer screen. The headers have changed slightly and no longer display the various tab options. This is because additional windows are opened for each of the events checked. Now that the events are opened, it is possible to restructure the screen view using the cascade and tile options under the View menu. -
Page 84: File Sorting
USER MANUAL FILE SORTING In the Record Table, it is possible to change the order of the display by any of the columns, enabling the user to search for specific sections of data. By clicking on the title of a column, the database will be sorted by the information held within that column. -
Page 85: File Sorting
USER MANUAL Event Date: Displays the date and time the specific event was recorded; relates to the ShockLog internal date and time and may vary with the PC date settings if the unit was set up in another time zone. Duration: Shows the length of time in seconds that the event lasted and can be 1, 2, 4, 8, 16, 32, 64, or 128 seconds. - Page 86 USER MANUAL If the user now wishes to view the event curve for this specific event, there is a choice of linking straight to it from the Slots tab or from within the Event Table. From the Event table, it is possible to hyperlink by double clicking any of the Number column, the Event date or the graphic next to the date.
-
Page 87: Menu Options
USER MANUAL MENU OPTIONS In this manual section all of the available menu options and features that have not already been discussed will be covered. FILE MENU The “New” option in the File Menu allows users to create a new database. This feature is used for various reasons including the creation of archive databases, creating unique databases for different companies or departments etc. -
Page 88: Export
USER MANUAL The download process of ShockLog products will automatically import the data files into the opened database and will not require the import option. However, should a problem occur with the automatic importation of data files following a download from the latest ShockLog ranges, it is possible to import the data file through this method. To import a single data file, select the “Import”... -
Page 89: Delete
USER MANUAL A number of options are available for downloading all of the files (or some of the files) within the database. Click in the tick box next to the “All records” entry on the left side. The box to the right will be filled with a list of the data that is to be exported with ticks to the side, which will include: •... -
Page 90: Print
USER MANUAL PRINT The printing options under the File Menu consist of 4 sections and provide the following functionality: Print – Prints to the default (or selected) printer and will print the current view within the file viewer screen depending on the current tab being viewed. Report –... -
Page 91: Data Paths
USER MANUAL Temperature Displayed as Celsius or Fahrenheit. Velocity Displayed as cm/s, m/s, ft/s or in/s. Additional options can be selected by checking the following checkboxes: Limit Software Filtering Relates to the post processing filters on the Event graphs. When this box is checked and the data file being viewed has a frequency filter of less than 250Hz, this feature will limit the filtering options to the filter value set in the settings. -
Page 92: Compact And Repair Database
USER MANUAL With this option, users are also able to select the baud rate at which the ShockLog will communicate. There are times when a slower baud rate may be required. If the user is experiencing communication difficulties, slowing the baud rate may resolve the problem. -
Page 93: Read Last Gps Data
USER MANUAL the “Setup” button in the Communications window. The ShockLog unit must be connected to the PC via the USB for this setup. READ LAST GPS DATA When a ShockLog 298 unit with the GPS module installed is attached, it is possible to request the last positional information recorded. -
Page 94: Help Menu
USER MANUAL By hovering over the New Window option, an additional menu appears to the right side listing a number of different screens and tables that are available. The Explorer, Record Table, Events Table, Slot Breaks Grid, and Radio Table and are all dockable windows and are explained in detail earlier in this manual. -
Page 95: Import Of Legacy Data Files
USER MANUAL IMPORT OF LEGACY DATA FILES In order to convert the legacy data files, it is necessary to import them into the database. Under the File menu select the “Import” option. A file selection window will appear. If the data file has been downloaded using the latest software, the correct directory will appear, and it will only be necessary to change the file type to view the old-style data files. -
Page 96: Appendix
USER MANUAL APPENDIX This document is written and published by ShockWatch, Inc. All rights reserved. -
Page 97: Appendix A - Shocklog Satellite
APPENDIX A - SHOCKLOG SATELLITE APPENDIX A - SHOCKLOG SATELLITE Appendix A - ShockLog Satellite This document is written and published by ShockWatch, Inc. All rights reserved. - Page 98 Real-time reporting of impact alerts informs the right people when unacceptable conditions have occurred during a journey. POWERING THE SHOCKLOG SATELLITE All required lithium batteries for the ShockLog and ShockLog Satellite module are installed at the factory unless otherwise arranged with SpotSee. Batteries included are as follows: Component Battery Type Quantity 3.6V AA Lithium Batteries...
- Page 99 APPENDIX A - SHOCKLOG SATELLITE CONNECTING THE SHOCKLOG RECORDER TO THE SATELLITE MODULE The ShockLog Satellite satellite module and the ShockLog must be connected prior to use. A plug on the satellite module covers the communication port between the module and the ShockLog.
- Page 100 APPENDIX A - SHOCKLOG SATELLITE SAFETY WARNING START MONITORING Once the ShockLog has been programmed and the ShockLog Satellite unit has been mounted, the unit must be started to begin recording. It is recommended that the START iButton be used to start the ShockLog Satellite. Remove the black center cap from the ShockLog iButton port and insert the START iButton into the port.
- Page 101 APPENDIX A - SHOCKLOG SATELLITE DOWNLOADING THE SHOCKLOG SATELLITE When the ShockLog Satellite system’s journey has ended, the full dataset from the ShockLog can be downloaded through the USB port. This step is recommended if impact data needs additional analysis. RECOMMENDED STORAGE When the unit is not in use, it is recommended that the ShockLog be stopped and the satellite module be turned off.
-
Page 102: Appendix B - Shocklog Cellular
APPENDIX B - SHOCKLOG CELLULAR Appendix B - ShockLog Cellular Appendix B - ShockLog Cellular This document is written and published by ShockWatch, Inc. All rights reserved. - Page 103 POWERING THE SHOCKLOG CELLULAR MODULE All the required lithium batteries for the ShockLog Cellular are provided unless otherwise arranged with SpotSee. To install the batteries, please follow the instructions below: Unscrew the Battery Panel (see image to the right).
- Page 104 APPENDIX B - SHOCKLOG CELLULAR MOUNTING THE SHOCKLOG CELLULAR MODULE Important: The ShockLog Cellular does not require line of site for any communication. However, it must be able to receive cellular signals. If mounting in a container, ensure that any metal content of the container does not block cellular reception.
- Page 105 APPENDIX B - SHOCKLOG CELLULAR STOPPING THE SHOCKLOG The ShockLog can be stopped with the Stop ibutton or it can be stopped after connecting the ShockLog to a USB port. To prevent capturing impact events resulting from dismounting the ShockLog Cellular, a best practice is to use the Stop ibutton.
-
Page 106: Appendix C - Spotsee Platform
APPENDIX C - SPOTSEE PLATFORM APPENDIX C - SPOTSEE PLATFORM Appendix C - SpotSee Platform This document is written and published by ShockWatch, Inc. All rights reserved. - Page 107 15 minutes after activation. If this is the first connected device purchase for your company, you must establish an account admin. This person will be responsible for managing user access to the SpotSee Cloud. Navigate to activate.spotsee.io to begin the activation process.
- Page 108 APPENDIX C - SPOTSEE PLATFORM The admin can view and manage other users and assets inside the company. Clicking Users on the left side menu displays a list of all existing users for your account. Add a user by clicking the plus (+) sign or edit a user by clicking the pencil icon.
- Page 109 APPENDIX C - SPOTSEE PLATFORM LOGIN AND PASSWORD RECOVERY Navigate to cloud.spotsee.io and enter your email and password. If you have forgotten your password, click “Forgot Password.” Enter your email and click “Reset Password.” An email will be sent with directions and a link to reset your password.
- Page 110 APPENDIX C - SPOTSEE PLATFORM DASHBOARD The SpotSee Cloud allows you to monitor the ShockLog Satellite from any location. After logging into the cloud platform, the dashboard will show you the last known location of your ShockLog Satellite assets, a list of your active assets and the most recent alarm for each asset.
- Page 111 DATE RANGE By default, the date range for a device in the SpotSee Cloud is the past seven (7) days. The date range is shown in the top right portion of the screen. If a particular date range is of interest, the range can be changed by selecting the calendar icon shown to the right.
- Page 112 APPENDIX C - SPOTSEE PLATFORM NOTIFICATIONS When an alarm occurs, notifications can be sent to interested users. Click on the alarm icon to open the notifications form. Enter the email address of the peson(s) who should receive notifications when an alarm occurs. Click the + button to add additional users and the Update button after all email addresses have been entered.
- Page 113 (or alarms) will be removed from the map and the list. The trip path is traced by default in the SpotSee cloud. If you do not wish to see the journey path, you may remove the Lines from the map.
- Page 114 APPENDIX C - SPOTSEE PLATFORM ALARMS OVER TIME A graph of impact alarms over time is displayed. Each alarm is represented in the x, y, and/or z axis. Hover the cursor over the bars in the Alarms over Time graph to see the individual impact values.
- Page 115 APPENDIX C - SPOTSEE PLATFORM OTHER PARAMETERS The ShockLog Satellite will also record temperature, humidity and tilt & roll. Each parameter will have a value over time graph associated with it. The graph below illustrates temperature over time. Hover the cursor over the points in the chart to see the individual temperature values.
Need help?
Do you have a question about the ShockLog Series and is the answer not in the manual?
Questions and answers