YOKOGAWA ScopeCorder DL350 User Manual
Hide thumbs
Also See for ScopeCorder DL350:
- Getting started manual (220 pages) ,
- User manual (215 pages) ,
- User manual (235 pages)

Related Manuals for YOKOGAWA ScopeCorder DL350


Summary of Contents for YOKOGAWA ScopeCorder DL350
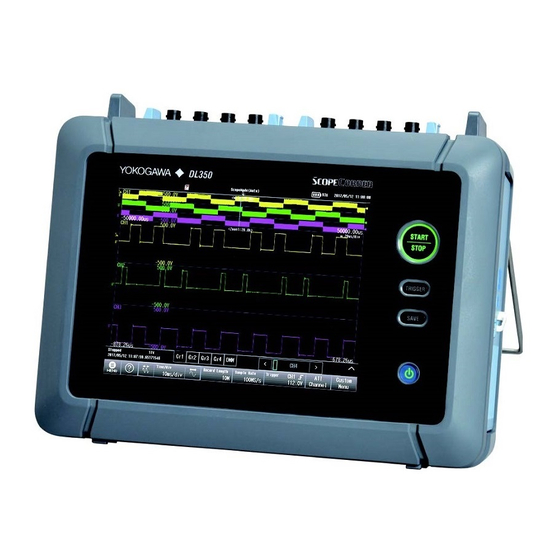
- Page 1 DL350 ScopeCorder Features Guide IM DL350-01EN 2nd Edition nbn Austria GmbH Riesstraße 146, 8010 Graz Tel. +43 316 40 28 05 | Fax +43 316 40 25 06 nbn @ nbn. at | www. nbn. at...
- Page 2 • Every effort has been made in the preparation of this manual to ensure the accuracy of its contents. However, should you have any questions or find any errors, please contact your nearest YOKOGAWA dealer. • Copying or reproducing all or any part of the contents of this manual without the permission of YOKOGAWA is strictly prohibited.
- Page 3 • MATLAB is a registered trademark of The MathWorks, Inc. in the United States. • ScopeCorder and GIGAZoom ENGINE are registered trademarks of Yokogawa Electric Corporation. • In this manual, the ® and TM symbols do not accompany their respective registered trademark or trademark names.
-
Page 4: Table Of Contents
Contents List of Manuals ...........................i Main Features Scope Mode and Recorder Mode ....................1-1 Vertical Axis........................... 1-1 Waveform Acquisition ........................1-3 Triggers ............................1-4 Waveform Display ......................... 1-6 Cursor Measurement ........................1-6 Automated Measurement of Waveform Parameters ..............1-6 Waveform Analysis ........................1-7 Notes about Using the 16-CH Voltage Input Module (720220), Notes about Using the 16-CH Temperature/Voltage Input Module (720221) ............. - Page 5 Contents About Shunt Calibration (Only on the 701271(STRAIN_DSUB))..........4-32 Acceleration Measurement ......................4-34 Frequency Measurement ......................4-36 FV Setting (F/V Setup) - frequency measurement ..............4-36 Measured Item (Function) - frequency measurement ..............4-36 Settings for Each Item - frequency measurement............... 4-39 Filter (Filter) - frequency measurement..................
- Page 6 Contents Trigger Trigger Settings (Setting) ......................6-1 Trigger (Trigger) ..........................6-1 Signal Type and Trigger Type Combinations ................6-2 Basic Trigger Settings ........................6-2 Simple (Simple)..........................6-3 Trigger Source (Source) ....................... 6-3 Trigger Slope (Slope) ........................6-4 Trigger Level (Level) ........................6-4 Trigger Hysteresis (Hysteresis) .....................
- Page 7 Contents Cursor Measurement Turning Cursor Measurement On and Off..................9-1 Cursor Type (Type) ........................9-1 Horizontal Cursors (Horizontal) - T-Y waveforms ................. 9-2 Vertical Cursors (Vertical) - T-Y waveforms .................. 9-3 Marker Cursors (Marker) - T-Y waveforms ................... 9-5 Angle Cursors (Degree) - T-Y waveforms ..................9-7 Horizontal and Vertical Cursors (H &...
- Page 8 Contents FFT Waveform Selection ......................13-1 Turning the FFT On and Off ......................13-1 FFT Settings (FFT Setup) ......................13-1 Vertical Scale (Vert. Scale) ......................13-2 Center/Scale (Center/Sens.) ....................... 13-2 Horizontal Zoom (Horiz. Scale) ....................13-2 Horizontal Range (Left/Right, Center/Span) ................13-2 Horizontal Scale (Axis)........................
- Page 9 Contents Waveform Zoom (Scope mode only) Turning the Zoom Window Display (Display) On and Off ............17-1 T/div of the Zoom Window (T/Div) ....................17-2 Position (Zoom Position) ......................17-2 Zoom Link ........................... 17-2 Display Format (Format) ......................17-2 Zoom Source Window (Zoom2 Source)..................17-2 Display Ratio of the Main Window (Main Ratio)................
- Page 10 Contents Other Features System Configuration (System Configuration) ................23-1 Network (Network) ........................23-4 Environment Settings (Preference) ..................... 23-4 File Operation (File) ........................23-6 Self-test (Selftest) ........................23-7 Overview (Overview)........................23-8 Appendix Appendix 1 How to Calculate the Area of a Waveform............App-1 Appendix 2 About the FFT Function ..................
-
Page 11: Main Features
1 Main Features Scope Mode and Recorder Mode This instrument can be used in the following two system modes. Scope Mode Scope mode is used to set the time axis using Time/Div and record length. This is the typical time scale setting method for oscilloscopes. - Page 12 1 Main Features SENT signal monitoring 720243 (SENT) These modules can be used only with models with the /VE option. Vertical Scale The vertical scale is used to adjust the displayed waveform amplitude so that you can easily view signals. Set the vertical scale for each channel.
-
Page 13: Waveform Acquisition
1 Main Features Waveform Acquisition Based on the data that has been stored in the acquisition memory, the instrument performs various operations, such as displaying waveforms on the screen, computing, measuring cursors, and automatically measuring waveform parameters. You can set the number of data points to store in the acquisition memory (the record length), enable or disable the sample data averaging feature, and so on. -
Page 14: Triggers
1 Main Features Triggers Triggers are events used to display waveforms. A trigger occurs when the specified trigger condition is met, and a waveform is displayed on the screen. Trigger Types Scope Mode There are two trigger types: simple and enhanced. •... - Page 15 1 Main Features Recorder Mode • Edge Trigger The instrument triggers when the trigger source input signal passes through the specified trigger level in the specified way (rising edge, falling edge, or rising or falling edge). • Time Trigger The instrument triggers at the specified date and time. •...
-
Page 16: Waveform Display
1 Main Features Waveform Display The instrument displays measured time-domain waveforms. You can switch the waveform display using display groups. You can also divide the screen. Snapshot You can continue displaying a waveform on the screen as a snapshot waveform after the screen has been updated and the waveform has been cleared in update mode or after the waveform has left the screen in roll mode. -
Page 17: Waveform Analysis
1 Main Features Waveform Analysis Waveform Computation Arithmetic, binarization, phase shifting (display the waveform with its phase shifted), frequency, period, moving average (2, 4, 8, or 10 points), and RMS can be computed. The power spectrum of the input waveform can be displayed in the FFT window. Up to two FFT waveforms can be displayed. -
Page 18: Notes About Using The 16-Ch Voltage Input Module
1 Main Features Notes about Using the 16-CH Voltage Input Module (720220), Notes about Using the 16-CH Temperature/Voltage Input Module (720221) Notes about Using the 16-CH Voltage Input Module (720220) While normal voltage input modules have two main channels for analog signal input, the 16-CH voltage input module has 16 sub channels for analog input. - Page 19 1 Main Features • Because the waveform data stored in the acquisition memory is used to display waveforms on the screen, the data of all sub channels is displayed as if though it were sampled at the same timing. • The following operations are performed on the waveform data stored in the acquisition memory: waveform zooming, cursor measurement, the automated measurement of waveform parameters, computation, FFT, waveform searches, and the loading and saving of waveform data.
-
Page 20: Navigation
2 Navigation Select the following operation according to how the instrument is to be used. • Scope mode (Scope Mode) • Recorder Mode (Recorder Mode) • Load setup file (Load file) • Easy setup (Easy Setup) Scope Mode (Scope Mode) Scope mode is used to set the time axis using Time/Div and record length. -
Page 21: Preparation
3 Preparation Initialization of Settings (Initialize) You can reset the instrument settings to their factory default values. This feature is useful when you want to cancel all the settings that you have entered or when you want to redo measurement from scratch. Only initialize the instrument if you are sure that it is okay for all of the settings to be returned to their default values. -
Page 22: Calibration (Calibration)
3 Preparation Calibration (Calibration) Executing Calibration (Execute) Calibrates the following items. Execute calibration when you want to make accurate measurements. • Vertical-axis ground level Calibration is performed automatically when the power switch is turned on. Notes about Calibration • Allow the instrument to warm up for at least 30 minutes before you execute calibration. If you execute calibration immediately after power-on, the calibrated values may drift due to temperature changes or other environmental changes. -
Page 23: Vertical Axis
4 Vertical Axis This section explains how to configure the signal input settings and the amplitude-direction display settings. The items that can be set vary depending on the installed modules. Input Settings All Channel Settings (All CH Setup) You can configure the settings of all channels while viewing the settings in a list. You can also copy the various vertical axis settings of one channel to another channel. -
Page 24: All Channel Settings (All Ch Setup)
4 Vertical Axis You can use auto setup to automatically configure the appropriate settings (such as vertical axis, horizontal axis, and trigger settings) for the input signal. This feature is useful when you are not sure what type of signal will be applied to the instrument. - Page 25 4 Vertical Axis Linear Scaling (Linear Scale) You can configure the linear scaling settings of all channels while viewing the settings in a list. This function is the same as the linear scaling function for voltage measurement. Linear scaling (Linear Scale); A and B for AX+B or P1:X, P1:Y, P2:X, and P2:Y for P1-P2; unit (Unit); display mode (Disp Type);...
-
Page 26: Voltage Measurement
4 Vertical Axis Voltage Measurement For voltage measurement, the items that have to be set for each input signal (CH1 to CH4) include vertical scales, vertical positions, input coupling, probe attenuation, bandwidth limit, zoom method, offset, waveform inversion, trace, and linear scaling. You can measure voltage by connecting probes, measurement leads, etc. -
Page 27: Vertical Scale (V/Div, V Range)
4 Vertical Axis Vertical Scale (V/Div, V Range) Voltage Scale Setting The vertical scale is used to adjust the displayed waveform amplitude so that you can easily view signals. Set the vertical scale for each main channel and each sub channel. On a 720254 4-CH module, select the sub channel. - Page 28 4 Vertical Axis Selectable Range of V/div and V Range The selectable range varies as shown below depending on the input module. The values in the following table are for when the probe attenuation is 1:1. Multiply the values by 10 when the attenuation is 10:1, by 100 when the attenuation is 100:1, and by 1000 when the attenuation is 1000:1.
- Page 29 4 Vertical Axis Measurement and Display Ranges The measurement range of this instrument is 0 V ±10 div (the absolute width, or span, is 20 div). The default display-range setting is ±5 div (the span is 10 div). Using the features listed below, you can move and scale the displayed waveform so that parts of it that were outside of the display range are displayed.
-
Page 30: Input Coupling (Coupling)
4 Vertical Axis Input Coupling (Coupling) It is easier to measure the amplitude of an AC signal if you remove its DC component. On the other hand, there are times when you want to measure the ground level or observe the entire signal, including both the DC and AC components. -
Page 31: Bandwidth Limit (Bandwidth)
4 Vertical Axis Bandwidth Limit (Bandwidth) You can specify a bandwidth limit for each module. You can use bandwidth limits to observe input signal waveforms with their noise components removed. Normal Bandwidth Limits High frequency components can be eliminated from the input signal. The bandwidth limits vary as shown below depending on the input module. - Page 32 4 Vertical Axis Bandwidth Limit on the 701262 (UNIVERSAL (AAF)) and 701275 (ACCL/VOLT) When you are measuring voltage using the 701262 (UNIVERSAL (AAF)) or when you are using the 701275 (ACCL/VOLT) and the bandwidth is set to Auto, the anti-aliasing and low-pass filter settings vary as shown below depending on the sample rate.
-
Page 33: Probe Attenuation And Current-To-Voltage Conversion Ratio (Probe)
400 A: 1 V . If you use a probe other than one of the separately sold optional accessories provided by Yokogawa, set the attenuation ratio in accordance with that probe. 1 Output voltage rate: 1 V/A 2 Output voltage rate: 0.1 V/A 3 Output voltage rate: 0.01 V/A... -
Page 34: Zoom Method (V Scale)
4 Vertical Axis Zoom Method (V Scale) This is a setting in scope mode. You can choose the method for zooming the waveform vertically. • DIV: The waveform is zoomed by a set magnification. Set the following items. • Waveform Vertical Position (Position) •... -
Page 35: Zooming By Setting A Magnification (V Zoom)
4 Vertical Axis Zooming by Setting a Magnification (V Zoom) This is a setting in scope mode. When V Scale is set to DIV, you can set the vertical magnification and enlarge or reduce the waveform along the vertical axis. This method is useful when you want to change the vertical scale of the waveform after it has been displayed. -
Page 36: Zooming By Setting Upper And Lower Display Limits (Upper/Lower)
4 Vertical Axis Zooming by Setting Upper and Lower Display Limits (Upper/ Lower) When V Scale is set to SPAN, you can set the upper and lower vertical limits and enlarge or reduce the waveform along the vertical axis. By setting the appropriate upper and lower limits for the displayed waveform, you can zoom in vertically on the area of the waveform that you want to observe. -
Page 37: Inverted Waveform Display (Invert)
4 Vertical Axis Inverted Waveform Display (Invert) When measuring voltage and strain, you can invert the waveform display around the vertical position. Normal display Inverted display Vertical position mark • Cursor measurements, automated measurements of waveform parameters, and computations are performed on the inverted waveforms. - Page 38 4 Vertical Axis • P1-P2 You can specify two measured values (P1:X, P2:X) and specify a scale value (P1:Y, P2:Y) for each. The scale-conversion equation (y = ax + b) is determined by these four values. • Measured value (P1:X, P2:X) range: Same as the measurement range • Scale value (P1:Y, P2:Y) range: −9.9999E+30 to +9.9999E+30 However, you cannot set measured or scaled values P1 and P2 that would make value a in the scaling equation zero or an incalculable value.
-
Page 39: Copy (Copy To)
4 Vertical Axis • Linear scaling cannot be performed for measurements of temperature or acceleration. • The following waveforms cannot be linearly scaled. Accumulated waveforms (except for the most recent) • You can configure linear scaling for each channel. • The specified scaling coefficient A and offset B are retained even after linear scaling is set to OFF. •... -
Page 40: Dc Offset Cancellation (Dc Offset Cancel)
4 Vertical Axis DC Offset Cancellation (DC Offset Cancel) This function can be used to determine cursor measurement values, automatically measured values of waveform parameters, and computed values by assuming the DC signal voltage measured during offset adjustment to be 0 V. The adjustment range is ±30% of the measurement range. -
Page 41: Rms Measurement
4 Vertical Axis RMS Measurement If the module at the selected channel is 720268 (HV (with AAF, RMS)), you can observe the RMS value of the input signal. AC-RMS Use this setting when you only want to observe the RMS values of the input signal without the DC component. Example When you measure the RMS values of a 2 Vpeak sine wave, an approximately 1.4 VDC signal appears, as shown in the figure on the right. -
Page 42: Voltage Measurement (For The 16-Ch Voltage Input Module)
4 Vertical Axis Voltage Measurement (For the 16-CH Voltage Input Module) When you measure voltages using the 720220 16-CH voltage input module, the items that you have to set for each input signal (sub channel 1 to sub channel 16) include vertical scales, vertical positions, input coupling, bandwidth limit, zoom method, offset, waveform inversion, trace settings, and linear scaling. - Page 43 4 Vertical Axis Zooming by Setting a Magnification (V Zoom) Zooming by Setting Upper and Lower Display Limits (Upper/Lower) Inverted Waveform Display (Invert) Display Group (Display Group) Linear Scaling (Linear Scale) Copy (Copy to) Notes about Using the 16-CH Voltage Input Module (720220) Notes about Using the 16-CH Temperature/Voltage Input Module (720221) 4-21 IM DL350-01EN...
- Page 44 4 Vertical Axis Setting All Sub Channels (All SubChannels Setup) Input Settings (Setup) You can configure the settings of all sub channels while viewing the settings in a list. The settings that you can view and configure are listed below. The settings vary depending on the input module. •...
-
Page 45: Temperature Measurement
4 Vertical Axis Temperature Measurement For temperature measurement, the items that have to be set for each input signal (CH1 to CH4) include input coupling, thermocouple type, bandwidth limit, trace settings, temperature settings, and temperature unit. You can connect a thermocouple to one of the temperature modules, 701261 (UNIVERSAL), 701262 (UNIVERSAL (AAF)), 701265 (TEMP/HPV), or 720266 (TEMP/HPV), and measure temperatures. - Page 46 When you set RJC to OFF and apply a voltage that corresponds to a temperature t to an input terminal, if the measured temperature does not match temperature t, the instrument or the module may be damaged. Contact your nearest YOKOGAWA dealer. Burnout (Burn Out) Specify the behavior when the thermocouple input detects a burnout.
-
Page 47: Temperature Measurement (For The 16-Ch Temperature/Voltage Input Module)
4 Vertical Axis Temperature Measurement (For the 16-CH Temperature/Voltage Input Module) The 720221 16-CH temperature/voltage input module can perform temperature or voltage measurements on 16 channels. When the input coupling is set to TC, temperature measurements are performed on 16 channels. When the input coupling is set to DC, voltage measurements are performed on 16 channels. - Page 48 4 Vertical Axis Vertical Scale (V/Div, V Range) If you set the input coupling to AC, DC, or GND, set the vertical scale (V/Div, V Range). Thermocouple Type (Type) To use a thermocouple, set the input coupling to TC, and select the type of thermocouple. Input Coupling (Coupling) You can set the input coupling to DC, TC, GND, or OFF.
- Page 49 4 Vertical Axis When the Input Coupling Is Set to TC Labels (Label) Reference Junction Compensation (RJC) Built-in reference junction in scanner box. Burnout (Burn Out) Temperature Unit (Unit) Display Range (Upper/Lower) Inverted Waveform Display (Invert) Display Group (Display Group) Linear Scaling (Linear Scale) Copy (Copy to) Notes about Using the 16-CH Voltage Input Module (720220)
-
Page 50: Strain Measurement
4 Vertical Axis Strain Measurement For strain measurement, the items that have to be set for each input signal (CH1 to CH4) include vertical scales, sensor settings, the bandwidth limit, the display range, the range unit, trace settings, waveform inversion, and linear scaling. - Page 51 4 Vertical Axis Configuring the Sensor (Sensor Setup) Bridge Voltage (Excitation) You can select the voltage to be applied to the bridge head. • 2V: When the bridgehead resistance (bridge resistance) is 120 Ω to 1000 Ω • 5V: When the bridge resistance is 350 Ω to 1000 Ω • 10V: When the bridge resistance is 350 Ω to 1000 Ω You cannot change the bridge voltage during waveform acquisition. * The bridge voltage can be set to 5 V or 10 V only when: • The bridge resistance is 350 Ω or more •...
- Page 52 4 Vertical Axis Range Unit (Range Unit) Set the range unit. −6 • μSTR: Units of strain (×10 strain) • mV/V: Units of strain-gauge-transducer output The relationship between μSTR and mV/V is shown in the equation below. (mV/V) = 0.5 × (μSTR)/1000 Example 500 (μSTR) -> 0.5 × 500 (μSTR)/1000 = 0.25 (mV/V) * A unit that corresponds to the strain gauge transducer’s output. It indicates the amount of transducer output in mV that corresponds to 1 V of applied bridge voltage.
- Page 53 4 Vertical Axis • When you measure strain, be sure to perform balancing. • Set the bridge voltage to 5 V or 10 V only when the bridge resistance is 350 Ω or greater. The strain will not be measured properly if you apply a bridge voltage of 5 V or 10 V when the bridge resistance is 350 Ω or less. • When you use a strain gauge transducer, be sure to use it at a bridge voltage that is within the transducer’s recommended voltage range.
-
Page 54: About Shunt Calibration (Only On The 701271(Strain_Dsub))
4 Vertical Axis About Shunt Calibration (Only on the 701271(STRAIN_DSUB)) The 701271 (STRAIN_DSUB) strain module supports shunt calibration. Shunt calibration is a type of scaling in which the strain measurement gain is adjusted through the connection in parallel of a known resistance (the resistance for shunt calibration, hereinafter referred to as the shunt resistance) to the strain gauge. - Page 55 4 Vertical Axis P1:X When (Shunt Cal) Exec is performed, the input value when the relay circuit is off is applied. P1:Y Set the value for when the relay circuit is off (normally 0). P2:X When the relay circuit is on and (Shunt Cal) Exec is performed, the input value when the relay circuit is on is applied.
-
Page 56: Acceleration Measurement
4 Vertical Axis Acceleration Measurement For acceleration measurement, the items that have to be set for each input signal (CH1 to CH4) include vertical scales, the vertical positions, input coupling, the bias, the bandwidth limit, the zoom method, the gain, trace settings, sensitivity, and the unit. - Page 57 4 Vertical Axis Labels (Label) Zoom Method (V Scale) Waveform Vertical Position (Position) Zooming by Setting a Magnification (V Zoom) Zooming by Setting Upper and Lower Display Limits (Upper/Lower) Unit (Unit) Set the unit of acceleration to be displayed using up to four characters. The default setting is m/s .
-
Page 58: Frequency Measurement
4 Vertical Axis Frequency Measurement For frequency measurement, the items that have to be set for each input signal (CH1 to CH4) include vertical scales, the vertical positions, FV settings, the input settings, the zoom method, the offset, trace settings, and linear scaling. - Page 59 4 Vertical Axis • Revolutions (rpm)/Revolutions (rps) (Revolution(rpm)/Revolution(rps)) Revolutions (rpm) = Frequency (Hz) ÷ pulses per revolution (Nr) × 60 Measurable range: 0.01 rpm to 100000 rpm Revolutions (rps) = Frequency (Hz) ÷ pulses per revolution (Nr) Measurable range: 0.001 rps to 2000 rps F(Hz) Number of pulses per rotation: Nr •...
- Page 60 4 Vertical Axis • Velocity (Velocity) Velocity (km/h) = distance per pulse l (km) ÷ Tw (s) × 3600 Velocity (m/s) = distance per pulse l (m) ÷ Tw (s) You can define unique distances and units (angular velocity and other units). Measurable range: F (= 1/Tw) = 0.01 Hz to 500 kHz Tw(s) Distance per pulse (l)
-
Page 61: Settings For Each Item - Frequency Measurement
4 Vertical Axis Settings for Each Item - frequency measurement When Measuring Revolutions Pulse/Rotation Setting (Pulse/Rotate) Set the number of pulses per revolution to a value from 1 to 99999. When Measuring Duty Ratios or Pulse Widths • Measured Pulse Setting (Measure Pulse) Set the type of pulse to measure to Positive or Negative. -
Page 62: Filter (Filter) - Frequency Measurement
4 Vertical Axis When Measuring Velocity • Distance/Pulse Setting (Distance/Pulse) You can set the distance per pulse to a value from −9.9999E+30 to 9.9999E+30. • Time Unit Setting (Time Unit) You can set the unit of time to hour, min, or sec. The output is automatically converted to velocity based on the specified time unit. •... -
Page 63: Deceleration And Stop Prediction - Frequency Measurement
4 Vertical Axis • Pulse Averaging (PulseAverage) The input pulses are divided into groups of a specified number (1 to 4096 pulses) and measured. Pulse averaging has the following characteristics. • Enables you to eliminate the effects of missing pulses and inconsistent pulse intervals (inconsistencies in the frequency or period waveform) on measurement. -
Page 64: Input Setup (Input Setup) - Frequency Measurement
4 Vertical Axis Input Setup (Input Setup) - frequency measurement Presets (Preset) When you select a preset, the instrument automatically configures appropriate settings for all the signals (for some preset options, there are some settings that you will need to configure). You can select User to set all the settings to user-defined values. - Page 65 4 Vertical Axis The following 9 setup items are available. Voltage Range (V Range) You can set the input voltage range (±FS) to one of the options below. • When the probe attenuation (Probe) is set to 1:1 ±1 V, ±2 V, ±5 V, ±10 V, ±20 V, ±50 V (±FS) •...
- Page 66 4 Vertical Axis Pull Up (Pull Up) You can choose whether to enable the pull-up function only when Preset is set to Pull-up 5V. You cannot configure the pull-up setting when another preset is selected. If you enable the pull-up function, set the input voltage to a value from 0 V to 5 V. If you apply a voltage that is outside of this range, the internal protection circuit will cut off the pull-up circuit.
-
Page 67: Logic Measurement
4 Vertical Axis Logic Measurement For logic measurement, the items that have to be set for each input signal (CH1 to CH6) include vertical positions, the logic bit settings, the logic bit mapping, the zoom method, and trace settings. You can measure logic signals by connecting a logic probe to the 720230 (LOGIC) logic module or the logic input terminal of the instrument. -
Page 68: Can Bus Signal Monitoring (Applies To Models With The /Ve Option)
4 Vertical Axis CAN Bus Signal Monitoring (Applies to models with the /VE option) You can monitor CAN bus signals using the 720240 CAN bus monitor module. This feature is available only on models with the /VE option. CAN Frame Formats Data Frames •... -
Page 69: Reading Data Frames (Can Port Config.)
4 Vertical Axis The instrument requires the following processing times to read data frames transferred on the CAN bus. New data frames that the instrument receives during these processing times may be discarded. Number of Channels Used per Port One Port in Operation Two Ports in Operation 40 μs 80 μs... - Page 70 4 Vertical Axis • Terminator (Terminator) ON: The 120 Ω terminator between CAN_H and CAN_L on the CAN bus line is turned on. OFF: The terminator between CAN_H and CAN_L on the CAN bus line is turned off. CAN I/F CAN TRANSCEIVER CAN_H CAN_H 60Ω 60Ω CAN_L CAN_L 0.1 μF CAN Data Extraction Conditions (All SubChannel Setup) Set the extraction conditions for the CAN data that is in the data field.
- Page 71 4 Vertical Axis • Start Bit Specify the bit number of the data extraction starting point. 0 to 63 • Bit Count (Bit Cnt) Set the number of data bits to extract. The range that you can specify varies depending on the data type. Unsigned, Signed: 2 to 32 Float: The bit length that can be set is only 32.
-
Page 72: Loading A Can Data Definition File (Symbol File Load)
* An SBL file (.SBL extension) is a CANdb file (.dbc extension) that has been converted and edited into a physical value/symbol definition file using YOKOGAWA’s free Symbol Editor software. You can obtain Symbol Editor from the YOKOGAWA website (http://www.yokogawa.com/ymi/). -
Page 73: One Shot Output Settings (One Shot Out Setup)
4 Vertical Axis One Shot Output Settings (One Shot Out Setup) A single specified data frame or remote frame is output at the specified time. Message Format Select the message format. STD: Standard format XTD: Extended format ID (Hex) Set the message ID of the output data frame. Standard format (11 bits): 0x000 to 0x7ff Extended format (29 bits): 0x00000000 to 0x1fffffff Frame... -
Page 74: Lin Bus Signal Monitoring (Applies To Models With The /Ve Option)
4 Vertical Axis LIN Bus Signal Monitoring (Applies to models with the /VE option) You can monitor CAN and LIN bus signals using the 720241 CAN & LIN Bus Monitor Module. This feature is available only on models with the /VE option. •... -
Page 75: Frame And All Sub Channel Settings (Frame & All Subchannel Setup)
4 Vertical Axis Frame and All Sub Channel Settings (Frame & All SubChannel Setup) Frame Settings (Frame Setup) Set the data length and checksum method for LIN frames. You can configure these settings for each ID. • Bit Rate (Bit Rate) Select the LIN bus signal transmission speed. -
Page 76: Loading A Lin Data Definition File (Symbol File Load)
(you can change the order in the Symbol Editor’s definition list). * An SBL file (.SBL extension) is an LDF file that has been converted and edited into a physical value/symbol definition file using YOKOGAWA’s free Symbol Editor software. You can obtain Symbol Editor from the YOKOGAWA website (http://www.yokogawa.com/ymi/). -
Page 77: Configuring The Scales Of All Sub Channels (All Subchannel Auto Scale/Default Scale) - Lin
4 Vertical Axis Configuring the Scales of All Sub Channels (All SubChannel Auto Scale/Default Scale) - LIN Configure the scales of all sub channels. All SubChannel Auto: The upper and lower display range limits are set automatically. All SubChannel Default: To the greatest extent possible within the settable range, the maximum and minimum values are used to set the upper and lower limits of all sub channels. -
Page 78: Sent Signal Monitoring (Applies To Models With The /Ve Option)
4 Vertical Axis SENT Signal Monitoring (Applies to models with the /VE option) You can monitor SENT signals using the 720243 SENT monitor module. This feature is available only on models with the /VE option. SENT Message Format Fast CH •... -
Page 79: Reading Sent Messages (Port Setup)
4 Vertical Axis Waveform Display On and Off You can select whether to display each port’s input signal waveforms. Each port corresponds to CH1 to CH4. • ON: Shows the waveform • OFF: Hides the waveform Reading SENT Messages (Port Setup) Setting the Format (SENT Format) Set the message format for SENT signals. - Page 80 4 Vertical Axis Setting Error Channels (Error Channel Setup) For each of the following error types, set whether to detect them as errors, whether to display triggers, and whether to count them as errors. Error Type Error Detection Trigger Display Error Count (Detect) (Error Trigger)
- Page 81 4 Vertical Axis Trigger Display (Error Trigger) If an error is detected, the pulse waveform is displayed for two sampling periods of the SENT module. Error Count (Error Count) An error is counted when any of the error types is detected. This shows the total number of errors. Maximum count: 65535 Error Count Reset (Error Count Reset on Start) Set whether to reset the error count to zero when waveform acquisition is started with the START/STOP key on...
-
Page 82: Sent Data Extraction Conditions (All Sub Channel Setup)
4 Vertical Axis SENT Data Extraction Conditions (All Sub Channel Setup) Set the extraction conditions for each data type. SENT Data Acquisition Destination SENT data is extracted and acquired in each sub channel. The types of data acquired in sub channels are as follows. - Page 83 4 Vertical Axis Data Type FastCH Extraction Conditions Data from messages with the specified FC (frame control) is acquired in the acquisition memory. When fast channel multiplexing is set to ON, you can specify FC. Selectable range: 0x00 to 0x0F The default setting is 0x00.
- Page 84 4 Vertical Axis Value Type Select the type of data to extract. Unsigned: Unsigned integer Signed: Signed integer Data Type SlowCH Extraction Conditions This is indicated in the Endian column. Data whose message ID matches the specified ID is acquired in acquisition memory. Configure the settings according to the Slow CH message format explained earlier.
-
Page 85: Sent Data Conversion Conditions
4 Vertical Axis If Slow CH message format: , Start Bit: 0, Bit Size: 16 Enhanced (ID 4bit + Data 12bit) bit #3 ID (7- 4) Data Field (15-12) bit #2 6 bit CRC Data Field (11- 0) Bit number Bit Size: 16 Value Type Select the type of data to extract. - Page 86 4 Vertical Axis Auto Scale (Auto Scale) Configure this setting when the data type is set to Fast CH, SlowCH, or Error Count. The upper and lower display range limits are set automatically. Default Scale (Default Scale) Configure this setting when the data type is set to Fast CH, SlowCH, or Error Count. To the greatest extent possible within the settable range, the maximum and minimum values are used to set the display range setting (explained earlier) of the specified sub channel.
-
Page 87: Position Information (Gps)
4 Vertical Axis Position Information (GPS) For position information, set whether to turn the display on or off, the items to be set, measurement range, label, display range, display group, and the like. Installing a GPS unit (720940/B8093YA, an accessory sold separately) enables the following items to be measured. - Page 88 4 Vertical Axis Labels (Label) Bit 1, Bit 2 (Bit1, Bit2) Set the display label for the 3D FIX and PPS statuses (Status). Display Range (Upper/Lower) To display position information on the screen, set the upper and lower limits of the display range according to the position information variation range.
-
Page 89: Waveform Acquisition
5 Waveform Acquisition Based on the data that has been stored in the acquisition memory, the instrument performs various operations, such as displaying waveforms on the screen, computing, measuring cursors, and automatically measuring waveform parameters. This chapter explains how to set the number of data points to store in the acquisition memory (the record length), how to enable or disable the sample data averaging feature, and so on. -
Page 90: Time Scale (Time/Div)
5 Waveform Acquisition Time Scale (Time/Div) This is a setting in scope mode. When the internal clock is being used, the time scale is set as a length of time per grid division (1 div). The selectable ranges are 1 μs/div to 30 s/div, 1 min/div to 30 min/div, 1 hour/div to 12 hour/div, 1 day/div to 5 day/ div. - Page 91 5 Waveform Acquisition How the Time Axis Relates to the Display of the Waveform There are 10 div along the time axis, and 1001 points (logical number of points, not the dots on the screen) are used to draw the waveforms. As such, if the display record length is greater than or equal to 2 kpoint, as shown in the figure on the right, the instrument draws the waveform by determining the maximum and minimum values at each fixed interval (P-P compression) and aligning them vertically at the same time position (total number of points: 2002).
-
Page 92: Acquisition Time, Record Time, Acquisition Length, Record Length (Acquisition Time, Record Time, Acquisition Length, Record Length)
5 Waveform Acquisition Sample Rate If you change the time scale, the sample rate also changes. The sample rate is the number of samples-per- second (S/s). * If the sample rate is comparatively low with respect to the input signal frequency, the harmonics contained in the signal are lost. -
Page 93: Record Length (Record Length)
5 Waveform Acquisition • When the time base is External • When the acquisition method is Memory, Memory + Save on Stop, or Memory + SD Numeric Recording The acquisition length (Acquisition Length) is displayed. This is a function similar to the record length (Record Length). -
Page 94: Sampling Interval (Sampling Interval)
5 Waveform Acquisition Sampling Interval (Sampling Interval) This is a setting in recorder mode. For details on the sampling interval, see the Getting Started Guide, IM DL350- 03EN. Numeric Record Interval (Numeric Interval) This is a setting in recorder mode when the acquisition method is Memory + SD Numeric Recording. -
Page 95: Acquisition Method (Acquisition Method)
5 Waveform Acquisition Acquisition Method (Acquisition Method) This is a setting in recorder mode. Set the acquisition method. There are four acquisition methods. Memory (Memory) Data is saved to the acquisition memory. Memory + Save on Stop(Memory + Save on Stop) Data is saved to the acquisition memory. -
Page 96: Trigger Mode (Trigger Mode)
5 Waveform Acquisition Trigger mode (Trigger Mode) This is a setting in scope mode. The trigger mode determines the conditions for updating the displayed waveforms. There are four trigger modes. Auto Mode (Auto) If the trigger conditions are met before an approximately 50 ms timeout, the instrument updates the displayed waveforms on each trigger occurrence. -
Page 97: Acquisition Settings (Acquisition Setup)
5 Waveform Acquisition Acquisition Settings (Acquisition Setup) There are acquisition settings. • Acquisition Mode (Acquisition Mode) • Acquisition Count (Acquisition Count) Acquisition Mode (Acquisition Mode) Select from the following. Normal Mode (Normal) Displays waveforms without processing the sampled data. Envelope Mode (Envelope) The instrument determines the maximum and minimum values among the data sampled at the maximum sample rate for each module at a time interval that is twice the sampling period (the inverse of the sample rate) of Normal mode, saves the values as pairs in the acquisition memory, and uses the saved value pairs to display... -
Page 98: Acquisition Count (Acquisition Count)
5 Waveform Acquisition Acquisition Count (Acquisition Count) This is a setting in scope mode. The ranges within which you can set the waveform acquisition count are indicated below. If you select Infinite, the instrument continues waveform acquisition until you stop it using the START/STOP key. Changes to the number of acquisitions are not applied during waveform acquisition. -
Page 99: Trigger (Trigger)
5 Waveform Acquisition Trigger (Trigger) Time Base (Time Base) Under the initial settings, the instrument samples the measured signals using the clock signal produced by its internal time-base circuit (internal clock). You can also use an external clock signal to control sampling. One data sample is stored to the acquisition memory at every pulse in the external clock signal. - Page 100 5 Waveform Acquisition Notes about Sampling Using an External Clock Signal • Roll mode display is not available in scope mode. • There is no function for dividing the frequency of the clock signal. • The time axis cannot be changed. To change the time-axis display range, change the record length, or zoom in on the time axis.
-
Page 101: Trigger Position (Position)
5 Waveform Acquisition Trigger Position (Position) This is a setting in scope mode. When you move the trigger position, the ratio of the displayed data before the trigger point (the pre-trigger section) to the data after the trigger point (the post-trigger point) changes. When the trigger delay is 0 s, the trigger point and trigger positions coincide. -
Page 102: Trigger Delay (Trigger Delay)
5 Waveform Acquisition • In Roll Mode In roll mode, in which waveforms scroll from right to left, the time reference point is displayed as indicated below. • When the Trigger Mode Is Auto Mode The point in time when waveform acquisition was stopped is the time reference point (right side of the screen). -
Page 103: Action/Sd Recording (Action/Sd Recording)
5 Waveform Acquisition Action/SD Recording (Action/SD Recording) This is a setting in scope mode. • OFF: Action/SD recording is not executed. • Action (Action): Action is executed. • SD Recording (SD Recording): SD recording is executed. Action (Action) If Mode is set to ON, the specified action (operation) is performed in the following situations. •... - Page 104 5 Waveform Acquisition Save a Screen Capture (Save Image) The instrument saves the screen capture data to the specified destination (SD card, USB storage device, or network drive). • File Path (File Path), Auto Naming (Auto Naming), File Name (File Name) Changing the auto-naming and file-name settings for saving image data will change the corresponding settings under Image Save in the Save/Load menu.
- Page 105 5 Waveform Acquisition SD Recording (SD Recording) When measurement starts, you can record data to an SD memory card inserted into the SD memory card slot of this instrument. The recorded data is saved to files automatically. You can load the data that has been saved. •...
- Page 106 5 Waveform Acquisition • SD recording cannot be performed when the record length is less than 1 Mpoint. • SD recording cannot be performed when the action mode is on. • When you enable the SD recording feature, the trigger mode is automatically set to On Start. •...
-
Page 107: Waveform Acquisition (Start/Stop)
5 Waveform Acquisition Waveform Acquisition (START/STOP) When you start waveform acquisition, the instrument stores waveform data to the acquisition memory and updates the displayed waveforms each time it triggers. The acquisition memory is divided into many areas based on the set record length, and the maximum number of acquirable waveforms are stored in the memory. You can recall past waveforms that are stored in the memory by using the history feature when waveform acquisition is stopped. -
Page 108: Trigger
6 Trigger Triggers are events used to display waveforms. A trigger occurs when the specified trigger condition is met, and a waveform is displayed on the screen. In scope mode, set the trigger type in Trigger Settings (Setting). In recorder mode, set the trigger type in Trigger (Trigger). -
Page 109: Signal Type And Trigger Type Combinations
6 Triggering Signal Type and Trigger Type Combinations The signal type (analog or logic) determines what trigger types you can use. Scope Mode CH1 to CH6, GPS Mixed Analog Signal Logic Signal (including sub channels) Bit 1 to Bit 8 Simple −... -
Page 110: Simple (Simple)
6 Triggering Simple (Simple) • The instrument triggers on trigger source edges (rising or falling edges). Edge refers to a point where the trigger source (CH1 to CH6, External) passes through the trigger level. • The instrument triggers at the specified date and time. Trigger level Trigger source The instrument triggers here (at this edge) -
Page 111: Trigger Slope (Slope)
6 Triggering • Depending on the specified time interval, a trigger may occur while the waveform is being acquired or in the pre-trigger section (the section before the trigger that is acquired for observation). When this happens, the trigger is ignored. •... -
Page 112: Trigger Hysteresis (Hysteresis)
6 Triggering When Monitoring CAN Bus, LIN Bus or SENT Signals When the Data Type (Value Type) is Unsigned or Signed Selectable range: The settable value is determined from the bit length (Bit Count) of the relevant sub channel. Resolution: Scaling factor (Factor) When the Data Type (Value Type) is Float Selectable range: (The span between the upper (Upper) and lower (Lower) limits of the display range) ×... -
Page 113: Edge On A Trigger (Enhanced)
6 Triggering Edge On A Trigger (Enhanced) This is available only in scope mode. While state condition A is met, the instrument triggers on the OR of multiple trigger source edges. Trigger Condition A is being met Edge detection Trigger Source You can use CH1 to CH6 and Bit 1 to Bit 8 as the trigger sources. -
Page 114: Or Trigger (Enhanced)
6 Triggering OR Trigger (Enhanced) The instrument triggers on the OR of multiple trigger source edges. Trigger Source You can use CH1 to CH6, Ext (external signal applied to the TRGI terminal), and Bit 1 to Bit 8 as the trigger sources. -
Page 115: And Trigger (Enhanced)
6 Triggering AND Trigger (Enhanced) The instrument triggers on the AND of multiple trigger source conditions. The instrument triggers when all the specified conditions are met at a single point. Trigger Source You can use CH1 to CH6 and Bit 1 to Bit 8 as the trigger sources. Bit 1 to Bit 8 appear as options when •... -
Page 116: Period Trigger (Enhanced)
6 Triggering Period Trigger (Enhanced) This is available only in scope mode. The instrument triggers on a specified period of occurrence of state condition B. The instrument triggers when state condition B occurs again. Reference time T Trigger Trigger Source You can use CH1 to CH6 and Bit 1 to Bit 8 as the trigger sources. -
Page 117: Pulse Width Trigger (Enhanced)
6 Triggering Pulse Width Trigger (Enhanced) This is available only in scope mode. The instrument triggers according to a specified duration (achievement time) for which state condition B has been met. The timing of the triggering varies depending on the determination mode. Achievement time Trigger Trigger Source... -
Page 118: Wave Window Trigger (Enhanced)
6 Triggering Reference Times (Time, T1, T2) You can set the reference times (Time, T1, and T2) within the following ranges. Setting Selectable Range Resolution Time 0.02 μs to 10000000.00 μs (10 s) 0.01 μs 0.01 μs to 9999999.99 μs 0.02 μs to 10000000.00 μs (10 s) Triggering may not function properly when the interval between achievement times is less than 0.01 μs or when the duration of the achievement time is less than 0.01 μs (Typical). Trigger Position (Position), Trigger Delay (Delay) Trigger position , Trigger delay Wave Window Trigger (Enhanced) This is available only in scope mode. - Page 119 6 Triggering Tolerance Width (Width) To create a real-time template for a channel, set the distance from the averaged waveform (of 1, 2, or 4 cycles before the current waveform) that will be tolerated. The range within which you can set the distance varies depending on the type of signal being measured.
-
Page 120: Edge Trigger (Edge)
6 Triggering Level for Detecting the Start and End Points (Level) and Detection Hysteresis (Hysteresis) If you set the sync channel to a channel from CH1 to CH4, you need to set the level for detecting the start and end points and set the detection hysteresis. These items are the same as the trigger level hysteresis of the simple trigger. -
Page 121: Display
7 Display Window Types (Display) This instrument has the following types of windows. T-Y (Time axis) Waveform Display Window • Main window Displays normal waveforms, which are not magnified • Zoom window (Zoom1 and Zoom2) Displays zoomed waveforms according to the settings specified using the Zoom menu Zoom2 window can only be displayed in scope mode. -
Page 122: Display Group (Select Group)
7 Display Display Group (Select Group) Only the waveforms of the selected group are displayed on the screen. All the channels (CH, Math, and sub channels) are automatically assigned to Gr.1 to 4, DMM. You can change these assignments. Display Format (Format) You can evenly divide the T-Y waveform display window so that you can easily view input waveforms and computed waveforms. - Page 123 7 Display Display Color (Color) You can set the display color of each of the waveforms to one of 16 colors. You can assign all waveforms regardless of whether their displays are turned on. • This can be set for each sub channel for the 16-CH voltage input, 16-CH temperature/voltage input, CAN bus monitor, CAN &...
-
Page 124: Environment Settings (Preference)
7 Display Environment Settings (Preference) Interpolation Method (Dot Connect) In interpolation zones in the T-Y waveform display, Xviewer can display waveforms by interpolating between sampled data points. * Interpolation zone refers to the condition in which a given number of data points are not contained in the 10 div along the time axis. - Page 125 7 Display Accumulation (Accumulate) Ordinarily, momentary waveform anomalies are difficult to recognize because the displayed waveform is updated whenever the trigger is activated. In waveform accumulation, older waveforms remain while new waveforms continue to appear. • ON: Waveforms are accumulated. •...
- Page 126 7 Display Scale Value (Scale Value) Items Whose Scale Values Are Displayed (Display Item) You can display the upper and lower limits (scale values) of each waveform’s vertical or horizontal axes. • OFF: Hides the scale values • ALL: The vertical axis (V Scale) and horizontal axis (Time Scale) are displayed. •...
-
Page 127: Snapshot (Snapshot)
7 Display • The number of displayed points on the T-Y waveform display window varies depending on the height of the extra window. Even if the number of displayed points changes, the vertical resolution does not change. • When the extra window is displayed, depending on the Zoom Format, the scale values may overlap and be difficult to read. -
Page 128: Horizontal Scale (Horizontal)
7 Display Horizontal Scale (Horizontal) This is a setting in recorder mode. Display Time (Display Time) Set the waveform display time by specifying the time from the left edge to the right edge of the waveform screen. The time scale of the waveform screen changes automatically according to the specified display time. Selectable range From the acquisition time... -
Page 129: Switching The Channel Information Area Display
7 Display Switching the Channel Information Area Display When channel information is displayed, clicking clears the channel information and shows the full-screen waveform display. Clicking shows the information of channels whose display is set to ON. Numeric Monitor Displays the level indicator values of each channel in the numeric monitor. The numeric monitor update interval is approximately 0.5 seconds. -
Page 130: Saving And Loading Data
8 Saving and Loading Data You can save the following types of data. • Waveform data • Setup data • Screen capture data • Snapshot waveform data • Automated measurement data • FFT analysis results You can load the following types of data into the instrument. •... -
Page 131: Saving Waveform Data (Waveform Save)
8 Saving and Loading Data Saving Waveform Data (Waveform Save) You can save the waveform data that the instrument has measured to a file in binary, ASCII, or MATLAB format. • Setting the File Name (FileName Setup) • Waveform Data Save Conditions (Waveform Save Setup) •... -
Page 132: Waveform Data Save Conditions (Waveform Save Setup)
8 Saving and Loading Data File Name (File Name) You can set the common file name that is used when the auto naming feature is turned off or when the auto naming feature is set to Numbering. The maximum number of characters that you can use for file names and folder names is 32 characters. - Page 133 8 Saving and Loading Data • MATLAB • The sampled data stored in the acquisition memory is saved to a file in MATLAB format. You can select whether to include text format information (ON) or not (OFF). The extension is .MAT. You can use the file to analyze waveforms on your PC. •...
-
Page 134: Detail Setup(Detail)
8 Saving and Loading Data Cursors (Cursor1, Cursor2) When the save range is set to Cursor, set the save range with Cursor 1 and Cursor 2. You can set in the range of –5 to +5 div from the center of the waveform display window. •... - Page 135 8 Saving and Loading Data Data Format for Saving Multiple Records The instrument saves data that contains multiple records, such as history waveforms, in the following data format. ASCII format: CR+LF is inserted between records. <Header> CH1 data 1-1, CH2 data 1-1, ..., [CR+LF] CH1 data 1-2, CH2 data 1-2, ..., [CR+LF]...
-
Page 136: Saving Setup Data (Setup Save)
8 Saving and Loading Data Saving Setup Data (Setup Save) You can save the instrument setup information to the specified storage medium. The extension is .SET. Setting the File Name (FileName Setup) Saving Other Types of Data (Others Save) Save Type (Save Type) You can save the following types of data. - Page 137 8 Saving and Loading Data • Data Format (Format) You can select the format to save to from the options listed below. • PNG: The extension is .PNG. The file size is approximately 50 KB for black and white mode and approximately 100 KB for color mode.
-
Page 138: Save Key Setup (Save Key Setup)
• HP Inkjet: HP inkjet printers, single function models • Brother: Brother PocketJet or RJ-4030 printer • Do not connect an incompatible USB printer. • For USB printers that have been tested for compatibility, contact your nearest YOKOGAWA dealer. IM DL350-01EN... - Page 139 8 Saving and Loading Data Print Setup (Print Setup) Color (Color) When the printer type is HP Inkjet, select the color mode from the following options. • ON: Printing is performed using the same colors as the screen (however with no background and grid printed in black).
- Page 140 8 Saving and Loading Data • For waveforms sampled with an external clock Set using the magnification. If the magnification is set to 1, 10 divisions of waveforms are printed on a page (= 10 cm). Selectable range: Varies depending on the record length. The maximum number of pages that can be printed at once is 25.
- Page 141 8 Saving and Loading Data Notes on printing with a USB printer • The comment may not be printed properly on some printers. Use a USB printer that has been tested for compatibility. • The DL350 may not be able to detect out-of-paper or other errors on the USB printer. Notes on Long Print •...
-
Page 142: Loading Waveform Data (Waveform Load)
8 Saving and Loading Data Loading Waveform Data (Waveform Load) You can load waveform data that are saved. Waveform data in binary format (files with .WDF extensions) can be loaded. You can load a specified waveform data file with the setup data. All the data in the file is loaded. Waveforms of computed data appear when computation is turned on. -
Page 143: File Operation
8 Saving and Loading Data File Operation You can perform file operations such as creating folders on the storage medium, deleting and copying files, and changing file names. Changing the Storage Medium You can select the storage medium that you want to access. The instrument displays various storage media as follows: •... - Page 144 8 Saving and Loading Data Selecting Files (Select All, Deselect All) Selects or deselects all the files in the list. You can abort (Abort) the file copy and delete operations, except for the file that is being processed at the time.
-
Page 145: Cursor Measurement
9 Cursor Measurement You can move cursors on the waveforms displayed on the screen to view the measured values at the points where the cursors intersect the waveforms. You can select whether to measure the P-P compressed data values on the screen or the data values that have been acquired in the acquisition memory. This section explains cursor measurements of T-Y waveforms. -
Page 146: Horizontal Cursors (Horizontal) - T-Y Waveforms
9 Cursor Measurement Horizontal Cursors (Horizontal) - T-Y waveforms Two dashed lines (horizontal cursors) appear on the horizontal axis. You can measure the vertical value at the position of each horizontal cursor and measure the level difference between the horizontal cursors. Cursor1 ΔY Cursor2... -
Page 147: Vertical Cursors (Vertical) - T-Y Waveforms
9 Cursor Measurement Vertical Cursors (Vertical) - T-Y waveforms Two straight dashed lines appear on the vertical axis (these are the vertical cursors). You can measure the time between the trigger position and each cursor, the time difference between the two cursors, and the reciprocal of the time difference between the two cursors. - Page 148 9 Cursor Measurement Example of Logic Signal Measurement When you measure logic waveforms using vertical cursors, the measured values of Y1 and Y2 are determined in the manner shown below. When No Bits Are Turned Off Cursor 1 Cursor 2 •...
-
Page 149: Marker Cursors (Marker) - T-Y Waveforms
9 Cursor Measurement Marker Cursors (Marker) - T-Y waveforms Four markers are displayed on the selected waveform. You can measure the level at each marker, the amount of time from the trigger position to each marker, and the level and time differences between markers. Marker1 Marker3 Marker2... - Page 150 9 Cursor Measurement Measurement Items (Display Item) Marker cursors move on the waveform data. You can measure the following values at the markers. Time value at Marker1 Time value at Marker2 Time value at Marker3 Time value at Marker4 Δ(X2-X1) Difference between the time values of Marker1 and Marker2 Δ(X3-X1) Difference between the time values of Marker1 and Marker3...
-
Page 151: Angle Cursors (Degree) - T-Y Waveforms
9 Cursor Measurement Angle Cursors (Degree) - T-Y waveforms You can measure time values and convert them to angles. On the time axis, set the zero point (Ref Cursor1 position), which will be the measurement reference, the end point (Ref Cursor2 position), and the reference angle that you want to assign to the difference between Ref Cursor1 and Ref Cursor2. - Page 152 9 Cursor Measurement Moving the Cursors (Cursor) You can move the cursors. You can set in the range of –5 to +5 div from the center of the waveform display window. The setting resolution varies depending on the display resolution. •...
-
Page 153: Horizontal And Vertical Cursors (H & V) - T-Y Waveforms
9 Cursor Measurement Horizontal and Vertical Cursors (H & V) - T-Y waveforms Displays the horizontal and vertical cursors simultaneously. Horizontal and Vertical Cursor Settings (H&V Setup) Measurement Source Waveform (Trace) Set the measurement source waveform to one of the waveforms below. ALL, CH1 to CH6 , 16chVOLT , 16chTEMP/VOLT... -
Page 154: Notes About Cursor Measurement
9 Cursor Measurement Notes about Cursor Measurement Cursor Measurement • You cannot perform cursor measurement on snapshot waveforms or accumulated waveforms that have been acquired in the past. You can perform cursor measurement on the most recent accumulated waveform. • For history waveforms, cursor measurement is performed on the waveform whose record number is selected. •... -
Page 155: Automated Measurement Of Waveform Parameters
10 Automated Measurement of Waveform Parameters For waveforms that are displayed on the screen, various measurement items (waveform parameters), such as maximum and minimum values, can be measured automatically and their statistics can be calculated. The following types of statistical processing are available for the automatically measured values of waveform parameters. - Page 156 10 Automated Measurement of Waveform Parameters • Voltage Measurement Items Peak to Peak (P-P) P-P value (Max − Min) [V] Amplitude (Amp) Amplitude (High − Low) [V] Maximum (Max) Maximum voltage [V] Minimum (Min) Minimum voltage [V] High High voltage [V] Low voltage [V] Average (Avg) Average voltage ((1/n)Σxi) [V] Middle(Mid) (Max+Min)/2 [V] Rms voltage ((1/ (√n))(Σ(xN ) [V] Std.Deviation (SDev)
- Page 157 10 Automated Measurement of Waveform Parameters Pulse Pulse count Set the measurement time period (Time Range) to a value appropriate for the pulse that you want to measure. When Pulse = 3 Distal line (90%) Mesial line (50%) Proximal line (10%) Measurement range Burst1, Burst2 Burst period [s]...
-
Page 158: Setting The Delay (Delay Setup)
10 Automated Measurement of Waveform Parameters Setting the Delay (Delay Setup) The time difference between traces or the time difference from the trigger point to a rising or falling edge is called the delay between channels. Measurement range Count N1 Count 1 Mesial line Reference waveform... -
Page 159: Measurement Time Period (Time Range1/Time Range2)
10 Automated Measurement of Waveform Parameters • The voltage level of the detected point is the mesial line. • The measurement item name that appears when the measured values are displayed is (Delay). • If Mode is set to Degree and Reference is set to Trigger, the measured value is displayed as ‘*****’. •... -
Page 160: 1-Cycle Mode (1-Cycle Mode)
10 Automated Measurement of Waveform Parameters 1-Cycle Mode (1-Cycle Mode) Instead of automatically measuring the measurement time period specified by Time Range1 and Time Range2, you can automatically measure the first period after Time Range1. The method of determining the period is the same as the method for determining the Period measurement item. In this mode, after the period is determined, the values of the measurement items related to voltage and area are computed. -
Page 161: Statistical Processing (Statistics)
10 Automated Measurement of Waveform Parameters Statistical Processing (Statistics) Turning Statistical Processing On and Off • ON: Statistical processing is enabled. • OFF: Statistical processing is disabled. Statistical Processing Type (Type) The following types of statistical processing are available. • Continuous statistical processing (Continuous Statistics): Continuous statistical processing is performed. - Page 162 10 Automated Measurement of Waveform Parameters Measurement Time Period This setting is the same as the measurement time period setting for the automated measurement of waveform parameters. 1-Cycle Mode (1-Cycle Mode) This setting is the same as the 1-cycle mode setting for the automated measurement of waveform parameters. 10-8 IM DL350-01EN...
-
Page 163: Cyclic Statistical Processing (Cycle Statistics)
10 Automated Measurement of Waveform Parameters Cyclic Statistical Processing (Cycle Statistics) The instrument determines periods in order from the oldest data of the displayed waveform, measures the selected automatically measured items within each period, and performs statistical processing on the results of automated measurement. - Page 164 10 Automated Measurement of Waveform Parameters Cycle Trace (Cycle Trace) Selects the source waveform used to determine the period. • CH1 to CH6 , 16chVOLT , 16chTEMP/VOLT , CAN , LIN , SENT , Math1 to Math2 The period of the specified waveform is applied to all waveforms. 1 You can select the channel of an installed module.
- Page 165 10 Automated Measurement of Waveform Parameters Result Display (Result Window) Displays a list of calculated statistics. You can display the list of statistics when Mode is set to Cycle Statistics or History Statistics. Numbers are assigned to the data in order from the oldest cycle data or history data, and the automated measurement results for each number are displayed.
-
Page 166: Statistical Processing Of History Waveforms (History Statistics)
10 Automated Measurement of Waveform Parameters Statistical Processing of History Waveforms (History Statistics) This is selectable only in scope mode. In the statistical processing of history waveforms, the instrument measures automatically measured items on the acquired waveform using the history feature and performs statistical processing on them. Statistical processing is performed on older waveform data first. -
Page 167: Detail Settings (Detail Setup)
10 Automated Measurement of Waveform Parameters Detail Settings (Detail Setup) Set the reference level that is used to measure various parameter values, such as the rise and fall times, for each measurement source waveform. Source Waveform (Trace) Select the trace for setting the details. CH1 to CH6 , 16chVOLT , 16chTEMP/VOLT... -
Page 168: 11 Waveform Analysis
11 Waveform Analysis Analysis feature The analysis feature varies depending on the system mode as follows. • Analysis features in scope mode • Analysis features in recorder mode Analysis Features in Scope Mode • Computation (Math) • FFT (FFT) • X-Y waveforms (X-Y) •... -
Page 169: 12 Computation
12 Computation You can perform various computations on up to 1 Mpoint of data. (When more than 1 Mpoint of waveform data is displayed, computation is performed on the first 1 Mpoint of data from the computation start point.) The results of computation are displayed in Math1 and Math2. Waveforms stored through SD recording cannot be computed. - Page 170 12 Computation Function Basic Arithmetic (S1+S2, S1–S2, S1*S2, and S1/S2) Performs addition, subtraction, multiplication, or division on the two waveforms assigned to Source1 and Source2. + computed – computed × computed waveform waveform waveform Computation source waveforms Computed waveforms Math Source Waveforms (Source1 and Source2) CH1 to CH4 , 16chVOLT , 16chTEMP/VOLT...
- Page 171 12 Computation Function Binary Conversion (Bin (S1)) Using the specified threshold levels, you can convert the waveform assigned to Source to a digital waveform. Upper Lower Math Source Waveforms (Source) This setting is the same as that for basic arithmetic. Upper and Lower Thresholds (Upper/Lower) Set the upper and lower threshold values.
-
Page 172: Unit (Unit)
12 Computation Function Period (Period) Calculates the period of the waveform that has been assigned to Source. Math Source Waveforms (Source) The options are the same as were described for basic arithmetic. However, you can select an input channel of a logic module (select the channel, and then select the bit). -
Page 173: Vertical Scale (Vert Scale)
12 Computation Function Vertical Scale (Vert Scale) Set the method used to set the vertical display range of computed waveforms to one of the following options. • Auto: The upper and lower limits are set automatically. • Manual: The upper and lower limits must be set manually. Upper and Lower Limits (Upper/Lower) Set the upper and lower limits when Scaling Mode is set to Manual. -
Page 174: Averaging Settings (Average Setup)
12 Computation Function Averaging Settings (Average Setup) This is a setting in scope mode. You can average and compute the peak values of computed data. Averaging Modes (Average Mode) The following types of averaging are available. • OFF: Averaging is not performed. •... - Page 175 12 Computation Function Cycle Averaging (Cycle) The data from the computation start point to the computation end point is divided into the number of data points (Cycle Count) that is specified as being a single cycle, and equivalent points in each divided cycle are averaged with each other.
-
Page 176: Notes About Computation
12 Computation Function Peak Computation (Peak) The maximum value at each point of the computed data is determined, and the resulting values are used to display the waveform. For each computation, the new computed value is compared with the past value, and the larger value is kept. -
Page 177: 13 Fft
13 FFT The power spectrum of the input waveform can be displayed in the FFT window. Up to two FFT waveforms can be displayed. Power spectrum, linear spectrum, and power spectrum density can be analyzed. FFT analysis cannot be performed on waveforms stored through SD recording. FFT Waveform Selection Set the FFT trace to FFT1 or FFT2. -
Page 178: Vertical Scale (Vert. Scale)
13 FFT Unit (Unit) Vertical Scale (Vert. Scale) You can select the method for setting the vertical scale from the following options. • Auto: The center and scale of the vertical axis are set automatically. • Manual: The center and scale of the vertical axis must be set manually. Center/Scale (Center/Sens.) When Vert. -
Page 179: Detail Settings (Detail Setup)
13 FFT Detail Settings (Detail Setup) Number of FFT Points (Points) You can set the number of points from the start of computation on the T-Y waveform to one of the options below. 1k, 2k, 5k, 10k, 20k, 50k, 100k Window Function (Window) You can select the window function from the following options. - Page 180 13 FFT Averaging Modes (Average Mode) You can average and compute the peak values of computed data. The following types of averaging are available. • OFF: Averaging is not performed. • Linear averaging (Linear): Values are averaged linearly. • Exponential averaging (Exp): Values are averaged exponentially.
- Page 181 13 FFT Peak Computation (Peak) The maximum value at each point of the computed data is determined, and the resulting values are used to display the waveform. For each computation, the new computed value is compared with the past value, and the larger value is kept.
-
Page 182: Cursor Measurement On Fft Waveforms
13 FFT Cursor Measurement on FFT Waveforms Turning Cursor Measurement On and Off • ON: Cursor measurement is performed. • OFF: Cursor measurement is not performed. Cursor Type (Type) The following types of FFT waveform cursors are available. • Marker cursors (Marker): You can use four marker cursors to measure frequencies, levels, and the distances between markers. -
Page 183: Notes About Cursor Measurement
13 FFT Movement Target Marker (Marker No.) Select the marker you want to set the position of. Position (Position) Set the position of the selected marker. You can move the markers within the range of −5 to 5 div of the frequency axis in 0.01 div steps. Peak Cursors (Peak) In the frequency range defined by FFT1 Range1 and Range2 and the frequency range defined by FFT2 Range1 and Range 2, the instrument detects peaks (Peak1 and Peak2) and measures their frequencies and levels. -
Page 184: Notes About Fft Computation
13 FFT Notes about FFT Computation Notes about Displaying Power Spectrums • You cannot display a power spectrum if the display record length is less than the number of computed data points (Point). • The following settings are shared for all computation channel: FFT Points, Window, and Start Point. Notes on Computation •... -
Page 185: 14 X-Y Waveforms
14 X-Y Waveforms You can view the correlation between two waveform levels by assigning the level of one waveform to the X-axis (horizontal axis) and the level of the other waveform to the Y-axis (vertical axis). There are two X-Y waveform windows, and you can display four pairs of waveforms in each window (for a total of eight pairs). -
Page 186: Start Point And End Point (Start Point/End Point)
14 Displaying X-Y Waveforms Start Point and End Point (Start Point/End Point) You can set the start and end points of the X-Y waveforms on the T-Y waveforms. Selectable range: ±5 div from the center of the T-Y waveform window •... -
Page 187: Window Layout (Window Layout)
14 Displaying X-Y Waveforms Window Layout (Window Layout) Set the display position of the X-Y window. • Side: Horizontal • Vertical: Vertical Pen Marker (Pen Marker) You can display a pen marker on an X-Y waveform whose display is turned on. It shows the current sampled point of the waveform. -
Page 188: Cursor Measurement On X-Y Waveforms
14 Displaying X-Y Waveforms Cursor Measurement on X-Y Waveforms Cursor Type (Type) The following types of X-Y waveform cursors are available. • OFF: Cursor measurement is not performed. • Horizontal cursors (Horizontal): Two horizontal cursors are used to measure vertical (Y-axis) values. •... - Page 189 14 Displaying X-Y Waveforms Measurement Items (Item Setup) You can measure the following horizontal (X axis) values at the cursor positions. Horizontal (X axis) value at Cursor1 Horizontal (X axis) value at Cursor2 ΔX Difference between the horizontal (X axis) values of Cursor1 and Cursor2 Marker Cursors (Marker) Four markers are displayed on the selected waveform.
- Page 190 14 Displaying X-Y Waveforms Horizontal and Vertical Cursors (H & V) You can display the horizontal and vertical cursors simultaneously and measure vertical (Y axis) and horizontal (X axis) values. Measurement Source Waveform (Trace) Set the measurement source waveform to one of the waveforms below. XY1, XY2 Measurement Items (Item Setup) You can measure the following horizontal (X axis) and vertical (Y axis) values at the cursor positions.
-
Page 191: Harmonic Analysis
15 Harmonic Analysis Harmonic Analysis (Harmonics) Harmonics refer to sine waves whose frequency is an integer multiple (2 and higher) of the fundamental wave except for the fundamental wave itself. When the fundamental is mixed with harmonics, waveform distortion results. The instrument analyzes the harmonics of rms values (voltage and current) and active power. -
Page 192: Fundamental Frequency (Frequency)
15 Harmonic Analysis Fundamental Frequency (Frequency) Set the fundamental frequency. 50 Hz, 60 Hz, Auto Start Point (Start Point) Set the start point of harmonic analysis. Selectable range: –5 div to +5 div • Scope mode: Set the positions in divisions. •... - Page 193 15 Harmonic Analysis • Single-Phase Two-wire (1P2W) Two channels that receive one pair of voltage and current signals can be wired. LOAD SOURCE Clamp-on probe SOURCE LOAD • Single-Phase Three-Wire (1P3W) Four channels that receive two pairs of voltage and current signals can be wired. LOAD SOURCE Clamp-on probe...
-
Page 194: Display (Display)
15 Harmonic Analysis • Three-Phase Three-Wire (3P3W) Four channels that receive two pairs of voltage and current signals can be wired. SOURCE LOAD Clamp-on probe SOURCE LOAD Clamp-on probe Math Source Waveforms (U1, I1, U2, I2) The modules described in “Modules on Which Harmonic Analysis Can Be Performed”... -
Page 195: Save Settings (Save)
15 Harmonic Analysis Display Settings (Display Setup) Displayed Order (Disp Order) Select the harmonic orders to display from the following. • All: The data of all harmonic orders is displayed. • Even: The data of even harmonic orders is displayed. •... -
Page 196: Go/No-Go Determination (Scope Mode Only)
16 GO/NO-GO Determination (Scope mode only) The instrument determines whether the acquired waveform meets the reference condition (GO result) or not (NO-GO result). When the instrument produces a GO or NO-GO result, it executes the specified actions. Turning GO/NO-GO Determination On and Off Select whether to use GO/NO-GO determination. -
Page 197: Judgment Conditions (Judgement Setup)
16 GO/NO-GO Determination (Scope mode only) Judgment Conditions (Judgement Setup) For each of 8 judgment conditions, you can set the source waveform, zone number, and judgment criterion. You can also set the judgment logic, action condition, sequence, and acquisition count and enable or disable synchronization with a remote signal. -
Page 198: Action (Action)
16 GO/NO-GO Determination (Scope mode only) External Start (Remote) You can perform GO/NO-GO determination and output the results in sync with an external signal applied to the GO/NO-GO I/O terminal of the instrument. • OFF: GO/NO-GO determination is not performed through the use of an external signal. •... - Page 199 16 GO/NO-GO Determination (Scope mode only) Save Destination (Store as) You can select one of the following save destinations for the waveform zone. • Zone 1 to zone 6 (Zone1 to Zone6): The save destination is changed to the selected zone number. •...
-
Page 200: Waveform Parameter (Parameter)
16 GO/NO-GO Determination (Scope mode only) Waveform Parameter (Parameter) Upper and lower limits for automated measurement of waveform parameters are set, and GO/NO-GO determination is performed on whether the parameters are within or outside the range. Determination Period (Time Range1 and Time Range2) Linking Determination Periods Judgment Conditions (Judgement Setup) For each of 8 judgment conditions, you can set the source waveform, waveform parameter, upper and lower... -
Page 201: Notes About Go/No-Go Determination
16 GO/NO-GO Determination (Scope mode only) GO/NO-GO Determination Results The results of GO/NO-GO determination (and the numbers of determinations and failures) appear at the bottom of the screen. Exe Count : 10 Fail Count : 4 Result : XXXXOOOO Failure count Indication of whether reference Determination conditions 1 to 8 are met... -
Page 202: Waveform Zoom (Scope Mode Only)
17 Waveform Zoom (Scope mode only) You can magnify displayed waveforms along the time axis. The zoomed waveforms of two locations can be displayed simultaneously (the dual zoom feature). You can also specify which channel you want to zoom in on. You cannot zoom if the number of displayed points on the screen is less than or equal to 100. -
Page 203: T/Div Of The Zoom Window (T/Div)
17 Waveform Zoom (Scope mode only) T/div of the Zoom Window (T/Div) Set the zoom factor in T/Div. You can set separate horizontal zoom factors for Zoom1 and Zoom2. The zoom- window time scale changes automatically based on the specified zoom factor. Selectable Range Two times the time scale (Time/Div) of the main window to the point where the number of data points in the zoom window reaches 10 points per div. -
Page 204: Window Layout (Window Layout)
17 Waveform Zoom (Scope mode only) Window Layout (Window Layout) You can select the layout of the two zoom windows. • Side: Horizontal • Vertical: Vertical Waveforms That Are Zoomed (Allocation) The waveforms of the channels whose check boxes are selected in the allocation window and whose displays are turned on are displayed. -
Page 205: Waveform Display Position And Zoom (Recorder Mode Only)
18 Waveform Display Position and Zoom (Recorder mode only) You can magnify displayed waveforms along the time axis. The zoomed waveform of one locations can be displayed. You can also specify which channel you want to zoom in on. You cannot zoom if the number of displayed points on the screen is less than or equal to 100. -
Page 206: Position (Zoom Position)
18 Waveform Display Position and Zoom (Recorder mode only) Position (Zoom Position) You can set the center position of the zoom box in terms of the time (ddhhmmss) corresponding to –5 to +5 div from the center of the waveform display window. On the main window, the box enclosed by a solid line is the zoom box. -
Page 207: 19 Searching Waveforms
19 Searching Waveforms You can search the displayed waveforms for locations that match the specified conditions. You can zoom-in on the detected locations. You can search the waveforms within the specified search range over up to 10 Gpoint. Point of detection Search start point Search end point Hysteresis... -
Page 208: Edge Search (Edge)
19 Searching Waveforms Edge Search (Edge) Search for positions where the rising or falling slope of the specified waveform passes through the specified level. Detected point for rising edge ( Level Source Search Conditions (Setup) Set the search conditions, such as the waveforms to search, judgment level, polarity, hysteresis, count, and bit settings.* * Only on the channel of a logic module Source Waveform (Trace) - Page 209 19 Searching Waveforms Count (Count) Set the number of times the specified edge ( , , or ) must repeat. You can select a number from 1 to 1000000. The detected point is the point at which the search conditions are met the specified number of times. For example, if the count is set to 5, when five points that meet the search conditions are found, the fifth point becomes the detected point.
-
Page 210: Event Search (Event)
19 Searching Waveforms Event Search (Event) You can search for an event number that was assigned during measurement. Event Number (Select Number) Select the event number that you want to search for. When searching manual events, the selectable range is 1 to 100 (maximum number of input events). * When the trigger mode is auto, event search is performed only on the event numbers remaining on the display screen. -
Page 211: Time Search (Time)
19 Searching Waveforms Time Search (Time) Search for a specific year, month, day, and time. Search Conditions (Setup) Time (Absolute Time) Specify the time that you want to search for. Set the year (Year), month (Month), day (Day), hour (Hour), minute (Minute), second (Second), and microsecond (μSecond). -
Page 212: History Waveform Display (Scope Mode Only)
20 History Waveform Display (Scope mode only) Acquisition memory stores waveforms that are displayed on the screen and waveform data that have been acquired in the past. The history feature allows you to any single waveform or display all waveforms (and highlight only the specified waveform). -
Page 213: Display Range (Start And End Record)
20 History Waveform Display (Scope mode only) Maximum Number of Waveform Acquisitions (Maximum number of history waveforms that can be stored in the acquisition memory) The number of history waveforms that can be stored varies depending on the selected record length as follows: Record Length Number of Waveforms With 4-CH Module... -
Page 214: Notes On Using The History Feature
20 History Waveform Display (Scope mode only) Notes on Using the History Feature • You can start waveform acquisition when the History menu is displayed. However, you cannot change the history feature settings while waveform acquisition is in progress. • When the acquisition mode is set to Average, you cannot use the history feature. •... -
Page 215: Position Information (Gps)
21 Position Information (GPS) If you connect a GPS unit, an accessory sold separately, position information based on GPS (Global Positioning System) can be obtained. Turning GPS Data On and Off Set whether to obtain a position information from GPS. •... -
Page 216: Ethernet Communication (Network)
22 Ethernet Communication (Network) You can configure TCP/IP parameters and use the optional Ethernet interface to perform the following tasks. TCP/IP TCP/IP settings for connecting to an Ethernet network. Set the IP address, subnet mask, and default gateway. Web Server (Web Server) You can connect the instrument as a Web server to a network. -
Page 217: Tcp/Ip (Tcp/Ip)
22 Ethernet Communication (Network) TCP/IP (TCP/IP) Configure the settings that the instrument needs to connect to a network. DHCP DHCP is a protocol that temporarily allocates settings that a PC needs to connect to the Internet. To connect to a network that has a DHCP server, turn the DHCP setting on. When DHCP is turned on, the IP address can be automatically obtained when the instrument is connected to a network. -
Page 218: Web Server (Web Server)
22 Ethernet Communication (Network) Web Server (Web Server) You can connect the instrument as a Web server to a network. Set the user name and password that will be used by devices on the network to access the instrument. Also, set the access timeout value. - Page 219 22 Ethernet Communication (Network) • You need Adobe Flash Player (version 8 and later) to use the Web server function. When visiting this Web site, the most recent Flash Player is automatically downloaded. If the download does not begin, please obtain the latest Flash Player from the Adobe Web site.
-
Page 220: Mail (Mail)
22 Ethernet Communication (Network) Mail (Mail) You can send trigger times and other information in emails to a specific email address as an action in the action feature. Mail Server (Mail Server) Specify the IP address of the mail server on the network that the instrument will use. In a network with a DNS server, you can specify the host name and domain name instead of the IP address. -
Page 221: Network Drive (Net Drive)
22 Ethernet Communication (Network) Network Drive (Net Drive) You can save waveform data and setup data to a network drive. FTP Server (FTP Server) Specify the IP address of the FTP server on the network that you want to save waveform or setup data to. In a network with a DNS server, you can specify the host name and domain name instead of the IP address. -
Page 222: Sntp (Sntp)
22 Ethernet Communication (Network) SNTP (SNTP) The instrument clock can be set using Simple Network Time Protocol (SNTP). The instrument can be configured to automatically adjust its clock when it is turned on. SNTP Server (SNTP Server) Specify the IP address of the SNTP server that the instrument will use. In a network with a DNS server, you can specify the host name and domain name instead of the IP address. -
Page 223: 23 Other Features
23 Other Features • System Configuration (System) • Network (Network) • Environment Settings (Preference) • File Operation (File) • Self-test (SelfTest) • Overview (Overview) System Configuration (System Configuration) The following settings can be configured. • Date and time on the instrument •... - Page 224 23 Other Features Checking the Standard Time Using one of the methods below, check the standard time of the region where you are using this instrument. • Check the Date, Time, Language, and Regional Options on your PC. • Check the website at the following URL: http://www.worldtimeserver.com/ •...
- Page 225 There is no need to install the USB TMC driver into your PC. • For information about how to obtain the YOKOGAWA USB TMC driver, contact your nearest YOKOGAWA dealer. You can also access the YOKOGAWA USB driver download website and download the driver (http:// www.yokogawa.com/ymi/).
-
Page 226: Network (Network)
23 Other Features Network (Network) Environment Settings (Preference) Logic Settings (Logic) Logic Channel Display Format (Numerical Format) Choose whether to display the logic waveform values in the numeric monitor as binary (Bit) or hexadecimal (Hex) values. Bit Order (Bit Order) •... - Page 227 23 Other Features Key and Touch Settings (Key/Touch) START/STOP Key Response Time (START/STOP Response Time) You can set the response time of the START/STOP key to instant (Quick) or 1 s or more (> 1sec). Key and Touch Lock (Key/Touch Protect) You can lock the control keys and touch panel to prevent unintentional changes to the current state of the instrument.
-
Page 228: File Operation (File)
23 Other Features Others (Others) Cursor Read Mode (Cursor Read Mode) You can select whether to perform cursor measurements on P-P compressed display data or the data that has been acquired in the acquisition memory. • Display Data (Display) Cursor measurements are performed on the display data. •... -
Page 229: Self-Test (Selftest)
Executes the selected item. If an Error Occurs during a Self-Test If an error occurs even after you carry out the following procedure, contact your nearest YOKOGAWA dealer. • Execute the self-test again several times. • Confirm whether or not the media being tested is properly inserted. -
Page 230: Overview (Overview)
23 Other Features Overview (Overview) You can display the following information about the instrument. The instrument numbers of the DL350 and the following modules are also displayed. 720211, 720221, 720241, 720243, 720254, 720250, 720266, 720268, 720281 The instrument numbers of other modules are not displayed. •... -
Page 231: Appendix
Appendix Appendix 1 How to Calculate the Area of a Waveform Integ1TY Sum of only the positive curve areas : S 1 + S 2 Integ2TY Sum of the positive and negative curve areas: S 1 + S 3 – S 2 Integ1XY (1) Multiple Loops Area S = n ×... - Page 232 Appendix Integ2XY (1) When Each Y Data Point Corresponds to a Single X Data Point Stop point Start point Area S = S X-axis (Y = 0) Start point Stop point Area S = –S X-axis (Y = 0) X-axis (Y = 0) Area S = –S Stop point Start point...
- Page 233 Appendix Appendix 2 About the FFT Function FFT Function Each frequency component G of a linear spectrum is represented by G=R + jI, where R is the real part and I is the imaginary part. Linear Spectrum The linear spectrum can be directly determined with the FFT. Through this spectrum, the magnitude and phase of each frequency component included in the measured waveform can be found.
- Page 234 Appendix Overall Value The overall value is the total RMS value determined from the frequency spectrum included in the signal. The overall value is the square root of the summation of the power spectrums of all frequencies. 2×PS + Σ PS Overall value = (Vrms) “Rms = overall value”...
- Page 235 Appendix Notes When Executing the FFT Computation Computation is normally performed on the sampled data in the acquisition memory. However, for waveforms that have been acquired in envelope mode, computation is performed on the maximum and minimum values per acquisition interval. App-5 IM DL350-01EN...
-
Page 236: Appendix 3 Fundamental Equations For Defining Strain
Appendix Appendix 3 Fundamental Equations for Defining Strain Definition of Strain ΔL/L = ε ..........(1) ε: Strain L: Initial length of the material ΔL: Amount of change due to external strain Definition of the Gauge Factor Gauge factor (K) refers to the ratio between the mechanical strain and the change in the resistance of the strain gauge resistor. -
Page 237: Appendix 4 About Shunt Calibration
Appendix Appendix 4 About Shunt Calibration Shunt calibration is a type of scaling in which the strain measurement gain is adjusted through the connection in parallel of a known resistance (the resistance for shunt calibration, hereinafter referred to as the shunt resistance) to the strain gauge. -
Page 238: Shunt Calibration Procedure
Appendix • When correcting the gain on the positive side Shunt calibration relay circuit Shunt resistor, when (Built into the strain module. correcting the positive side Turns on and off automatically when shunt calibration is Bridge+ executed.) 120 Ω Bridge In–... - Page 239 • Because the strain gauge is attached away from the bridgehead, we recommend that you use twisted wire for extensions. • Use a bridgehead with high noise resistance. We recommended that you use a YOKOGAWA bridgehead (701957 or 701958); they are highly resistant to noise.
- Page 240 Appendix Calculation of the Shunt Resistance To execute shunt calibration, you need to calculate the shunt resistance (Rs) and the expected strain (ε) in advance. For “P2-Y,” use ε as given in the equation below (normally a negative value). In the general method given for shunt calibration (the easy method), an error of 1 to 2% is introduced as the strain value (ε) increases. Therefore, use the detailed method whenever possible. Equation for Rs and ε When Shunt Calibration Is Executed General Equation (Easy method) ΔR/R = K × ε ..(1): Fundamental strain equation ΔR = R−R//Rs...
- Page 241 Appendix Calculation Example When Determining the Shunt Resistance (Rs) from the Strain (ε) Given a gauge factor (K) of 2, Detailed equation (equation B) Rs = R × (1−ε)/(2 × ε) ....(6) General equation (equation A) Rs = R × (1−2 × ε)/(2 × ε) ..(7) Degree of error of 1 to 2% Desired Strain Rs Value (Ω) Derived from the Rs Value (Ω) Derived from the ε (μSTR) Detailed Equation (6) General Equation (7) R = 120 Ω...
-
Page 242: Appendix 5 Frequency Module's Math Expression And Smoothing Filter's Filter Response
Appendix Appendix 5 Frequency Module’s Math Expression and Smoothing Filter’s Filter Response Computation Format (Resolution) of the Frequency Module The computation flow on the frequency module is indicated below. Input Binary Counter 625 ps resolution ↓ A (Float) Float Floating-point math Internally, all calculations are performed using Math operations... - Page 243 Appendix Filter Characteristics (Time Delay) of the Smoothing Filter The smoothing filter is a moving average filter in which computation is performed in real time. The smoothing filter takes the simple average of the data whose data update rate is 1 μs (1 MHz) over 40 μs and performs moving average at 40 μs intervals. The computation interval of moving average is constant, independent of the instrument’s sample rate. The data computed at 40 μs intervals is linearly interpolated to 1 μs data and transmitted. The moving average order (the number of averaged points) is specified in terms of time. The maximum value is 25000 points (when the time is set to 1000 ms).
-
Page 244: Appendix 6 List Of Preset Settings Of The Frequency Module
Appendix Appendix 6 List of Preset Settings of the Frequency Module Logic 5V Setup Item Value V Range ±10 V Coupling Probe Bandwidth Threshold 2.5 V Slope Chattering Suppression Pull Up Logic 3V Setup Item Value V Range ±5 V (Probe = 1:1) ±10 V (Probe = 10:1) Coupling Probe... - Page 245 Appendix Pull-up 5 V Setup Item Value V Range ±10 V Coupling Probe 1: 1 Bandwidth Threshold 2.5 V Slope Chattering Suppression Pull Up ZeroCross Setup Item Value V Range Coupling Probe Bandwidth Threshold Slope Rising Chattering Suppression Pull Up 100 VAC Setup Item Value...
- Page 246 Appendix User Setup Item Value V Range Coupling Probe Bandwidth Threshold Slope Chattering Suppression Pull Up When you select a preset, the setup items are automatically set to the values in the table. The meaning of Yes and No in the table is as follows: Yes: The setting can be configured.
-
Page 247: Appendix 7 Tcp And Udp Port Numbers
Appendix Appendix 7 TCP and UDP Port Numbers The TCP and UDP port numbers that are used on the Ethernet interface of the instrument are listed below. TCP Port Numbers Port Number Description Used For File Transfer [Default Data] FTP client, and a portion of the Web server File Transfer [Control] FTP client,* and a portion of the Web server... -
Page 248: Appendix 8 Firmware Version And New Features
Appendix Appendix 8 Firmware Version and New Features This manual covers DL350 firmware versions 1.10 and later. The following table contains new features that are available for each firmware version. If you are using an older version, you will not be able to use all the features described in this manual. -
Page 249: Appendix 9 Using Data Files (Wdf Files)
• To use the data in binary data files generated by the instrument on a PC, use the “WDF File Access Library” provided by YOKOGAWA. • To convert data into YOKOGAWA’s legacy file format (*.WVF + *.HDR), use the “Binary Data File Converter” provided by YOKOGAWA. - Page 250 The eight bytes immediately after the “XHDR” identifier contains the data size (in bytes) of the analysis information chunk. The content of the data is text information (described later), which closely resembles the information in YOKOGAWA’s legacy WVF and HDR files. Offset Type...
- Page 251 Appendix Description of Parameters in Analysis Information //YOKOGAWA ASCII FILE FORMAT A line that starts with “//” is a comment line. $PublicInfo A label that indicates common information. A label always starts with a dollar ($) mark The character code of the dollar mark is 0x24. FormatVersion Version number of this piece of analysis information...
- Page 252 Appendix The data types are shown below. Module/Data Type Bit Count Value Type VDataType 2-CH and 4-CH modules, SCAN, temperature SCAN, − Math LOGIC − 2 to16 Unsigned 2 to16 Signed 17 to 32 Unsigned CAN, CAN/LIN 17 to 32 Signed −...
- Page 253 Appendix Number of Label Item Description Notes Data Example Parameters A label indicating the beginning of common information Format File format version number 1.00 Version Model Measuring instrument model DL350 Endian Waveform data endianness Data Waveform data save format Fixed to Trace Trace $PublicInfo Format...
- Page 254 Appendix Number of Label Item Description Notes Data Example Parameters Label indicating the beginning of model-specific information Display How many points into the For WVF compatibility TraceTotal Point waveform data where Number measurement start point begins Model Firmware version number 3.01 Version Start...
- Page 255 Index Numerics cursor type (X-Y waveform) ..........14-4 Page cycle averaging..............12-7 16-CH module, notes about using ........1-8 cycle frequency..............6-12 16-CH module sampling timing ..........1-8 cyclic statistical processing..........10-9 Page Page AC..................4-8 data format ................8-3 ACCEL ..................
- Page 256 Index fundamental frequency ............15-2 measurement resolution ............4-7 FV settings................4-36 mesial ................10-13 message format (CAN) ............4-48 message (SENT) ..............4-57 Page gain ..................4-34 Page gain adjustment ..............4-17 gauge factor................ 4-29 network drive ..............22-6 GND ..................
- Page 257 Index search ................. 19-1 vertical cursor (X-Y waveform) ........... 14-4 self-test ................23-7 vertical position ..............4-12 sensitivity ................4-35 vertical scale ..............4-5, 13-2 sensor settings ..............4-29 voltage measurement ............4-4 SENT message reading ............. 4-57 voltage measurement (16-CH module) ..... 4-20, 4-25 SENT signal monitoring ............
- Page 258 nbn Austria GmbH Riesstraße 146, 8010 Graz Tel. +43 316 40 28 05 | Fax +43 316 40 25 06 nbn @ nbn. at | www. nbn. at...
Need help?
Do you have a question about the ScopeCorder DL350 and is the answer not in the manual?
Questions and answers