Table of Contents
Advertisement
Quick Links
Advertisement
Table of Contents

Related Manuals for Sper scientific 800048


Summary of Contents for Sper scientific 800048
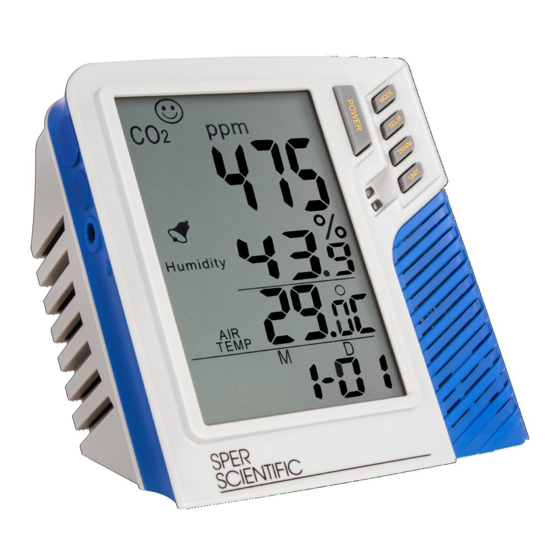
- Page 1 IAQ Monitor & Datalogging IAQ Monitor 800048 & 800049 Instruction Manual...
- Page 2 IAQ Monitor 800048 & Datalogging IAQ Monitor 800049 Copyright ©2014 by Sper Scientific ALL RIGHTS RESERVED Printed in the USA The contents of this manual may not be reproduced or transmitted in any form or by any means electronic, mechanical, or other means that do not yet exist or may...
-
Page 3: Table Of Contents
TABLE OF CONTENTS 1. INTRODUCTION ....4 2. FEATURES ....5 3. -
Page 4: Introduction
INTRODUCTION Poor air quality may cause fatigue, loss of concentration, and illnesses such as Sick Building Syndrome. Sper Scientific Indoor Air Quality (IAQ) monitors are ideal for crowded indoor public spaces with potentially high levels of carbon dioxide (CO2) such as offices, factories, classrooms, hospitals, and hotels. -
Page 5: Features
FEATURES • Monitors CO2, RH, and Air Temperature • Large LCD display • Easy-to-understand icons indicate air quality levels • Stable and accurate NDIR sensor • Minimum and Maximum Readings • Visual Alarms • Automatic baseline calibration • Desktop or wall mount capability MATERIALS SUPPLIED •... -
Page 6: Front Panel Description & Lcd Display
FRONT PANEL DESCRIPTION & LCD DISPLAY... -
Page 7: Lcd Display
19.CE Certificate............20.CO levels and guide lines........MATERIAL SUPPLIED 1. POWER - Power on/off, enter setting mode (1) Meter CO monitor. (2) Adaptor (9V+10%, >=0.5A) (98536~539 only) 2. MODE - Min/Max ir temperature and (3) Operation manual This CO monitor is 3. -
Page 8: Calibration
with ABC (Automatic Baseline Calibration) function which establishes a baseline calibration to eliminate the zero drift of the infrared sensor. ABC CALIBRATION The ABC function is always “ON” when the meter is turned on. ABC is designed to calibrate the meter at the minimum CO The monitor defaults to automatic baseline calibration reading detected during 15 days continuous monitoring (During (ABC) when the unit is turned on. - Page 9 MANUAL CO2 CALIBRATION Note… Manual calibration is not recommended unless the unit can be kept in a 400 ppm CO2 environment for at least 12 hours. 1. Set the monitor in an area with stable ambient conditions and no people, or other sources of CO2. 2.
-
Page 10: Measurement Procedures
MEASUREMENT PROCEDURES For the most accurate measurement, do not place the monitor close to any source of CO2. Note… Measurement response time is 10 seconds for CO2 and 2 seconds for RH. If the operating environment changes, it takes approximately 30 seconds for the CO2 sensor to respond and 30 minutes for the RH sensor to stabilize. -
Page 11: Minimum & Maximum Readings
Press MODE button to get MAX or MIN reading, under MAX or MIN mode, Long press MODE button to clear Max.or Min records,display will back to normal Minimum and Maximum Readings measuremnt.If current CO reading is near MAX or MIN you will not be easy to see the difference. -
Page 12: Monitor Setup
Monitor Setup: Date and Time Note… To exit Setup Mode at any step in the process, press POWER for one second. 1. Press POWER to enter Setup Mode. 2. “2013” will flash. Press SEL/R to select the current year, once set, press TRH/M to save the selection and move to the next setting. -
Page 13: Co2 Alarm Setting
After the real date and time is set, the meter will show “A- on on the top layer of display, press ” SEL./R button to select Alarm on or off. If alarm is on, press TRH/M button to Monitor Setup: CO2 Alarm (model 800049) save the setting and move to Co alarm setting. -
Page 15: Appendix - Datalogging (800049)
Appendix Datalogging IAQ Monitor 800049... -
Page 16: Software Installation
SOFTWARE INSTALLATION Installing the USB Logger Driver for Windows 1. Insert the CD into your computer’s CD drive. 2. The Auto Play dialogue box appears. Click on “Open folder to view files” to view the file names on the disc. 3. - Page 17 Note... Some software may not be available to download because it needs to be purchased. If you find that the software you need is not available, please contact our Customer Support at 480.948.4448 or email info@sperscientific.com for further assistance. Installing the Logger Software for Windows 8.
-
Page 18: Datalogger Settings
RUNNING THE SOFTWARE FROM WINDOWS 1. Connect the mini-USB end of the cable to the corresponding port on the side of the monitor. 2. Insert the USB cable into the USB port on your computer. 3. Open the Start Menu and select the “Data Logger” Icon from the programs list. - Page 19 2. Remember the Comm port number and go back to software. 3 Click “Setting” ”Comm port “ select the port number as you see from 3. Click “OK” to finish. step 1, then press OK button. Logger Setting (98536.98537.98538.98539 only) Troubleshooting the Communication Port Setting If the software does not recognize that the logger is plugged into the USB port you should verify that the communications...
- Page 20 Manual set COM port: If software message box show 1.Click My computer Conten “ ”” Basic Logger Setting manager to find the listed ( ” The basic menu allows you to designate a name for your below with red line. If you m means the logger is connec logger and specify the current date and time.
- Page 21 1. Select “Log Setting” from the Setting options. The Logger Setting menu displays. 2. Select the “Alarm & Sensor” tab. 3. The default alarm value of 1000 ppm displays. Adjust the ▲or ▼indicators to change the value. Alternatively, click on the field and type in the new value. Continue by setting the logger sampling parameters, below.
- Page 22 Logger Setting (98536.98537.98538.98539 only) Setting Roll Over Mode This option allows for continued recording even when the monitor is full. After the data limit has been reached new readings will be recorded over the earliest record. 1. Adjust the ▲or ▼indicators to specify the number of sample points, in thousands, from 1000 ►...
- Page 23 Setting Schedule Mode This option allows you to pre-set the date and time that the monitor will automatically begin recording. Note… The date and time formats must be Month/Day/Year and H:M:S. 1. Adjust the ▲or ▼indicators to specify the number of sample points, in thousands, from 1000 to 32,000.
-
Page 24: Data Sampling & Recording
DATA SAMPLING AND RECORDING Note… When the monitor is disconnected from the computer, a “No port found” error message will display. This will not affect the data sampling and recording. Click “OK” to continue. Sampling and Recording in Immediate Mode 1. - Page 25 Sampling and Recording in Schedule Mode 1. Disconnect the USB cable from the computer and monitor. Place the monitor in the desired location for sampling. 2. At the scheduled start date and time, the green LED will flash to indicate that the logger is recording data. 3.
-
Page 26: Downloading Data
DOWNLOADING DATA 1. Connect the mini-USB end of the cable to the corresponding port on the side of the monitor. 2. Insert the USB cable into the USB port on your computer. 3. Open the Start Menu and select the “Data Logger” Icon from the programs list. - Page 27 Viewing the Graph Note… To display the values for a specific data point, click the left mouse button to move the red cursor (located on the red vertical line) to the desired point on the graph. You may also hold down the left mouse button and drag the cursor to the desired point.
- Page 28 Printing the Graph 1. Click the Printer Icon button to print the graph. 2. Click “OK” to confirm the selection. Viewing and Printing Data Tables 1. Click the “View” button and select “Data Table” to view the data in table format. 2.
-
Page 29: Troubleshooting
TROUBLESHOOTING Note… Take care not to drop the monitor; this could cause malfunctions which require service. Error Code Description E-1: CO2 sensor malfunction E-2: Humidity sensor malfunction E-3: Temperature sensor malfunction E-4: Operating temperature is too high E-5: Operating temperature is too low E-6: Hardware malfunction... -
Page 30: Power Supply
Note… Failure to use the correct power configuration will damage the monitor. CE CERTIFICATE This Sper Scientific Instrument complies with EMC directive 2004/108/EC. Technical standards for emissions: • EN 61326-1:2006 Class B • EN 55011:2009/A1:2010 Group 1 Class B Immunity EN 61326-1:2006 •... -
Page 31: Specifications
0.1 °C ± 0.6 °C (-10 to 50°) otherwise ± 1.2 °C -14 to 122 °F 0.1 °F ± 2.5 °F 800048 10% to 90% 0.1% ± 5% (at 25 °C & 10 to 99% RH) 800049 0.1% to 99.9% otherwise ±7%... -
Page 32: Warranty
If your model has since been discontinued, an equivalent Sper Scientific product will be substituted if available. This warranty does not cover probes, batteries, battery leakage, or damage resulting from accident, tampering, misuse, or abuse of the product.
Need help?
Do you have a question about the 800048 and is the answer not in the manual?
Questions and answers