Table of Contents
Advertisement
Advertisement
Table of Contents

Subscribe to Our Youtube Channel
Related Manuals for Spectrum Technologies WatchDog 2400

Summary of Contents for Spectrum Technologies WatchDog 2400
- Page 1 ® 2000 Series Mini Stations PRODUCT MANUAL Model #’s 2400, 2425, 2450, 2475...
-
Page 2: Table Of Contents
CONTENTS General Overview Specifications for Internal Sensors External Sensors Station Installation Configuring the Data Logger Connecting to a PC/ Battery Replacement Clearing the Loggers Memory Keypad Display Setting the Time and Date Setting the Display Units Setting the Degree Day Counter Setting the Chill Hour Counter Resetting the Disease Models Archives... - Page 3 Light Plant-Specific Light Requirements General Light Requirements Grape Powdery Mildew Grape Mills Table Grape Black Rot Apple Scab/Apple Sooty Blotch Apple Mills Table Tom Cast References CE Declaration of Conformity...
-
Page 4: General Overview
General overview Thank you for purchasing a WatchDog 2000 Series Mini Station. The loggers are completely waterproof and fea- ture 12-bit resolution for higher accuracy. The loggers can be accessed at different times by multiple users be- cause the data is not cleared from memory following a download. -
Page 5: Specifications For Internal Sensors
Specifications Internal sensors Model # Internal Measurement Accuracy Sensors Range None 2400 Temperature -25° to 212°F ±1°F 2425 -32° to 100°C ±0.6°C -25° to 212°F Temperature -32° to 100°C ±1°F 2450 - - - - - - - - - - - - - - - - ±0.6°C Humidity 10% to 100%... -
Page 6: External Sensors
External Sensors All WatchDog 2000 Mini Station models have external channels (ports) for additional sensor input. The following table lists some of the available optional sensors. See www.specmeters.com for a complete list. Most sensors include a 6-foot cable with pin-type connector. Items 3667-20, 6460-20, 6470-20 and 6450WD20 have 20 foot cables. - Page 7 External Sensors (cont.) To connect the external sensor to the station, plug the sensor cable into the station port that has been programmed for that particular sensor. Port A is the only channel that will record rainfall data. Program each channel (port) to a specific sensor through the SpecWare launch screen.
-
Page 8: Station Installation
Station Installation The data logger has the versatility to be located in any micro-climate for recording weather data. Hardware is included for attaching it to a 1” to 1¼” outside diameter mast (pipe). Use a 5’ - 10’ length of conduit or pipe as the mast mount. -
Page 9: Configuring The Data Logger
Configuring the Data Logger The 2000-Series data logger does not have a button or switch for powering up and down. Instead, the device is operational whenever the batteries are installed. The log- gers are shipped with default logging settings that can be modified with SpecWare software (see SpecWare User’s Guide for details). -
Page 10: Connecting To A Pc/ Battery Replacement
Please consult the SpecWare User’s Guide or Spectrum Technologies’ online troubleshooting resource if you experience difficulty connecting to the logger. Whenever the batteries are replaced, the time and date must be reset immediately so the data is time-stamped cor- rectly. -
Page 11: Clearing The Loggers Memory
Clearing the Logger’s memory The memory of the 2000-Series data logger is not auto- matically cleared when the logger is downloaded or the batteries are replaced. The logger can be cleared manual- ly through SpecWare software. This may be desired if, for example, the logger is being shut down for the season or is being moved to a new location. -
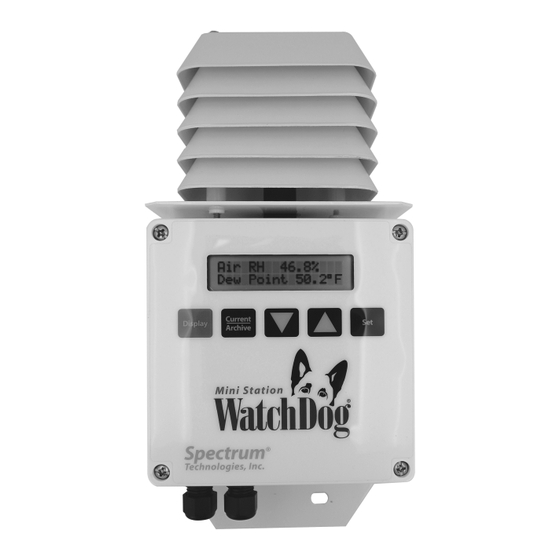
Page 12: Keypad Display
Keypad/Display The keypad of the 2000-Series data logger allows you to scroll through all measured and calculated parameters available on the LCD. It is necessary to use the keypad to set the date and time for the data being stored in the long- term memory. -
Page 13: Setting The Time And Date
Setting The Date and Time 1. Press Display. 2. Press Set. Select Parameter To Be Set (↑↓) 3. Press the down arrow key once to reach the Time & Date screen. TIME & DATE Press SET 4. Press Set. 09-22-13 11:45AM Press SET 5. -
Page 14: Setting The Display Units
Setting The Display Units If the display is off, press Display to turn it on. 1. Press Set. Select Parameter To Be Set (↑↓) 2. Use arrows to scroll to display units. DISPLAY UNITS Press SET 3. Press Set. 4. Use the arrow keys to choose data in English or metric units. -
Page 15: Setting The Degree Day Counter
Setting The Degree-Day Counter Caution: Be careful when entering a parameter update screen for a degree day counter when that counter is ena- bled. If the Set key is pressed, the counter status will be- come modifiable and the archives WILL BE ERASED. If this is not desirable, press one of the arrow keys instead of the Set key to exit the screen. -
Page 16: Setting The Chill Hour Counter
Setting The Chill Hour Counter Caution: Be careful when entering a parameter update screen for a chill hour counter when that counter is ena- bled. If the Set key is pressed, the counter status will be- come modifiable and the archives WILL BE ERASED. If this is not desirable, press one of the arrow keys instead of the Set key to exit the screen. -
Page 17: Resetting The Disease Models
Resetting Disease Models This option restarts the disease model calculations and should be done at the beginning of the season. If the display is off, press Display to turn it on. 1. Press Set. Select Parameter To Be Set (↑↓) 2. -
Page 18: Archives
Archives The data logger features two archives that allow you to look at historical data for that location. The archives are regularly updated whenever the data logger is actively col- lecting data. The archives are accessed by pressing the Current/Archive key. Daily Archive The Daily Archive retains the last 30 days of data. - Page 19 Archives (Cont) Note: If an active Degree Day counter is disabled or reset, the entire archive for that counter will be erased Disabling a Degree Day counter does not affect the storing of data in memory and, thus will not affect any of the SpecWare report functions.
-
Page 20: Screens
Screens The following figures give examples of what each of the various weather monitor screens look like. -Initial information screen Model 2450 v 1.1 Apple IPM Alert This is the first screen that comes up when you turn on the logger. - Page 21 Screens (Cont.) -Degree Day Counter DD #1 50-86 Since 07/12 2125 This screen shows the information for Degree Day Coun- ter #1. This counter is using a temperature range of 50 to 86°F. So far it has accumulated 16 Degree Days (DD) for today’s date and has accumulated 2125 since the counter was started or reset on July 3.
-
Page 22: Degree Days/Chill Hours
Degree Days/Chill Hours Degree Days Temperature is a key factor contributing to the develop- ment of plants, insects and plant diseases. Degree Days are a way to quantify the amount of heat that is available, which is a function of the time the temperature is within a given temperature range. -
Page 23: Activating Optional Disease Models
Series data logger, this option must be activated with SpecWare. This will require an authorization code that can be obtained by calling Spectrum Technologies. You will be asked for the Serial and Registration numbers that appear on the “Spec9 Pro” information screen (see figure below). - Page 24 Activating Optional Disease Models (Cont.) All disease models require, at least, air temperature and leaf wetness data. Therefore, an additional leaf wetness sensor must be purchased and connected to port B on the logger. If a model 2400 is set for disease models a tem- perature sensor needs to be plugged in to port D.
-
Page 25: Light
Light The quantum sensor approximates PAR light, the radiation between 400 and 700 nanometers. These are the most influential wavelengths for optimum plant growth. PAR light is necessary for the plant to function properly. Light requirements differ between crops, but the rule of thumb is to allow the maximum amount of light possible. -
Page 26: Plant-Specific Light Requirements
Plant-Specific Light Requirements Light quantity is measured in a daily light integral (DLI) which refers to the total amount of light a plant receives in one day. A plant requires a minimum DLI just like it re- quires a certain amount of rainfall. The following values were obtained from a set of experiments performed at Clemson University. - Page 27 Plant-Specific Light Requirements SUMMER EXPERIMENT The summer experiment measured outdoor plant develop- ment at 0% shade (38 mol/day), 50% shade (15 mol/day), 70% shade (6 mol/day), and 90% shade (3 mol/day). Plant Commercially Highest Acceptable Quality Quality Agertum 15 mol/day >...
-
Page 28: General Light Requirements
General Light Requirements Light Quantity Results (Daily Light Integral- DLI) < 5 mol/day Produces poor quality plants Produces commercially acceptable plants 5-10 mol/day Produces high quality plants for shade- adapted species 10-20 mol/day Produces high quality plants... -
Page 29: Dif
The model 2475 includes temperature, relative humidity and light sensors. This unit displays DIF, which is the average day temperature minus the average night tempera- ture. This value is used to determine stem elongation. When day temperature is warmer than night temperature (positive DIF value) plants will become taller. -
Page 30: Vpd
The model 2475 Plant Growth Station displays VPD on the unit. VPD can be calculated in SpecWare Custom Re- ports for all models. Firmware 3.8 and SpecWare 9 Pro or higher is needed to use VPD. VPD (vapor pressure deficit) is the difference between how much water vapor is in the air and how much water vapor the air can hold at saturation. - Page 31 VPD (cont.) Then, press the New Column button. Select RH, Primary, and VPD. Press OK. Use the Where and When tab to change the dates of data used to generate the report, and the View Report tab to view VPD values.
-
Page 32: Grape Powdery Mildew
Grape Powdery Mildew This option predicts two infectious stages, an ascospore stage and a conidial stage (Thomas, Gubler, and Leavitt 1994; Weber, Gubler, and Derr 1996) Ascospores are released in the spring from the structure in which the disease overwintered. Conidial spores are the result of an ascospore infection. -
Page 33: Grape Mills Table
Grape Mills Table Hours of Leaf Wetness required Daily Average for heavy ascospore infection Temperature (F) (2/3 original Mills value) 27.3 25.3 23.3 48-49 19.3 17.3 16.7 54-55 56-57 14.7 58-59 60-61 13.3 12.7 63-75 12.7 17.3 Conidial Index: 0 - 30 = Light infection risk 40 - 50 = Medium infection risk 60 - 100 = Heavy infection risk... -
Page 34: Grape Black Rot
Grape Black Rot Black Rot is a disease caused by the fungus Guignardia bidwelli. It overwinters in in old mummified berries. In spring, the primary inoculum is released which starts the initial round of infection. Those initial spores are dis- persed by rain and wind. -
Page 35: Apple Scab/Apple Sooty Blotch
Apple Scab Apple Scab Sootyblotch Flyspec This option predicts the approximate “Infection Degree” for Apple Scab. The infection severity (None, Light, Me- dium, or Heavy) is triggered by the accumulation of sufficient hours of leaf wetness that occur between the base and upper temperature limits. -
Page 36: Apple Mills Table
Apple Mills Table Approximate numbers of hours of wetting required for primary apple scab infection at different air temperatures Average Degree of Infection (hrs) Temp. (°F) Light Medium Heavy 63 to 75 11..5... - Page 37 Apple Mills Table Approximate numbers of hours of wetting required for primary apple scab infection at different air temperatures Average Degree of Infection (hrs) Temp. (°F) Light Medium Heavy 14.5 33 to 36...
-
Page 38: Tom Cast
Tom-Cast This option uses Tom-Cast, a tomato disease forecasting program designed to predict Early Blight, Septoria Leaf Spot, and Anthracnose. (Pitblado ~1985; Bolkan and Reinert 1994) Tom-Cast calculates a disease severity value (DSV) to predict the development of these diseases. An increasing number of leaf wetness hours and a higher temperature cause the DSV to increase at a faster rate. -
Page 39: References
Refferences Bolkan, M. A. and W. R. Reinert. (1994). Developing and Implementing IPM Strategies to Assist Farmers: An Industry Approach. Plant Disease, 78:545-550. Faust, James E. “Light Management in Greenhouses” 2002. http:// www.firstinfloriculture.org/pdf/2002-5_LightManagement_pt_1.pdf (2002-Nov-26) Holcombe, Veronda B., Kelly Lewis, and James E. Faust. “How Much Light Do Bedding Plants Really Need?”... -
Page 40: Ce Declaration Of Conformity
Spectrum is not responsible for any package that is returned without a valid RMA number or for the loss of the package by any ship- ping company. DECLARATION OF CONFORMITY Spectrum Technologies, Inc. 3600 Thayer Court Aurora, IL 60504 USA Model Numbers:...
Need help?
Do you have a question about the WatchDog 2400 and is the answer not in the manual?
Questions and answers