Table of Contents
Advertisement
Quick Links
Download this manual
See also:
Service Manual
Advertisement
Table of Contents

Related Manuals for Seintek S2800

Summary of Contents for Seintek S2800
- Page 1 PROGRAMMABLE AUTOMOTIVE SCOPE METER User’s Manual S2800_E200611_R01...
- Page 2 Programmable Automotive Scope...
-
Page 3: Table Of Contents
Contents 1. Easy Manual ................1-1 1.1. Turning on and off ................1-1 1.2. Division, Trigger and Function key ............1-2 1.3. Input Terminals ..................1-2 1.4. Command, Arrow, Backlight and Help key ........... 1-2 1.5. Primary Menu Map ................1-3 1.6. - Page 4 5.1.9. Acquiring the Waveform ..............5-4 6. Triggering on a Waveform ............6-1 6.1. Setting Trigger level (on NORmal trigger mode) ........6-1 6.2. Making a single acquisition ..............6-1 6.3. Setting Trigger mode (Tmode) ............. 6-2 6.4. Setting AUTO Trigger Level ..............6-2 6.5.
- Page 5 10.1.16. MAP Analog ..................10-9 10.1.17. MAP Digital ..................10-10 10.1.18. MAF Analog ................... 10-10 10.1.19. MAF HF Digital ................10-11 10.1.20. MAF LF Digital ................10-11 10.1.21. EGR PFE ..................10-12 10.1.22. EGR DPFE ..................10-12 10.2. ACTUATOR Function Test ............... 10-13 10.2.1.
-
Page 6: Easy Manual
Easy Manual TRIG I / O FUNC 600V 600V 600V Front View 1.1. Turning on and off TRIG ① Pressing this button for 1 to 2 seconds will turn the unit on. I / O FUNC Pressing this button again will turn the power off. -
Page 7: Division, Trigger And Function Key
1.2. Division, Trigger and Function key ① Division key: Adjusts vertical division or Horizontal division. TRIG ② Trigger key: Adjusts Trigger level. Selects Single shot mode. Selects trigger setup. I / O FUNC ③ Function key: Selects Scope Setup. Selects Automotive scope setup. 600V 600V 600V... -
Page 8: Primary Menu Map
1.5. Primary Menu Map Default Menu Division Menu Trigger Menu Function Menu 1.6. Positioning the waveform on the screen ① Pressing moves the waveform up. ② Pressing moves the waveform down. ③ Pressing moves the waveform left. TRIG ④ Pressing moves the waveform right. -
Page 9: Division Key Map
1.7. Division key map ① Pressing calls up the default division menu. ② Press to control the Channel B Vertical Division. ③ Press to change the Horizontal TRIG Division. I / O FUNC ④ Press to exit. 600V 600V 600V 1.8. -
Page 10: Changing Horizontal Division
1.9. Changing Horizontal division ① Pressing button increases Horizontal division (H/div). ② Pressin button decreases Horizontal division (H/div). TRIG ③ Pressing key will change Div from MANUAL to AUTO( ). I / O FUNC 600V 600V 600V 1.10. Trigger key map ①... -
Page 11: Trigger Level Control
1.11. Trigger level control Trigger point indicator Trigger level indicator ① Pressing button increases the Trigger level. ② Pressing button decreases the Trigger level. TRIG I / O FUNC 600V 600V 600V 1.12. Function key map ① Press key to display the FUNCtion default menu. -
Page 12: Sensor Tests
1.13. Sensor tests ① Press key to display automotive sensor tests. ② Press key for more sensor tests. ③ Press key for previous sensor tests. ④ Press to exit. 1.14. Actuator tests ① Press key for Actuator tests. ② Press to exit. -
Page 13: Ignition & Electrical
1.15. Ignition & Electrical ① Press key for Ignition & Electrical tests. ② Press to exit. -
Page 14: Test Examples
Test Examples 2.1. Battery Voltage test Battery location and test TRIG ① for about 2 sec. to turn on the meter. ② Insert the black lead in the COM input sockets. I / O FUNC ③ Insert the red lead in the CHA input sockets. - Page 15 ⑥ Check the measurement voltage. Note If the meter reads negative, the battery has been reverse charged (has reversed polarity) and should be replaced, or the meter has been connected incorrectly. Battery voltage (V) State of charge 12.6 or higher 100% charged 12.4 75% charged...
-
Page 16: O2 Sensor (Oxygen Sensor)
2.2. O2 Sensor (Oxygen Sensor) O2 Sensor location and test ① Press for 3 seconds to turn on the TRIG meter. ② Insert the black lead in the COM input I / O FUNC sockets. ③ Insert the red lead in the CHA input sockets. 600V 600V 600V... - Page 17 ⑥ Press (Sens) TRIG AUTOMOTIVE (SENSOR) □ ABS Sensor □ O2 Sensor □ ECT Sensor □ FUEL TEMP □ IAT Sensor □ Knock Sensor Automotive (SENSOR) is displayed as left. □ TPS Sensor □ CKP Mag □ CKP LoRes □ CKP HiRes □...
- Page 18 Memory menu is displayed as left. ⑪ Pressing (R/WFM) button displays the General O2 Sensor waveform as left. ⑫ Press button to return to the default menu. O2 sensor waveform is displayed in the default menu. ⑬ Connect the black test lead to engine chassis.
- Page 19 Note 1) Refer to Easy manual for changing the Vertical division or Horizontal division. 2) Refer to Easy manual for triggering on a waveform. Note The oxygen sensor output voltage is used to control the fuel system air/fuel ratio. The output of the sensor varies depending on the oxygen level sensed in the engine exhaust gases and the operation of the closed loop fuel system.
-
Page 20: Introduction
Introduction 3.1. Main Features This Programmable Automotive Scope Meter offers enhanced features that similar type test instruments on the market today don't have. All the functions are designed to be very convenient to use. You can quickly get used to working with this METER and the great many functions integrated inside. -
Page 21: Specification
3.3. Specification 3.3.1. General Specifications 1) Operational Temperature: 0°C to +50°C (+32°F to +122°F) at a relative humidity 75% or less 2) Storage Temperature: -20°C to +60°C with a relative humidity of 75% less 3) Temperature Coefficient: 0.1 x (Specified Accuracy) per °C for temperature <18°C to >28°C 4) Max. -
Page 22: Technical Specification
3.3.2. Technical Specification 1) Oscilloscope Function (1) Horizontal Sample Rate 50 MS/s (Single CH mode), 25 MS/s (Dual CH mode) Record Length 512 single shot mode, 256 in all modes Sample / Division Modes Single shot, Roll, Normal Accuracy 0.01% Sweep Rate 1uS to 5S in 1, 2, 5 sequence (2) Vertical... - Page 23 2) Digital MultiMeter Function DC V Scope V/Div DMM Range Resolution Accuracy Impedance 0.5, 1, 2 0.001V ±(0.3%+3) 5, 10, 20 0.01V 1 MΩ 50, 100, 200 500V 0.1V ±(0.5%+5) 1000V 0.1V AC V Accuracy (Hz) Scope V/Div Resol. Imped. Range 50~450 0.45k~5k...
-
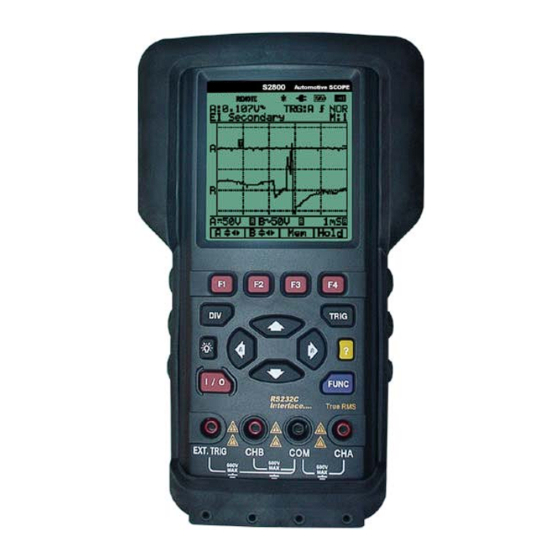
Page 24: Product Description
Product Description In this chapter, the LCD, front panel buttons, controls and terminal are described. TRIG I / O FUNC 600V 600V 600V [Front View]... -
Page 25: Lcd Area
4.1. LCD Area The screen is divided into five areas: Indicator area, Reading area, Waveform area, Setting area and Menu area. Refer to Figure below. [LCD Display] 1) Indicator ▪ HOLD: Freezes display in the LCD ▪ REMOTE: RS232 or USB Output indicator ▪... -
Page 26: Keys Area
7) Memory Address ▪ 0 to 7 8) Live Scope Display (Channel A) Displays real time waveforms and freezes held captures. 9) Channel B or Reference Display 10) Channel A Vertical Division 11) Channel B Vertical Division 12) Horizontal Division (Time base) 13) Command Menu Field 4.2. - Page 27 Arrow keys Use the black arrow keys to highlight the item. The cursor to be changed is moved to up with this button. Pushing the ① button will increase the value or position. The cursor to be changed is moved to down with this button. Pushing ②...
- Page 28 Back light key Activates Back Light for the LCD Toggles backlight ON and OFF. Help key Aids the technician in correct operation and efficient use of the meter. Power switch Turns the instrument ON or OFF. Function Key Set Scope, Auto Scope and Setup of the METER ①...
- Page 29 ▪ Automotive Scope Sensor ① FUNC F2 (Automotive Scope) Sens Actu Ig&El Exit ② FUNC F2 (Automotive Scope) F1 (Sensor) AUTOMOTIVE (SENSOR) □ ABS Sensor □ O2 Sensor □ ECT Sensor □ FUEL TEMP □ IAT Sensor □ Knock Sensor □...
- Page 30 ▪ Automotive Scope Actuator ① FUNC F2 (Automotive Scope) Sens Actu Ig&El Exit ② FUNC F2 (Automotive Scope) F2 (Actuator) AUTOMOTIVE (ACTUATOR) □ Injector C/LIM □ Injector N/LM □ Injector PN □ Mixture Control Solenoid □ EGR Control Sol. □ ISC Step Motor □...
-
Page 31: Terminal Area
▪ Setup of the Meter ① FUNC F3 (Set Up) Set Up ■ ON □ OFF BEEFER AUTOPOWER OFF ■ NONE □ 15 MIN □ 30 MIN □ 45 MIN BAUD RATE □ 1200 □ 2400 □ 4800 ■ 9600 NO OF STROKES ↔: 4 NO OF CYLINDERS ↔: 4 CONTRAST ↔:... -
Page 32: Using The Meter
Using the METER 5.1. Safely Using the Test Tool 5.1.1. Attention Carefully read the following safety information before using the test tool. 5.1.2. Safety Precautions Specific warning and caution statements, where they apply, will be found throughout the manual. A Caution identifies conditions and actions that may damage the test tool. A Warning identifies conditions and actions that pose hazard(s) to the user. -
Page 33: Making Selections In A Menu
5.1.5. Making Selections in a Menu Subsequently follow steps ① to ⑤ to open a menu and to choose an item. Open the FUNCTION menu. ① Scope AScop SetUp Exit Open the Scope Setup menu. SCOPE SETUP INPUT A: INPUT B: ■... -
Page 34: Freezing The Screen
Now, you will see only CHA on the screen. Key: 1) To choose a Frequency measurement for CHA, do the following: ① Plug the black test lead into the COM input jack. ② Plug the red test lead into the CHA input jack. Open the FUNCTION menu. -
Page 35: Changing The Graphic Representation
5.1.8. Changing the Graphic Representation 1) Changing the vertical division Open the Command Menu. ① A/div B/div H/div Exit ② Change the vertical division. (CH A or CH B) Increase the vertical division ③ Div is changed to manual mode. Decrease the vertical division. - Page 36 1) Recording Slow Signals over a Long Period of Time ③ Highlight ROLL MODE. ④ Set ROLL MODE. ⑤ Exit. Key: The roll mode function supplies a visual log of waveform activity and is especially useful when you measure lower frequency waveforms. Note ROLL MODE operates when the horizontal division is between 1s and 5s Selecting AC-Coupling for INPUT A...
-
Page 37: Triggering On A Waveform
Triggering on a Waveform Triggering tells the METER when to begin displaying the waveform. You can select which input signal should be used, on which edge this should occur and you can define the condition for a new update of the waveform. The right-top line of the LCD identifies the trigger parameters being used. -
Page 38: Setting Trigger Mode (Tmode)
6.3. Setting Trigger mode (Tmode) Open the Trigger menu ① Tlvl Singl Tmode Exit Open the Trigger Setup TRIGGER SETUP SOURCE: SLOPE: ■ CHA □ □ ■ □ EXT ② TRIGGER MODE: □ AUTO ■ NOR Exit ③ Highlight the ITEM you want. ④... -
Page 39: Setting Normal Trigger Mode
6.5. Setting Normal Trigger mode Highlight NOR. ④ Set NOR. ⑤ Exit. Adjust the Trigger Level continuously. Observe the trigger icon on the second time division line indicates the trigger level. Key: 6.6. Setting Trigger Slope ③ Highlight ④ ⑤ Exit. -
Page 40: Storing And Recalling Screens
Storing and Recalling Screens You can store setups and waveforms to memory and recall them again from memory. Eight (0-7) setup and waveform memories are available. Store waveforms when you want to use the present waveform images for future reference. Store setups when you need the present operating configuration for your future measurements. -
Page 41: Recalling Screen
7.2. Recalling Screen To recall a screen, do the following: ① Default Open the memory menu R/wfm Exit ② Memory field (M;0) appears at the top-right corner of the display area. ③ Select the memory address you want to recall from. ④... -
Page 42: Remote Interface Operations
Remote Interface Operations This section explains how to install the USB device driver. If you have any questions after reading this information, please contact your local service representative. 8.1. USB HID Device Installation 8.1.1. System Requirements Desktop or Laptop computer with: 1) The IBM PC or Compatible Computer. - Page 43 [Figure 1: System Properties] 6) Right click on the Human Interface Device to open the Properties dialog which contains the description and status of the HID device. [Figure 2: Device Manager]...
-
Page 44: To Install Windows Application Software
8.3. To install Windows Application Software 1) Insert the HandyScope software installation guide CD into the CD-ROM drive of your PC. ® 2) Open Windows Explorer and double-click the CD-Rome drive. 3) Auto Run or Windows users can simply double click on Setup.exe’. [Step 1: Choose Setup Language] [Step 2: Preparing to Install] [Step 3: Welcome to the…... -
Page 45: Running The Application Software
8.4. Running the Application Software 1) For using USB port your PC should have USB port. Connect USB cable to HandyScope at one end and to PC at other end. 2) Turn the HandyScope on. 3) Click [Start Programs HandyScope HandyScope] The HandyScope window will pop up as below 8.4.1. - Page 46 Display Area ① Sampling Time (0.001 to 9999) ② Trigger level indicator (-T) ③ Trigger point indicator (T) Control Panel Area ④ Channel A (Vertical Position, Division, Auto, ON/Off and DC coupling) ⑤ Channel B (Vertical Position, Division, Auto, ON/Off and DC coupling) ⑥...
-
Page 47: Maintaining The Test Tool
Maintaining the test tool Warning! This section is very important for safety. Read and understand the following instruction fully and maintain your instrument properly. The instrument must be calibrated and inspected at least once a year to maintain the safety and accuracy. -
Page 48: Replacing And Disposing Of The Li-Ion Battery
9.6. Replacing and Disposing of the Li-ION Battery Warning! To avoid electrical shock, remove the test leads and probes before replacing the battery pack. Caution Handle the PCB Assembly by its edges or while wearing gloves; avoid contaminating the PCB Assembly with oil from tour fingers. -
Page 49: Automotive Test Setup
10. Automotive test setup Engine 10.1. SENSOR function test ■ ABS sensor ■ O2 Sensor ■ ECT Sensor ■ FUEL PRESS ■ IAT Sensor ■ Knock Sensor ■ TPS Sensor ■ CKP Mag ■ CKP LoRes ■ CKP HiRes ■ CMP Mag ■... -
Page 50: Abs Sensor
10.1.1. ABS sensor Measures and compares the alternating current signal from magnetic wheel speed sensor used in Anti Lock Brake Systems. Path: ABS Sensor ABS SENSOR BLACK TO SENSOR BODY OR ENGINE (CHASSIS) RED TO SENSOR OUTPUT Measured waveform should be stable. -
Page 51: Ect Sensor
10.1.3. ECT Sensor Measures and compares the signal from coolant temperature sensors. Path: ECT Sensor ECT SENSOR BLACK TO SENSOR BODY OR ENGINE (CHASSIS) RED TO SENSOR OUTPUT Measured waveform decreases as engine temperature increases. Normal ECT Sensor waveform 10.1.4. Fuel Temp Measures and compares the signal from the fuel temperature sensors. -
Page 52: Iat Sensor
10.1.5. IAT Sensor Measures and compares the signal from air temperature sensors. Path: IAT Sensor IAT SENSOR BLACK TO SENSOR BODY OR ENGINE (CHASSIS) RED TO SENSOR OUTPUT Measured waveform decreases as the sensor heats up. Normal IAT Sensor waveform 10.1.6. -
Page 53: Tp Sensor
10.1.7. TP Sensor Measures and compares the waveform of Throttle Position sensors. Path: TP Sensor TP SENSOR BLACK TO SENSOR BODY OR ENGINE (CHASSIS) RED TO SENSOR OUTPUT Spikes in the slope of measured waveform indicate a worn TPS carbon track. Normal TP Sensor waveform 10.1.8. -
Page 54: Ckp Lores
10.1.9. CKP LoRes Measures and compares the Crankshaft low accuracy sensor signal. Path: CKP LoRes CKP LoRes BLACK TO SENSOR BODY OR ENGINE (CHASSIS) RED TO SENSOR OUTPUT Measured waveform should be stable. Normal CKP LoRes Sensor waveform 10.1.10. CKP HiRes Measures and compares the Crankshaft high accuracy sensor signal. -
Page 55: Cmp Mag
10.1.11. CMP MAG Measures and compares the Camshaft magnetic sensor signal. Path: CMP MAG CMP MAG BLACK TO SENSOR BODY OR ENGINE (CHASSIS) RED TO SENSOR OUTPUT Measured waveform should be stable. Normal CMP Mag Sensor waveform 10.1.12. CMP LoRes Measures and compares the Camshaft low accuracy sensor signal. -
Page 56: Cmp Hires
10.1.13. CMP HiRes Measures and compares the Camshaft high accuracy sensor signal. Path: CMP HiRes CMP HiRes BLACK TO SENSOR BODY OR ENGINE (CHASSIS) RED TO SENSOR OUTPUT Measured waveform should be stable. Normal CMP HiRes Sensor waveform 10.1.14. VSS MAG Measures and compares vehicle speed sensor-magnetic signal. -
Page 57: Vss Digital
10.1.15. VSS Digital Measures and compares Vehicle Speed Sensor signal - Digital. Path: VSS Digital VSS DIGITAL BLACK TO SENSOR BODY OR ENGINE (CHASSIS) RED TO SENSOR OUTPUT Measured waveform should be stable. Normal VSS Digital waveform 10.1.16. MAP Analog Measures and compares signals from MAP sensor with an analog continuous voltage output signal. -
Page 58: Map Digital
10.1.17. MAP Digital Measures and compares signals from MAP sensor with a digital voltage output signal. Path: MAP Digital MAP DIGITAL BLACK TO SENSOR BODY OR ENGINE (CHASSIS) RED TO SENSOR OUTPUT Measured waveform should be stable. Normal Map Digital Sensor waveform 10.1.18. -
Page 59: Maf Hf Digital
10.1.19. MAF HF Digital Measures and compares the MAF sensors signal with a high frequency digital output. Path: MAF HF Digital MAF HF DIGITAL BLACK TO SENSOR BODY OR ENGINE (CHASSIS) RED TO SENSOR OUTPUT Measured waveform should be stable. Normal MAF HF Digital waveform 10.1.20. -
Page 60: Egr Pfe
10.1.21. EGR PFE Measures and compares an EGR PFE sensor signal used to control the Exhaust Gas Re- circulation solenoid valves. Path: EGR PFE EGR PFE BLACK TO SENSOR BODY OR ENGINE (CHASSIS) RED TO SENSOR OUTPUT Sensor voltage varies with different engine. -
Page 61: Actuator Function Test
10.2. ACTUATOR Function Test ■ Injector C/LIM ■ Injector N/LIM ■ Injector PNP ■ Mixture Control Sol. ■ EGR Control Sol. ■ ISC STEP Motor ■ ISC Motor ■ ISC solenoid ■ Trans Shift Sol. ■ Turbo Boost Sol. ■ Glow Plug Amp. -
Page 62: Injector C/Lim
10.2.1. Injector C/LIM Measures and compares the signal from fuel injection systems that uses C/LIM type. Path: Injector C/LIM INJECTOR C/LIM BLACK TO NEGATIVE BATTERY TERMINAL RED TO NEGATIVE SIDE OF INJECTOR Verify all injectors are similar. Normal Injector C/LIM waveform 10.2.2. -
Page 63: Injector Positive Negative Positive
10.2.3. Injector Positive Negative Positive Measures and compares the signal from fuel injection systems that uses PNP type. Path: Injector PNP NJECTOR PNP BLACK TO ENGINE RED TO INJECTOR POSITIVE CONNECTION Verify all injectors are similar. Normal Injector PNP waveform 10.2.4. -
Page 64: Egr Control Sol
10.2.5. EGR Control Sol Measures and compares Pulse Width Modulated signals that control exhaust gas re-circulation solenoid valves. Path: EGR Control sol. EGR CONTROL SOL BLACK TO ENGINE RED TO SOLENOID Duty cycle changes with engine conditions. Normal EGR Control sol. waveform 10.2.6. -
Page 65: Isc Motor
10.2.7. ISC Motor Measures and compares an idle speed control step motor signal. Path: ISC Motor ISC MOTOR BLACK TO ENGINE RED TO THE SIGNAL WIRE AT ISC CONNECTOR Check for asynchronous waveform. Normal ISC Motor waveform 10.2.8. ISC SOL Measures and compare an idle speed control solenoid signal. -
Page 66: Trans Sol
10.2.9. Trans Sol Measures and compares Pulse Width Modulated signals used to control the various pressure valve solenoids found in electronically controlled automatic transmissions. Path: Trans Sol TRANS SOL. BLACK TO ENGINE RED TO SOLENOID Measures PWM signals used to control the various pressure valve solenoid Normal Trans Sol waveform... -
Page 67: Glow Plug Amp
10.2.11. Glow Plug Amp Measures and compares the current draw from glow plugs when the ignition is turned on with a cold engine. * You need optional DC clamp adaptor to measure Glow Plug Amp. Path: Glow Plug Amp. TURBO BOOST CONNECT THE DC CLAMP ADAPTOR TO GLOW PLUG WIRE. -
Page 68: Ignition & Electrical Function Test
10.3. IGNITION & ELECTRICAL Function Test ■ ■ SPOUT ■ DI Primary ■ DI Secondary ■ EI Primary ■ EI Secondary ■ Power Circuit ■ VREF Circuit ■ Ground Circuit ■ Alt Output ■ Alt Field VR ■ Alt Diode Check 10-20... -
Page 69: Pip
10.3.1. Measures and compares a Profile Ignition Pick-up signal. Path: BLACK TO ENGINE CHASSIS RED TO PIP SIGNAL Check the timing relationship between reference waveform and measured waveform. Normal PIP waveform 10.3.2. SPOUT Measure and compare a Spark Out signal. Path: SPOUT SPOUT... -
Page 70: Di Primary
10.3.3. DI Primary Measures and compares the ignition waveforms for all cylinders on standard Distributor ignition systems. Path: DI Primary DI PRIMARY BLACK TO ENGINE CHASSIS RED TO NEGATIVE SIDE OF THE IGNITION COIL Look for abnormally long or short dwell periods in the waveform. -
Page 71: El Primary
10.3.5. El Primary Measures and compares electrical ignition primary waveforms. Path: EI Primary EI PRIMARY BLACK TO ENGINE CHASSIS RED TO NEGATIVE SIDE OF THE COIL PRIMARY Look for abnormally long or short dwell periods in the waveform. Normal EI PRI waveform 10.3.6. -
Page 72: Power Circuit
10.3.7. Power Circuit Measures and compares the + 12V battery voltage of a device. Path: Power Circuit POWER CIRCUIT BLACK TO BATTERY –(NEG) RED TO POWER CONNECTION Monitor the +12V battery voltage of a device. Normal Power Circuit waveform 10.3.8. VREF Circuit Measures and compares the reference voltage of a device. -
Page 73: Ground Circuit
10.3.9. Ground Circuit Measures and compares the ground connection voltage of a device. Path: Ground Circuit GROUND CIRCUIT BLACK TO BATTERY – (NEG). RED TO GROUND CONNECTOR OF THE SENSOR OR TEST POINT. TEST: RUN THE ENGINE. Monitor the voltage drop that should be less than 0.1V. -
Page 74: Alternator Field Vr
10.3.11. Alternator Field VR Measures and compares the pulse width modulated field control signal used by the alternator to regulate the output. Path: Alt Field VR ALT FIELD VR BLACK TO ENGINE (CHASSIS) RED TO FIELD TEST POINT Measures PWM field control signal to regulate its output. -
Page 75: Automotive Test Setup Table
10.4. Automotive test setup table Sensor tests Actuator tests Electrical & ignition ABS Sensor Injector C/LIM O2 Sensor Injector N/LIM SPOUT ECT Sensor Injector PNP DI Primary FUEL TEMP Mixture ctrl sol DI Secondary IAT Sensor EGR CTRL sol EI Primary Knock Sensor ISC Step Motor EI Secondary... -
Page 76: Appendices
11. Appendices 11.1. Troubleshooting guide If you experience trouble with your instrument, try these corrective actions before concluding that the instrument needs repair. 1. Make sure you are using fresh Li-ION battery pack or fully charged rechargeable battery pack. If you are using the AC/DC power adapter, make sure the adapter is plugged into an appropriate live power source. - Page 77 MEMO...
Need help?
Do you have a question about the S2800 and is the answer not in the manual?
Questions and answers