Table of Contents
Advertisement
Quick Links
Advertisement
Table of Contents

Related Manuals for Malvern NANOSIGHT NS300


Summary of Contents for Malvern NANOSIGHT NS300
- Page 1 NANOSIGHT NS300 PARTICLE SIZE USER MANUAL PARTICLE CONCENTRATION...
- Page 3 NANOSIGHT NS300 USER MANUAL MAN0541-01-EN-00...
- Page 4 Malvern® and the “hills” logo are registered trademarks in the UK and/or other coun- tries, and is owned by Malvern Instruments Ltd. NanoSight NS300® is a registered trademark in the UK and /or other countries, and is owned by Malvern Instruments Ltd.
-
Page 5: Table Of Contents
Contents CONTENTS Introduction Introduction About this manual Where to get help Health and safety General safety warnings Site requirements Laser safety warnings Electrical safety warnings Sample handling warnings Site requirements Siting the instrument Services Installation Handling Unpacking and initial inspection Installation and relocation Hardware setup The instrument... - Page 6 Contents Sample loading Sample loading Low Volume Flow Cell O-Ring top plate Making a measurement Getting started Obtaining an initial live image for optimization Optimizing the image Taking a measurement Setting detection threshold Processing Exporting Shutting down the system Fluorescence measurements About fluorescence mode Preparing to make a fluorescence measurement How to make a fluorescence measurement...
- Page 7 Contents O-Ring maintenance Important information NanoSight NS300 specification Chemical compatibility Returning equipment Warranty Regulatory information...
-
Page 9: Introduction
INTRODUCTION Welcome to this NanoSight NS300 User manual. The following topics are covered in this introductory chapter: Introduction About this manual Where to get help... -
Page 10: Introduction
Malvern Instruments (helpdesk@malvern.com) for further information. This manual is designed to help familiarise the user with the NanoSight NS300 operation. Further advice and help to get the best out of your instrument can be found in the Nan- oSight Application Notes, Technical Notes and User Training Videos. -
Page 11: About This Manual
Product documentation structure This manual fits into the following information structure for this product: NanoSight NS300 User Manual — provides detailed information on how to use and administer the system. The Manual also gives Health and Safety, Main- tenance, Troubleshooting and other vital information which all users must read. -
Page 12: Where To Get Help
Introduction Naming convention The NanoSight NS300 is referred to either in full as the NanoSight NS300, or as ‘the instrument’. Menu commands Menu commands in the NanoSight NS300software are always shown in bold text in the form: main menu-menu item-submenu item As an example, the command File-Open-Data file refers to selecting the Data file sub- menu item under Open in the File menu. - Page 13 Introduction Remote support Malvern Instruments offers a remote support service, delivered by an Internet connection. Benefits include fast and efficient fault diagnosis, reducing downtime and costs. Malvern website — www.malvern.com The Malvern Instruments website offers a comprehensive range of particle char-...
-
Page 15: Health And Safety
HEALTH AND SAFETY This section provides vital health and safety information which all users of the system must read and understand. The following topics are covered in this section: General safety warnings Site requirements Laser safety warnings Electrical safety warnings Sample handling warnings... -
Page 16: General Safety Warnings
Warning! The instrument can be used with all non-flammable water-based solvents of neutral pH. Other solvents may not be compatible and must not be used without first contacting Malvern Instruments to confirm suitability. - Page 17 The laser module may become hot when operating the temperature control. Caution should be taken when handling the device. Warning! The temperature control should always be turned off when the instrument is unattended. Warning! The NS300 must only be serviced by qualified Malvern Instruments personnel, or Malvern Instruments approved agents.
-
Page 18: Site Requirements
Warning! The NanoSight NS300 device is classified (to BS EN 60825-1 (2001)) as a Class 1 laser device. Removal of instrument casing or opening the housing of the laser module voids all warranties and could expose users to hazardous voltages or Class 3B laser radiation. -
Page 19: Electrical Safety Warnings
Health and safety Electrical safety warnings The following electrical specifications must be adhered to for safe operation of the Nan- oSight NS300. Fuses must only be replaced with a fuse of the type and rating — F5AH250V Ø5 mm x 20 mm long. Only use the power adapter and other accessories supplied with the instrument. -
Page 20: Sample Handling Warnings
Health and safety Sample handling warnings Always handle all substances in accordance with the COSHH (Control Of Sub- stances Hazardous to Health) regulations (UK) or any local regulations concerning sample handling safety. Before using any substance, check the Safety Data Sheets (SDS) for safe handling information. -
Page 21: Site Requirements
SITE REQUIREMENTS This section provides information on the typical site requirements for the NanoSight NS300. The following topics are covered: Siting the instrument Services... -
Page 22: Siting The Instrument
Site requirements Siting the instrument When siting the NanoSight NS300 make sure that the following environmental con- ditions are satisfied: The NanoSight NS300 system and any accompanying accessories must be sited indoors. It must be away from strong light sources (e.g. windows). - Page 23 25 mm for ventilation at the rear. Also allow 150 mm at the front of the instrument and 100 mm to the left for the door to open. Component dimensions are: Component Width Depth Height NanoSight NS300 Instrument Housing 250 mm 400 mm 400 mm Computer and Printer See manufacturer’s documentation...
-
Page 24: Services
This section describes the services required. General The following services are required for each component: Component Power sockets required NanoSight NS300 instrument Computer Monitor Power specification The mains power supply must be clean and filtered. If necessary, fit an un-interruptible power supply (UPS) to remove any spikes or noise. -
Page 25: Installation
INSTALLATION This chapter covers the following topics: Handling Unpacking and initial inspection Installation and relocation... -
Page 26: Handling
The laser module contains a static-sensitive laser diode and should never be used in circumstances when a static discharge may damage the diode. Between uses of the NanoSight NS300, or for longer term storage, the unit must be cleaned and dried as described in General maintenance on page 140. -
Page 27: Installation And Relocation
Installation Installation and relocation Note: Initial installation will be carried out by qualified Malvern Instruments personnel/ representatives. If the instrument needs relocating, always perform the following steps: Disconnect the equipment from the mains and ancillary units before moving. Locate the instrument in an area of good ventilation and with sufficient space for safe and efficient operation and maintenance. -
Page 29: Hardware Setup
HARDWARE SETUP This section provides information on the typical hardware setup of a NanoSight NS300 and gives more detail on the connections available. The following topics are covered: The instrument Instrument communications The laser module External fluidic setup Mounting the laser module... -
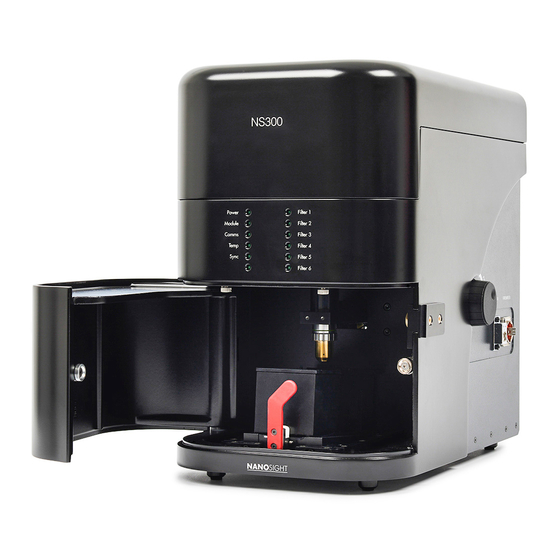
Page 30: The Instrument
Hardware setup The instrument The NanoSight NS300 is illustrated: Instrument connections External fluidics inlet and outlet Door... - Page 31 Hardware setup Objective Laser module Lever to release/secure laser module...
-
Page 32: Instrument Communications
Hardware setup Instrument communications The NS300 instrument communicates with the PC via a USB connection. The following steps outline how to correctly setup instrument communications. 1. Plug the USB cable into the USB port on the right side of the NS300 instrument casing (labeled USB-1) and connect it to one of the USB ports on the supplied PC. - Page 33 Hardware setup Figure 5-2: Power connection Power connection Power switch 5. Start the NTA software and confirm that no hardware detection error messages are displayed in the status panel. See Getting started on page 66 for more inform- ation.
-
Page 34: The Laser Module
Hardware setup The laser module The laser module contains a specially configured and focused laser source, which is moun- ted within a sealed housing. An optical flat element (1) is fixed in place on the top cover of the housing. The electrical contacts (2) on the end of the housing connect to the con- tacts within the NS300 to provide the laser module with power. - Page 35 Hardware setup The Low Volume Flow Cell The Low Volume Flow Cell (LVFC) top-plate is suitable for use with chemically compatible aqueous solutions. It can be cleaned by flushing wash fluid through the chamber, which avoids the need to manually disassemble and clean the chamber after every sample. Figure 5-4: Low volume Flow Cell Warning!
- Page 36 Hardware setup Figure 5-5: Low Volume Flow Cell manifold (NTA0065). Figure 5-6: Low Volume Flow Cell gasket component (NTA0066). The LVFC is supplied with NS300 systems with the two components already assembled:...
- Page 37 Hardware setup Figure 5-7: Low Volume Flow Cell assembly with PDMS chamber seal on the underside of the gasket com- ponent. The following steps tell you how to load the LVFC top-plate onto the laser module: 1. Use the supplied sprung bolts to connect the top-plate to the laser module. 2.
- Page 38 Hardware setup Figure 5-8: Low Volume Flow Cell assembly mounted on laser module with sprung fastening bolts. When using the LVFC, liquid is loaded into the system through fluidic tubing connected to ports on the flow cell manifold, set up as described in Low Volume Flow Cell tubing connection below.
- Page 39 Hardware setup Figure 5-9: Low Volume Flow Cell tubing configuration. Outlet tubing (TUB0288) — connects to the tubing holder port nearest the back of the NS300 and the right port of the low volume flow cell manifold (looking from the tubing connection end of the manifold).
- Page 40 Hardware setup Priming the tubing Important! When using the LVFC, the inlet fluidic tubing should be rinsed out with water or buffer before the tubing is connected to the top-plate and the top-plate primed for use. This improves bubble clearance from the tubing on initial priming, reducing the likelihood of air bubbles entering the sample cham- ber and causing problems in subsequent measurements.
- Page 41 Hardware setup The O-Ring The O-Ring top-plate (ORTP) provides greater chemical compatibility for non-aqueous solvents, or samples which are more viscous or contain larger particles, which may block the flow-cell. To prevent particle carryover, always detach the ORTP from the laser module and manually clean it after each sample.
- Page 42 Hardware setup The O-Ring top-plate can be setup in two different ways, according to how samples are to be loaded into the system. See Manual injection below Injection using the syringe pump on page 42 for more information. Manual injection A push-fit elbow Luer connector is provided so that the laser module fits into the NS300 with the syringe remaining in place.
- Page 43 Hardware setup Figure 5-12: O-Ring top-plate with Luer ports and push fit elbow Luer connector (left). O-Ring top-plate mounted on the laser module inside the NS300 (right).
- Page 44 Hardware setup Injection using the syringe pump A sample can also be loaded into the O-Ring top-plate through the NS300 fluidic tubing for use with a syringe pump accessory. In this case: Remove the Luer ports and the tubing connected using the fittings supplied, as described in O-Ring syringe pump tubing connection below.
- Page 45 Hardware setup Figure 5-14: O-Ring top-plate syringe pump tubing configuration. Outlet tubing (TUB0288) — connects to the tubing holder port nearest the back of the NS300 and the right port of the O-Ring top-plate. FTG0972 FTG0971 Inlet tubing (TUB0281) — connects to the tubing holder port nearest the front of the NS300 and the left port of the O-Ring top-plate.
- Page 46 Hardware setup Caution! The fluidic tubing connection is intended for use with the NanoSight NS300 syr- inge pump accessory only. Manually loading sample through a syringe with the waste tubing connected exerts higher pressures on the chamber seal. This can...
-
Page 47: External Fluidic Setup
The fluidic tubing can be used with both top plates, and attaches to a tubing port holder on the right-hand side of the NanoSight NS300 casing. Slide the holder in and out of the case for easy access to the fluidic connectors. The tubing port holder is held in place with a black nylon screw on the inside of the casing, accessed by opening the door. -
Page 48: Mounting The Laser Module
Hardware setup Mounting the laser module Mount the laser module within the main instrument housing: Note: Make sure the sample is loaded without any air pockets or bubbles before mounting the laser module. 1. Rotate the red lever inside the NS300 to the left to allow the laser module to be mounted. -
Page 49: Software
SOFTWARE This section provides information on the application software used with the NanoSight NS300 instrument. The following topics are covered in this section: About the NanoSight NTA software Software map NanoSight NTA 3.2 scripting... -
Page 50: About The Nanosight Nta Software
Software About the NanoSight NTA software NTA is Malvern's software for the NanoSight range of instruments. It allows videos of particles moving under Brownian motion to be captured and analyzed to generate high resolution size and concentration data. Measurements are run via SOP-type procedures with default options for standard meas- urements and user defined options for additional flexibility. -
Page 51: Software Map
Software Software map Figure 6-1: Software map. Top level menu bar — includes File, View, Hardware, Preferences, Advanced, and Help menus. Live/video view. Capture, Process, and Advanced settings tabs. Results graphs. Measurement selection dropdown in the SOP tab. Hardware tab. Analysis tab. -
Page 52: Nanosight Nta 3.2 Scripting
Software NanoSight NTA 3.2 scripting Script control All NanoSight measurements are controlled by standard operating procedures (SOPs) or scripts. A number of frequently used SOPs are provided with the instrument software. The script control feature in NTA 3.2 allows you to program a list of hardware or software commands for the software to follow. - Page 53 Software Figure 6-2: Script panel in NTA opening screen (left), script panel expanded (right). Shortcuts to commonly used commands are shown to the right of the commands window within the Script panel. 1. Click on the Script Commands menu at the top right of the panel to display a dir- ectory structure, listing all the commands available for your specific NanoSight sys- tem configuration.
- Page 54 Script commands (NS300) The usage and syntax for all NTA 3.2 commands for the NanoSight NS300 are listed below; the commands that can be used will depend on the specific system configuration. Any additional parameters required should be entered with a space following the com- mand.
- Page 55 Software ition of a REPEATSTART command (see below). The repeated portion of the script will be run 5 times in total Start position for a repeated section of the script REPEATSTART Any following REPEAT command will repeat commands between REPEATSTART and REPEAT Set initial value of incremental loop variable (accessed via VAR) SETLOOPVARSTART 1 to 1...
- Page 56 Software FOCUSLEVELRUN Set the camera level appropriately for autofocus AUTOFOCUSRUN Run the autofocus routine at the currently set camera level Sets the optimum camera level for NTA measurement (image AUTOLEVELRUN must already be in focus) Processing and export Display a dialog box for the user to choose the detection PROCESSSINGLESETTING threshold and then process all the videos Display dialog boxes for the user to choose the detection...
-
Page 57: Parameter Settings
Software BLUR 3 Set a fixed blur value - 0 (off), 1(3x3), 2(5x5), 3(7x7) or 4(9x9) Option to turn the automatically optimised track length set- AUTOMINTRACKLENGTH ON/OFF ting on or off Sets a fixed minimum track length of 10 (available range 1- MINTRACKLENGTH 10 180) Parameter settings... - Page 58 Software Withdraw sample with the syringe pump at speed 20 (arbit- SYRINGEWITHDRAW 20 rary units) SYRINGESTOP Stop syringe pump movement Filter wheel FILTER 2 Move the filter wheel to filter position 2 Move the filter wheel to the filter position one higher than FILTERADV the current position Move the filter wheel to the filter position one lower than the...
-
Page 59: Sample Loading
SAMPLE LOADING This chapter covers sample loading instructions for the Low Volume Flow Cell and the O- Ring top-plate. Sample loading Low Volume Flow Cell O-Ring top plate... -
Page 60: Sample Loading
Sample loading Sample loading Before proceeding with analysis, check a sample of any buffer or diluent to confirm that it doesn’t contain any contaminating nanoparticles. When loading sample using the Low Volume Flow Cell or the O-Ring top-plate: Load the sample with the laser module outside of the instrument. As the sample is loaded, detect the presence of air pockets or bubbles and remove them. -
Page 61: Low Volume Flow Cell
Sample loading Low Volume Flow Cell Loading an initial sample Once the LVFC is mounted onto the laser module and the inlet tubing has been pre- rinsed with buffer or sample, connect the inlet tubing to the flow cell manifold to load liquid into the sample chamber. - Page 62 Sample loading Changing samples The Low Volume Flow Cell top-plate has been designed so that the system can be flushed clean between samples (dependent on sample type) with particle carryover of less than 1%. It is not necessary to remove the flow cell or disconnect the tubing for flush cleaning. 1.
-
Page 63: O-Ring Top Plate
Sample loading O-Ring top plate Manual injection of a sample 1. Fill a 1 ml disposable syringe with the appropriate buffer or sample. 2. Remove any air bubbles from the syringe. 3. Hold the laser module vertically, so that the front inlet port is at a lower level than the back outlet port. - Page 64 Sample loading 3. Insert a 1 ml syringe of liquid into the Luer port and push ~900 µl of the liquid through the inlet tubing as fast as the back pressure will allow (this should take 5–10 seconds). 4. Leave the syringe with the remaining liquid attached to the Luer port to prevent any air being introduced.
- Page 65 Sample loading 1. Connect the end of the inlet tubing inside the NS300 casing to the left port of the O-Ring top-plate, and the outlet tubing to the right port. 2. Using the sprung fastening bolts, mount the top-plate with attached inlet and outlet tubing onto the laser module.
-
Page 67: Making A Measurement
MAKING A MEASUREMENT This chapter outlines the basic steps involved in making an NS300 measurement. For more information about the software and its features, please see Software on page 47. The following topics are covered: Getting started Obtaining an initial live image for optimization Optimizing the image Taking a measurement Setting detection threshold... -
Page 68: Getting Started
Making a measurement Getting started There are two main steps involved in making a NanoSight NS300 measurement. These are: Optimizing the image Taking a measurement. The NanoSight NTA software is pre-installed on all computers supplied by Malvern Instru- ments. 1. Double click the NanoSight NTA software icon on the desktop:... -
Page 69: Obtaining An Initial Live Image For Optimization
2. Check that the required hardware is detected. If the required hardware is shown as ‘not found’, check connections and power. Note: For users new to the NanoSight Instrument and NTA software, Malvern Instruments recommends making first measurements using size-calibrated standard particles. - Page 70 Making a measurement Figure 8-3: Select the capture tab This will show the Capture settings tab. Figure 8-4: Capture settings tab. 3. Set Camera Level (1) to 16 (Max). 4. Click Start Camera (2).
-
Page 71: Optimizing The Image
The iterative process of optimizing an image. Laser beam position The NS300 imaging position is set-up and calibrated by Malvern. The system is designed to have good beam relocation once set-up, although small adjustments may be necessary to optimize the image. If the beam is not central in the field of view on screen, i.e. not filling the top or the bottom of the screen, the image can be adjusted up and down by a small amount. - Page 72 Making a measurement Figure 8-6: Centering image to show illuminated particles in the field of view. Use left mouse button to drag and center the image: Figure 8-7: Centering the image.
- Page 73 Making a measurement Adjusting the camera level Correctly setting up the camera and sample image prior to capturing the video are essen- tial to achieving valid results. Note: The software will provide warnings at the extremes of operation. Lack of warning does not mean the camera settings are OK.
- Page 74 Making a measurement Poor monodisperse sample Good monodisperse sample Poor polydisperse sample Good polydiserse sample Using old camera levels The camera brightness levels give a linear increase in brightness across the imaging range as the camera levels are incremented. In NTA software version 3.0 and earlier the camera levels were less linear, meaning that the same sample at the same camera level will not appear at the same brightness in NTA 3.0 and 3.1.
- Page 75 Making a measurement Image focus 1. Initially, make coarse focus adjustments using the focus dial on the right hand side of the instrument casing. 2. Make fine focus adjustments using the slider found within the Pump/Stage tab in the software: Figure 8-10: Fine focus adjustment in the NTA software.
- Page 76 Ideally, particles should appear as in (2) but those in (3) will be satisfactory if that is the best image that can be achieved. If you are unable to locate the illuminated particles, or obtain a clearly focused image with your instrument, please contact Malvern Instruments on + [44] (0)1684-892456, or email us at helpdesk@malvern.com. Concentration The NanoSight instruments can work with particle concentrations in the range of ~10 –...
- Page 77 Making a measurement Auto-setup Auto setup can be used before the NTA Standard Measurement SOP for fully automated capture settings. For non-polydisperse samples, with brightness equivalent to 50 nm – 400 nm latex for HS systems, or 100 nm – 400 nm latex for non-HS systems, NTA software version 3.1 and above can automatically set the image focus and select an appropriate camera level for standard measurement.
- Page 78 Making a measurement Set an initial camera level. Focus image. Set capture camera level. Note: Auto-focus is only specified for monodisperse samples which are well within the detection range of the instrument and within the concentration range 2x10 to 1x10 particles / ml.
- Page 79 Making a measurement Figure 8-14: Auto set-up camera level only check box. Thresholding pixels If the pre-defined camera levels are not suitable for a sample, e.g. if it is very dim relative to the image background, use the histogram displayed underneath the capture screen to optimize the image settings when using the Scientific CMOS camera.
- Page 80 Making a measurement 1. Set the minimum to a level which allows the dimmest particles to still be seen (move the gray cursor into position with the left-hand mouse button). 2. Set the maximum to a level at which the largest particles do not contain many sat- urated pixels (move the other gray cursor into its maximum position using the right-hand mouse button).
-
Page 81: Taking A Measurement
Making a measurement Taking a measurement The NTA software contains options for: Standard Measurement — Suitable for most size and concentration meas- urement within instrument specifications. Quick Measurement — Creates a single video and analysis. Recent Measurements — A list of the last 10 measurements taken allowing the rapid repeat of readings. - Page 82 Making a measurement Figure 8-17: Measurement selection window. 2. Input the following: Number and duration of Captures (1): The default number and length of video captures are suitable for most samples. Base Filename (2): Select the name and location for the captured video files.
- Page 83 Making a measurement Sample dilution factor can be entered. Where the diluent is not water, solvent vis- cosity must be entered here (1). It is recommended that the lower check boxes (2) are left checked to avoid heat build up between readings (Temperature off..., Camera/laser off…, Save Vis- cosity…).
-
Page 84: Setting Detection Threshold
Making a measurement The software will prompt for the sample to be injected (this will be requested at the start of each repeat capture according to the script). The NanoSight Syringe Pump accessory provides the alternative of continuous sample flow. As long as the temperature communications program is running, the sample temperature will be displayed in the NTA capture screen and automatically saved with the video. - Page 85 Making a measurement The lower the setting the more centers will be found. However if it is too low, ‘noise’ can be tracked. If the setting is too high, particles will be excluded. For the best analysis, identify the center of each particle by reducing the detection threshold to a level that includes as many particles as possible.
- Page 86 Making a measurement Figure 8-22: Checking video footage one frame at a time. Low detection threshold Figure 8-23: Low detection threshold. The frame particle count value is shown in the bottom right of the main graph window.
- Page 87 Making a measurement High detection threshold Figure 8-24: High detection threshold. When the particle detection threshold has been set, click OK to start the measurement process.
-
Page 88: Processing
Making a measurement Processing During processing the image will appear to be brighter than during the set-up phase. As the software processes the video images, red ‘tracks’ appear on the screen depicting the Brownian Motion of the particles. Figure 8-25: The NTA software during image processing. - Page 89 Making a measurement Example: Screen view at the end of processing for n=5 captures from one sample. Indi- vidual size distribution profiles of the 5 captures for the sample are over-plotted. Figure 8-26: Software view after processing. Mean ± SEM for the concentration, mean size, modal size and SD of the sample are shown.
- Page 90 Making a measurement Processing can be paused, and stepped through frame by frame. When processing is running, a pause button (1) becomes visible in the ‘Process’ tab. When processing is paused, a play button (1) and a step frame button (2) become visible.
-
Page 91: Exporting
Making a measurement Exporting At the completion of processing the software automatically opens the Export Settings win- dow. Figure 8-29: Export settings window. The defaults are for PDF graphs and batch summaries (2) and (4). Raw data for further processing can be exported as CSV files (1). The AVI files used to capture the video data are very large (e.g. - Page 92 Making a measurement PDF data export Example of exported PDF report for n=5 data from one sample: The size distribution profile data are shown over-plotted (1). Mean ± SEM data are shown, with the size of the key peaks annotated. Figure 8-30: PDF data export.
- Page 93 Making a measurement D10, D50 and D90 values indicate percent undersize, for example 50% particles are 229 nm or smaller, giving another indication of the spread of particle sizes within the sample.
- Page 94 Making a measurement CSV file data export Figure 8-31: CSV file data export.
- Page 95 Making a measurement Note: When vibration has been detected during the measurement, the size reported will be smaller than the true size of the particles in the sample. Each column represents a captured file Initial camera settings and capture information Processing settings Concentration and included particles Processing and warnings history...
-
Page 96: Shutting Down The System
Making a measurement Shutting down the system Instrument switch off reminder — When closing the software, the system reminds you to switch off the instrument. Click No to stop this message appearing for the next 10 uses. Figure 8-32: Instrument switch off reminder. Top-plate screws reminder —... -
Page 97: Fluorescence Measurements
FLUORESCENCE MEASUREMENTS This chapter briefly gives information about measuring fluorescent particles. It covers the following topics: About fluorescence mode Preparing to make a fluorescence measurement How to make a fluorescence measurement... -
Page 98: About Fluorescence Mode
Fluorescence measurements About fluorescence mode Nanoparticle Tracking Analysis (NTA) technology from Malvern can be used to analyze the size and concentration of particles from the light they scatter. With appropriate exper- imental design, NTA can also be used to characterize fluorescent particles. This is done by detecting the fluorescence signal, which is emitted naturally by particles or as a result of fluorescence labeling or tagging. - Page 99 565 long pass Note: For users wanting to use the Red 642 nm laser (for fluorescence meas- urements), please contact your local Malvern representative. Once an optimum dilution for measurement in scatter mode has been determined, the sample can be checked in fluorescence mode.
-
Page 100: Preparing To Make A Fluorescence Measurement
Fluorescence measurements Preparing to make a fluorescence measurement Before sample analysis: Generate a dilution series of the fluorescent sample, between 1x and 1000x that used for light scatter measurements. Protect samples from the direct light exposure by storing the sample in non-trans- parent sample container (or wrapped in aluminium foil) and also protect the sample in the syringe from light. - Page 101 Fluorescence measurements Figure 9-2: Camera focus control found within the Pumps/Stage tab. 6. Adjust the camera level. When working with fluorescent samples that are very dim (relative compared to the image background), you may need to adjust the Advanced Camera greyscale histogram settings to increase the brightness of the particles relative to the background (optimize contrast): Figure 9-3: Advanced Camera...
- Page 102 Fluorescence measurements 1. Set the minimum value to a level that allows the dimmest particles to be seen — move the grey cursor (blue arrow — left side) into position with the left-hand mouse button. 2. Set the maximum value to a level where large particles don’t contain saturated pixels —...
-
Page 103: Temperature Controlled Measurements
TEMPERATURE CONTROLLED MEASUREMENTS This chapter details information regarding performing measurements at non-ambient tem- peratures. It covers the following topics: Operation Initializing Temperature setting Manual temperature input override... -
Page 104: Operation
Temperature controlled measurements Operation Peltier elements within the laser module operate as a heat pump; transferring heat from one side of the Peltier to the other (i.e. they push heat from one face to the other making one side hot, the other cold). They are electrically powered and the power can be con- trolled by precisely varying the voltage (and therefore current) through the Peltier ele- ments. -
Page 105: Initializing
Temperature controlled measurements Before using the temperature controller it is imperative that all the warnings mentioned above are read and understood. Initializing Figure 10-1: Temperature tab. 1. Switch on power to the NS300. 2. Switch on the PC. 3. Load the NanoSight NTA software. 4. - Page 106 Temperature controlled measurements The temperature controller will now work to set the temperature of the top-plate to the target temperature. Some overshoot should be expected. The angled line shows a trace of the temperature over the last 200 seconds. This line is autoscaling but has no labels. A new temperature can be programmed to change the temperature (by repeating steps 2 and 3).
-
Page 107: Manual Temperature Input Override
Temperature controlled measurements Manual temperature input override If no temperature readout is available select the Manual Temperature (1) option in the Standard Measurement SOP page. This lets you choose to manually input a temperature to be used for all captures recorded using the script (the temperature input window will not appear after each captured video). -
Page 109: Analyzing Data
ANALYZING DATA This chapter gives information on viewing and analyzing your measurement data, as well as some examples of typical data profiles: Viewing data Plotting and analysis Example results and guidance... -
Page 110: Viewing Data
Analyzing data Viewing data To view the combined data profile ± SEM 1. Place the cursor in the main graph area and right click to open a graph display options menu. 2. Select Switch Multigraphs/Average. Figure 11-1: Viewing the combined data profile. - Page 111 Analyzing data To view the data for a single capture. 1. Double click the chosen file (1). 2. The size distribution data for the chosen capture is shown in the Single analysis tab (2). Figure 11-2: Data from a single capture.
-
Page 112: Plotting And Analysis
Analyzing data Plotting and analysis Open/close an experiment 1. Click on the Recent Experiments tab to open a previous experiment. The most recent experiments are listed in the window underneath. 2. Double click to load the experiment and automatically display the results for the files selected. - Page 113 Analyzing data Combine experiments 1. Click on File > Combine Experiments to combine multiple experiments. The experiments to combine (and associated video files) must reside in the same folder. 2. In the file browser window that opens, select the experiments to combine. Figure 11-4: Combine experiments prompt.
- Page 114 Analyzing data Graph plots As for NTA 3.1 and above, click and drag available plots from the graph viewport into graph windows (2) and (3). This displays them alongside the plot in the main window (1). Figure 11-5: Graph windows. When an experiment is loaded, graph windows (2) and (3) are empty.
- Page 115 Analyzing data Note: Exclusion regions can only be applied to a single measurement. Figure 11-6: Scatter plot exclusion regions. Left mouse click and drag to add a region to the scatter plot. Multiple square regions can be added to remove areas of a distribution. Chosen regions are saved and are reloaded back in when looking at the analysis again.
- Page 116 Analyzing data Figure 11-7: Main window displaying exclusion regions. During processing excluded particles are highlighted using a square (1). Figure 11-8: Exclusion regions highlighted by a square. Exclusion regions are shown in the status window (2). Figure 11-9: Exclusion regions shown in the status window. An example is shown here of exclusion regions added in a size vs intensity plot (left), and viewed in a size vs intensity plot (right).
- Page 117 Analyzing data Figure 11-10: Exclusion regions added in a size vs intensity plot (left), and viewed in a size vs intensity plot (right). When viewing an experiment/multi-plot scatterplot, any excluded points are shown in red. Figure 11-11: Excluded regions shown in red. Selected concentration User lines Set user lines as markers on a plot to obtain concentration information about a selected...
- Page 118 Analyzing data 1. Select the Display User Lines option from the right-click context menu on the graph. 2. Move the lines to the required value by left clicking and dragging on the diamond symbols (1) at the top of the lines. Figure 11-12: User lines.
- Page 119 Analyzing data 1. Navigate to the Current Experiment tab. 2. Click the Change Settings button. Figure 11-13: Change experiment settings windows. The buttons at the bottom of the Change Settings window can be used to save or clear any changes. Update: Sets the new settings and updates the graphs and results in the NTA main window.
- Page 120 Analyzing data Figure 11-14: Selecting cells to change. 3. Double click any selected cell to edit the value. If Dilution is set to 0 it will display ‘Unknown’ and the concentration will not be adjusted.
- Page 121 Analyzing data Figure 11-15: Enter new value for all selected cells. 4. Press the Enter key to automatically update all values in the column.
- Page 122 Analyzing data Figure 11-16: Updated highlighted cells. Viscosity setting When selected, viscosity cells display a tick box to switch between water or a manual vis- cosity. 1. Select the tick box to set the viscosity of the sample for water at the measured tem- perature.
- Page 123 Analyzing data Figure 11-17: Tick box to change from water to manual viscosity. Draw all tracks On a processed individual analysis, a diagram of all tracked movements of particles can be generated. This can be useful when checking the alignment of the laser module and ensuring that illuminated particles are evenly filling the field of view for concentration measurements.
- Page 124 Analyzing data Figure 11-18: Draw all tracks. After a few seconds an image should appear, as shown on the right. Red tracks are ‘valid tracks’ (i.e. included in the measurement) while blue tracks are rejected tracks. 3. Right click > Export can be used to export the image to file. Graph overlay Drag experiment graphs from the viewport windows to graph windows 2 and 3.
- Page 125 Analyzing data Figure 11-19: Drag graphs from viewport windows to graph windows. The new plot will automatically be transferred to a blank graph window. If the window is not blank, options to replace or overlay are shown (depending on the graph types). Replace/Cancel buttons —...
- Page 126 Analyzing data Figure 11-21: Replace/ Cancel/ Overlay buttons. This feature can be used to overlay data from a subset of files captured in a single exper- iment or to overlay data from multiple different experiments on the same plot. 1. Open an experiment and drag a single file or multi-plot graph from the viewport panel into Window 2 or 3.
- Page 127 Analyzing data Two sets of size vs concentration multi- plots. Two sets of size vs intensity scatterplots. Two sets of zeta vs concentration plots with error bars. Three sets of size vs concentration plots with error bars.
- Page 128 Analyzing data Graph settings Navigate to the Preferences > Graph Settings option to adjust the current graph set- tings. Bin widths can be chosen separately for size and diffusion graphs, and depending on whether raw or FTLA data is used. These settings can be defined on a per windows user account basis.
- Page 129 Analyzing data Figure 11-24: Bin number and width. Graphics customisation Navigate to the Preferences > Adjust Graph Colors option to adjust the current colours used for NTA graph plotting. All color preferences will be saved and re-loaded when NTA is restarted. These settings can be defined on a per windows user account basis. The color maps shown in the window for Sets 1, 2 and 3 are used for different plot types within NTA.
- Page 130 Analyzing data Figure 11-25: Changing graph color.
-
Page 131: Example Results And Guidance
Analyzing data Example results and guidance Typical data profiles The profile obtained depends upon the type of sample measured. When the particle size of the sample is more controlled, e.g. size standards, extruded lipo- somes etc., a narrow size distribution profile with a single peak should be obtained, indic- ating a mono dispersed sample: Figure 11-26: Monodispersed sample. - Page 132 Analyzing data Figure 11-27: Multiple, broader peaks. For polydispersed samples e.g. aggregated protein, a very wide size distribution profile might be expected with many peaks identified, which typically decrease in peak-height as size increases: Figure 11-28: Polydisperse sample.
- Page 133 Analyzing data Guidance for accepting data Accepting the data depends on the type of sample you are measuring. When multiple profiles for the same sample measurement are plotted together, the sim- ilarity of the profiles should be in keeping with the level of polydispersity, providing no sampling errors are present, the capture on processing setting were constant, and the sample was measured for long enough: i.e.
- Page 134 Analyzing data Samples of the same type should be measured using the same settings for com- parison. Polydispersed samples will typically need to be captured for longer to generate good data. Samples with a naturally low level of particles/ml will need to be captured for longer to generate good data.
- Page 135 Analyzing data Working towards ISO19430 The International Organization for Standardization (ISO) provides ISO standards, which are guidelines that are manufacturer agnostic, but are an international agreement between manufacturers. Every manufacturer can produce a set of specifications on how to operate their equipment. ISO19430 —...
- Page 136 Analyzing data ISO19430 criteria Comment the number of particles of a givens size 2000 tracks- CV <3% per frame are reported. Counting efficiency — auto- matic or manual thresholding of minimum number of tracks. Sizing accuracy Sample viscosity and meas- The required particle numbers for a cer- urement temperature are key tain cumulative variance were evaluated...
- Page 137 Size limits for different RI it’s 75 nm particles: Au 15 nm, silica 75 nm How Nanosight NTA meets the requirements of ISO19430 ISO19430 NanoSight NS300 Sample and Sample Volume 0.1-1 nl FoV 100 FoV ~ 100 x100 x10 µm = 0.1 nl. volume x100 x10 µm.
- Page 138 Analyzing data ISO19430 NanoSight NS300 Silica 75 nm. Comply. Comply. Example data Example data for 10 nm Gold nanoparticles: Figure 11-30: Size distribution graph and image of Gold nanoparticles as seen in the NanoSight instrument. Summary of the key data parameters obtained:...
- Page 139 Analyzing data Example data for 70 nm Silica nanoparticles: Figure 11-31: Size distribution graph and image ofSilica nanoparticles as seen in the NanoSight instrument. Summary of the key data parameters obtained: Mean Standard error Mean Standard error Mode 69.4 62.3 74.6 68.7 Mean...
-
Page 141: Maintenance
The instrument should not be modified in any way. Any modification will void the warranty and could make the device unsafe. Warning! The NS300 must only be serviced by qualified Malvern Instruments per- sonnel, or Malvern Instruments approved agents. -
Page 142: General Maintenance
Regularly inspect fluidic tubing and replace any that show signs of wear. Please contact Malvern Instruments for additional sets of tubing (P/N NTA4161 NS300 Complete Tubing Kit). When not in use, remove the top plate from the laser module. The top plate,... - Page 143 Maintenance When emptying the sample chamber at the end of use; 1. Flush the final sample from the chamber by 2ml of diluent followed by 2 ml water. 2. Slowly push 2 ml of air through the sample chamber before the top plate is removed from the laser.
-
Page 144: Low Volume Flow Cell Maintenance
Maintenance Low Volume Flow Cell maintenance This section gives information on how to maintain the system and deal with problems that may arise. Manual cleaning procedures A manual clean is only needed if there is visible cloudiness or sample residue stuck to the optical flat or the glass window in the gasket component. - Page 145 Maintenance Warning! Do not wipe or touch the chamber seal on the underside of the gasket com- ponent. 5. Wet a tissue with water, (or a solution of up to 10% ethanol if needed), and use this to wipe the optical flat on the laser module. Warning! Do not pour any liquid over the laser module, as this could penetrate the casing and damage the laser inside.
- Page 146 Maintenance 8. If any sample residue is visible on the glass window surface, gently clean the underside of the glass. Use a small cotton bud dampened with water or a solu- tion of up to 10% ethanol. When cleaning the glass window inside the chamber seal area, limit any rubbing of the surrounding soft PDMS seal.
- Page 147 Maintenance Drying the Low Volume Flow Cell 1. Inject compressed air through the tubing ports on the manifold to thoroughly dry the embedded microchannel inside the gasket component. 2. Once the channel is dry, turn the flow cell assembly over and lightly dry the under- side of the component and the area inside the chamber seal.
- Page 148 Maintenance 1. If the flow cell needs to be disassembled, i.e. if the gasket component seal becomes worn or damaged and needs replacing, use a 2 mm Hex key (part con- tained in NTA4111) to undo the fixing bolt on the underside of the flow cell and disconnect the gasket component from the manifold.
-
Page 149: O-Ring Maintenance
If in doubt about the choice of solvent and its compatibility with the top-plate, optical flat or any other part of the NanoSight device, please contact helpdesk@malvern.com for further information. - Page 150 Maintenance 1. If any tubing is connected for the syringe pump, flush a 1 ml syringe of clean water through the system to clean sample from the tubing and fittings. 2. Once all tubing assemblies are flushed clean, empty any fluidic tubing by loading a 1 ml syringe full of air through the system (do not exceed maximum rated flow speed of 0.05 ml per second).
- Page 151 Maintenance Figure 12-9: Cleaning the O-Ring top-plate. 6. Clean the inside of the window by gently wiping it with a tissue wet with water, or water then ethanol if needed, to remove all traces of the sample being ana- lysed. 7.
- Page 152 Maintenance O-Ring replacement The O-Rings should be replaced relatively regularly depending on the frequency of use, i.e. monthly for high usage instruments, every 3 to 6 months for lower usage instruments. O-Ring packs are available on the Malvern Instruments eStore.
-
Page 153: Important Information
IMPORTANT INFORMATION The following topics are covered: NanoSight NS300 specification Chemical compatibility Returning equipment Warranty Regulatory information... -
Page 154: Nanosight Ns300 Specification
Important information NanoSight NS300 specification NS300 instrument housing Item Specification Size 400 mm x 400 mm x 250 mm Weight ~12 kg Operating temperature 10 °C to 40 °C Up to 80% rH at 31 °C then decreasing linearly to 50% at 40 Humidity °C... -
Page 155: Chemical Compatibility
Maintenance on page 139. Returning equipment If, for any reason, you experience problems with your instrument, contact Malvern Instru- ments (helpdesk@malvern.com). In the unlikely event you experience a problem with the NS300 system that requires return- ing the unit for repair, please contact Malvern Instruments for instructions and doc-... -
Page 156: Warranty
If the original shipping case is not available, shipping cases will be supplied by Malvern Instruments as required to ensure safe return of the system. -
Page 157: Regulatory Information
Communications. Note that Canadian Department of Communications (DOC) regulations provide, that changes or modifications not expressly approved by Malvern Instruments Limited could void your authority to operate this equipment. This Class A digital apparatus complies with Canadian ICES-003. - Page 158 Note: Changes or modifications not expressly approved by Malvern Instru- ments Limited could void the user’s authority to operate the equipment.
- Page 159 Important information The following is applicable in the European Union and other European countries with sep- arate collection systems. This symbol on the product or on its packaging indicates that when the last user wishes to discard this product it must not be treated as general waste.
- Page 160 Malvern Instruments Limited Grovewood Road, Malvern Worcestershire, WR14 1XZ, UK +44 1684 892456 +44 1684 892789 www.malvern.com MAN0541...
Need help?
Do you have a question about the NANOSIGHT NS300 and is the answer not in the manual?
Questions and answers