
Subscribe to Our Youtube Channel
Related Manuals for opti-sciences OS1p


Summary of Contents for opti-sciences OS1p
- Page 1 OS1p User’s Guide (Preliminary Advanced Version with RLCs for Algae and Higher Plants) The New Standard in Portable Chlorophyll Fluorometers OS1p040111Advanced...
-
Page 2: Table Of Contents
IGHT UIDE ..............................59 LECTRONICS ......................... 59 OUSING AND ARRYING CHAPTER 3 • OPERATING THE OS1P......................60 ..............................60 NTRODUCTION ........................60 NTRODUCTION TO RUNNING TESTS Set up menu ..............................61 Adjust screen touch sensitivity ........................62 Touch Panel Calibrate ..........................62 Test menu .............................. - Page 3 Loading and saving preset measuring routines ................... 73 Other Fv/Fm function buttons........................74 Measurement review ............................ 75 Help screen ..............................75 Basic definitions of parameters........................76 Error messages ............................76 )F/F Y(II) P PSII Y(II) ’ ..........77 ROTOCOL UANTUM HOTOSYNTHETIC IELD OF Cookbook checklist before making Y(II) measurements.
- Page 4 Cookbook checklist before making Rapid Light Curve measurements............124 Running the RLC Test ..........................126 Drill down menu for RLC........................... 127 Saving measuring parameters........................128 Loading and saving preset measuring routines ..................129 Copy presets parameters into a new measuring file .................. 129 Change RLC measuring parameters......................
- Page 5 APPENDIX D • DATA FORMATS......................... 171 ............................... 171 VERVIEW Data format information ..........................172 Fv/Fm data file format ..........................172 Y(II) data file format ..........................173 Quenching data file format – Hendrickson – Klughammer equations............174 RCL Rapid Light Curve data format......................175...
-
Page 6: Chapter 1 • Introduction
Chapter 1 • Introduction Overview This chapter provides you with a list of the equipment that you should have received with your OS1p, and Information about chlorophyll fluorescence with scientific references. To select the best chlorophyll fluorescence measuring parameter for your application, consult the Plant Stress Guide provided as a separate document. -
Page 7: Welcome
For example, the word or icon Exit will always step you to the previous program screen, ultimately ending in the "Main Menu". The OS1p has default settings that allow the unit to work for many applications, however, changing the settings are very easily done. -
Page 8: Chlorophyll Fluorescence
Chlorophyll Fluorescence A generalized description as it relates to chlorophyll fluorometry. The following is a generalized description of the photosynthesis light reaction and the value of chlorophyll fluorescence for investigation of plant health, plant function and plant stress. Changes in photosystem II (PSII) fluorescence have been shown to be a sensitive test for most types of plant stress, and reflect measurable changes of many plant functions including photochemistry, photoprotective mechanisms, low light survival state transition mechanisms, and heat dissipation photoinhibition mechanisms. - Page 9 Psydo-cyclic electron transport and other electron sinks may also be involved. Different types of plant stress affect PSII differently, therefore one should consult the Plant Stress Guide on this disc or contact Opti-Sciences at www.optisci.com to determine the best measuring protocol or special assay before working with a specific type of plant stress.
- Page 10 The ability to use Rapid light curves will be provided in 2011 without additional charge for those that buy the advanced version of the OS1p. The advanced version also allows the user to select quenching protocols of interest when the unit is purchased. Other Protocols may also be purchased during or after the initial purchase.
-
Page 11: Definitions
25ms. and 50ms. It is typically a white light that has to be high enough to close all PSII reaction centers. On the OS1p an LED light source is used. Opti-Sciences uses 0.8 seconds as the default saturation pulse duration for higher plants. This duration is adjustable from 0.025 to 2.0 seconds. - Page 12 Fs also known as F’ is the fluorescence level created by the actinic light . Initially the value is high and then decreases over time to steady state values due to the initiation of electron transport, carboxilation, and nonphotochemical quenching. Fs has also been used to designate steady state F’...
- Page 13 Fast -Dark Adapted Fv/Fm Usually less than 2 seconds FV/Fm measuring Screen Fv/Fm = (Fm – Fo) / Fm This is a dark adapted test used to determine Maximum quantum yield. This ratio is an estimate of the maximum portion of absorbed quanta used in PSII reaction centers (Kitajima and Butler, 1975).
- Page 14 Light adapted measurements include Yield of PSII or )F/Fm’ or Y(II), ETR, PAR (or PPFD), and Leaf Temp. With RLC (rapid light curves) The OS1p measures ETRmax, lk, and ‘. µE – is a micro Einstein. This a dimension that involves both time and area. It is equivalent to the micro mol.
- Page 15 PPFD - Photosynthetic Photon Flux Density is the photon flux density of PAR. Measured in either umls or uE., PPFD, or “photosynthetic photon flux density”, is the number of PAR photons incident on a surface in time and area dimensions (per meter squared per second). These terms are equivalent for PAR Clip leaf radiation measurements.
-
Page 16: Quantum Photosynthetic Yield Of Psii - An In Depth Discussion Of Its Value And Limitations
It has also been found to be more sensitive to more types of plants stress. See the Plant Stress Guide on this disc or contact Opti-Sciences at www.optisci.com for details. - Page 17 Once these mechanisms have achieved an equilibrium at a specific light level and temperature, steady state photosynthesis has been achieved. This is a process that takes fifteen to twenty minutes (Maxwell and Johnson 2000). Once at steady state photosynthesis, a very intense short light pulse, called a saturation pulse, is used to momentarily close or chemically reduce all capable PSII reaction centers.
- Page 18 NOTE: It is possible to misinterpret results if PAR and temperature changes are not taken into account. One leaf may appear to be stressed compared to another when the only difference is light irradiation level. PPFD or PAR must be measured very close to the sample or errors can result.
- Page 19 Correlation to Carbon assimilation: In 1989, Genty developed the yield measurement and provided strong evidence of a linear correlation between Yield measurements, Electron Transport Rate, and CO2 assimilation for C4 plants (Baker and Oxborough 2004) and many others have confirmed the relationship (Edwards and Baker 1993), (Krall and Edwards 1990, 1991), (Siebke 1997).
- Page 20 (e.g. Earl 2004), (e.g. Genty B, Harbinson J., Baker N.R. 1990). The Opti-Sciences chlorophyll fluorometer models OS5p and OS1p can be used to make Quantum Photosynthetic Yield Y(II) measurements. Both units accommodate optional digital PAR Clips.
-
Page 21: Quenching Measurements, An Overview
Dark–Light Pulse modulated Chlorophyll Fluorescence Trace – Screens are taken from the OS5p. Parameter read outs from the OS1p will be in a separate window but on the same screen, and only one of the protocols shown, come as standard with the system. Others may be purchased for an additional price. - Page 22 (Maxwell & Johnson 2000). Baker (2008) states that only leaves with similar Fv/Fm values should be compared. (for more details on dark adaptation please request the Opti-Sciences dark adaptation application note). Actinic Light Source Most built-in fluorometer light sources used as actinic sources for quenching measurements and light curves decline in intensity during these measurements.
- Page 23 The Luke Hendrickson simplified lake model parameter were chosen as the default quenching protocol for the OS1p.This was done because they are lake model parameters that allow the resurrection of NPQ from the puddle model by Klughammer, and because relaxation protocols, available in the puddle model, still work for the Hendrickson lake model.
-
Page 24: Quenching Equations
Quenching equations: Kramer, and Hendrickson / Klughammer &Schreiber’s, lake model parameters account for all light that is absorbed by PSII. All parties agree with the following equation. Kramer’s equation is 1 = Y(II)+Y(NPQ)+Y(NO) Y(II) is quantum yield of photochemical energy also known as )F/Fm’ or (Fm’- Fs’)/ Fm’ For comparison purposes, the differences in the equations are listed below. -
Page 25: Definitions - Lake Model Parameters
= ((Fmt-Fme)/ (Fm-Fm’)) is the relaxation saturation value at twenty minutes in the dark. (Values can be changed in Excel). = ((Fm-Fmt) / Fm-Fm’)) Relaxation of q starts at about forty minutes and can take up to sixty hours. q can be determined from the dark adapted Fm measurement and the saturation pulse after 20 minutes used for q or Fmt. -
Page 26: Definitions - Puddle Model Parameters
Puddle model parameter reconciled with the lake model (Klughammer and Schreiber 2008) NPQ = Y(NPQ)/Y(NO) or NPQ= (Fm-Fm’)/Fm’ Klughammer and Schreiber reconcile NPQ with the lake model using simplified parameters. NPQ (resurrected puddle model parameter valid in Klughammer simplified Lake model equations. - Page 27 (puddle model parameter) is the quenching parameter that represents photochemical quenching. It is a measure of the fraction of still open PSII reaction centers. q is defined as the coefficients of photochemical fluorescence quenching. The original definition of this term implied that fluorescence quenching affects primarily the 'variable fluorescence' (Fv) and not the minimal fluorescence (Fo).
-
Page 28: Understanding The Quenching Mode Trace
NPQ. However, this is not true of the OS1p. It seeks to find the highest eight point rolling average of intensity points from the saturation pulse and reports the value. - Page 29 light at this point is given off as fluorescence and is not involved in photochemistry or heat dissipation (Baker 2008). (Baker 2008). All light sources except the modulated measuring light source are turned off after the saturation flash. The fluorescence graph tails off until it reaches bottom exhibiting non- photochemical quenching related to the saturation flash.
- Page 30 The fluorescence signal continues to drop as full activation of rubisco continues and state transitions occur. Full activation of rubisco in both algae and higher plants takes between three to four minutes plus intensity values are driven down by non-photochemical quenching. Nonphotochemical quenching is involved in photo-protection, state transitions, and photoinhibition.
- Page 31 At this point the actinic light source is turned off, and a far red light is turned on for several seconds to activate PSI and drain all remaining electrons from PSII. This results in a quenched measurement of Fo called Fo’ or Fod, the minimum value measured. Fod is used in the quenching parameters q , and Kramer’s Y(NPQ), and Y(NO).
- Page 32 It is common for researchers to dark adapt for 24 hours or overnight (Maxwell and Johnson 2000) when making quenching measurements. It should be noted that NPQ should only be used to compare plants of the same species and with similar Fv/Fm values (Baker 2008), a (Maxwell and Johnson 2000). Quenching relaxation measurements are still valuable because there is a significant volume of literature using puddle model parameters and that literature can be helpful for future research.
-
Page 33: More Helpful Hints For Setting Test Variable In Quenching Protocols
Rosenqvist and van Kooten (2006). Saturation pulse duration On the OS1p, the saturation pulse duration is set at the default value of 0.8 seconds. This is generally ideal for higher land plants, however, times of 0.5 to 1.5 seconds have been used Rosenqvist and van Kooten (2006). - Page 34 The ideal saturation pulse duration for algae and cyanobacteria range from 0.025 seconds and 0.050 seconds (Schreiber 1995). When using the OS1p for algae work, the OS1p uses a special algorithm that finds the highest eight point rolling average at the top of the saturation pulse.
-
Page 35: Dark Adaptation - How Long Is Long Enough
Dark Adaptation – How Long is Long Enough? Dark adaptation is a technique used in some chlorophyll fluorescence measurements to fix a non-stressed reference point relative to various measurements (Maxwell and Johnson 2000). Deciding where to put that reference is based on an understanding of plant mechanisms that can affect measurements, and what one wants to measure. - Page 36 When making longer quenching and quenching relaxation parameter measurements related to photo-inhibition and photo damage mechanisms that are common in chronic high light stress, high heat stress, cold stress and over wintering stress, one should understand that it could take days for full relaxation or repair of the non-photochemical quenching parameters, q Y(NO), to pre-stress conditions.
-
Page 37: Relative Electron Transport Rate
The end result is a close approximation of PSII ETR that can be used for relative evaluation of different samples. With the OS1p, the actual values for leaf light absorbance and the portion used by PSII can be input into the actual formula to provide more accurate results. - Page 38 The absolute amounts for leaf and PSII light absorption can vary at steady state with species, and water content. Terrestrial leaf absorbance has been found to vary between 70% to 90% (Eichelman H., Oja V., Rasulov B., Padu E., Bichele I., Pettai H., Niinemets O., Laisk A. 2004), and the percentage of light absorbed by PSII has been found to range from 40% to 60% (Laisk A.
- Page 39 20 minutes for plants to reach steady state. (For more information on this topic see Opti- Sciences App note # 0509, “Yield value & Limitations”.) Some PAR Clips, such as the digital PAR clip for Opti-Sciences OS1p, allow PAR measurement while an internal light source is being used, thus providing a reliable PAR or PPFD values over time.
-
Page 40: Bibliography
Bibliography Adams WW III, Demmig-Adams B., Winter K. (1990) Relative contributions of zeaxanthin- unrelated types of high-energy-state quenching of chlorophyll fluorescence in spinach leaves exposed to various environmental conditions. Plant Physiol. 92, 302-309. Allen J. F., Mullineaux C.W., (2004) Probing the mechanism of State Transitions in Oxygenic Photosynthesis by Chlorophyll Fluorescence Spectroscopy, Kinetics and Imaging. - Page 41 Bilger W., Schreiber U., Lange O.L. (1984) Determination of leaf heat resistance: Comparative investigation of chlorophyll fluorescence changes and tissue necrosis methods. Oecologia 63, 256-262. Bilger W., Schreiber U. (1986) Energy dependent quenching of dark-level chlorophyll fluorescence in intact leaves. Photosynth. Res. 10, 303-308. Blankenship R.
- Page 42 Cerovic Z, Goulas Y. Gorbunov M, Britantais J-M, Camenen L, & Moya I., (1996) Fluoresensing of water stress in plants. Diurinal changes of mean lifetime and yield of chlorophyll fluorescence, measured simultaneously at distance with a Lidar and modified PAM-fluorometer, in maize, sugar beet and Kalanchoe. Remote Sense Environment 58:311- Cerovic Z.
- Page 43 Flexas 2000 – “Steady-State and Maximum Chlorophyll Fluorescence Responses to Water Stress In Grape Vine Leaves: A New Remote Sensing System”, J. Flexas, MJ Briantais, Z Cerovic, H Medrano, I Moya, Remote Sensing Environment 73:283-270 Genty B., Briantais J-M, Baker N.R. (1989) The relationship between the quantum yield of photosynthetic electron transport and quenching of chlorophyll fluorescence.
- Page 44 Heber U., Neimanis S., Lange O.L. (1986) Stomatal aperture, photosynthesis and water fluxes in mesophyll cells as affected by the abscission of leaves. Simultaneous measurements of gas exchange, light scattering and chlorophyll fluorescence. Planta. 167, 554-562. Hendrickson L., Furbank R., & Chow (2004) A simple alternative approach to assessing the fate of absorbed Light energy using chlorophyll fluorescence.
- Page 45 Kramer D. M., Johnson G., Kiirats O., Edwards G. (2004) New fluorescence parameters for determination of QA redox state and excitation energy fluxes. Photosynthesis Research 79: 209-218 Krause G.H., Briantais J-M, Vernotte C. (1982) Photo induced quenching of chlorophyll fluorescence in intact chloroplasts and algae. Resolution into two components. Biochim biophys.
- Page 46 Morales F., Abadia A., Abadia J. (1991) Chlorophyll fluorescence and photon yield of oxygen evolution in iron-deficient sugar beet (Beta vulgaris L.) leaves. Plant Physiol 97, 886- 893. Muller P., Xiao-Ping L., Niyogi K. (2001) Non-Photochemical Quenching. A Response to Excess Light Energy.
- Page 47 Peterson R.B., Sivak M.N., Walker D.A. (1988) Relationship between steady-state fluorescence yield and photosynthetic efficiency in spinach leaf tissue. Plant Physiol. 88, 158- 163. Pfundel E. E., Ghozlen N. B., Meyer, S, Cerovic Z.G. (2007) Investigating UV screening in leaves by two different types of portable UV florimeters reveals in vivo screening by anthrocyanins and carotenoids.
- Page 48 Schreiber U, Schliwa U, Bilger W (1986) Continuous recording of photochemical and non- photochemical chlorophyll fluorescence quenching with a new type of modulation fluorometer. Photosynth Res 10: 51–62 Schreiber U., Neubauer C. (1987) The polyphasic rise of chlorophyll fluorescence upon onset of strong continuous illumination.
- Page 49 Srivastava A. and Strasser RJ (1997) “Constructive and destructive actions of light on the photosynthetic apparatus.” J Sci Ind Res 56: 133—148 Strasser BJ and Strasser RJ (1995) “Measuring fast fluorescence transients to address environmental questions: The JIP-test. In: Mathis P (ed) Photosynthesis: from Light to Biosphere”, Vol V, pp 977-980.
- Page 50 Tsimilli-Michael M and Strasser RJ (2001) “Mycorrhization as a stress adaptation procedure. In: Gianinazzi S, Haselwandter K, Schüepp H and Barea JM (eds) Mycorrhiza Technology in Agriculture: from Genes to Bioproducts.” Birkhauser Basel, (in press) Tsimilli-Michael M and Strasser RJ (2001) “Fingerprints of climate changes on the photosynthetic apparatus behaviour, monitored by the JIP-test.”...
- Page 51 Vernotte C., Etienne A.L., Briantais J-M (1979) Quenching of the system II chlorophyll fluorescence by the plastoquinone pool. Biochim. biohys. Acta 545, 519-527 Weis E., Berry J. (1987) Quantum efficiency of photosystem II in relation to energy- dependent quenching of chlorophyll fluorescence. Biochim biophys. Acta 849, 198-208 Waterman P.G., Mole S., ,Waterman and Mole (1994) Analysis of Phenolic Plant Metabolites Blackwell Scientific Publications, Oxford, 1994.
-
Page 52: Chapter 2 • The Os1P
Chapter 2 • The OS1p Introduction The OS1p Modulated Fluorometer is a multipurpose portable measuring instrument designed to precisely measure chlorophyll fluorescence. The system is simple to use, light in weight, and battery powered, making it an excellent choice for field studies. It represents culmination of several years of testing and development and was engineered to give many years of reliable service. -
Page 53: Key Features
Various quenching protocols can be added for an additional price including quenching relaxation tests, with both puddle and lake model readouts. Rapid light Curves are included as standard on the advanced version of the OS1p and will be available in early 2011. -
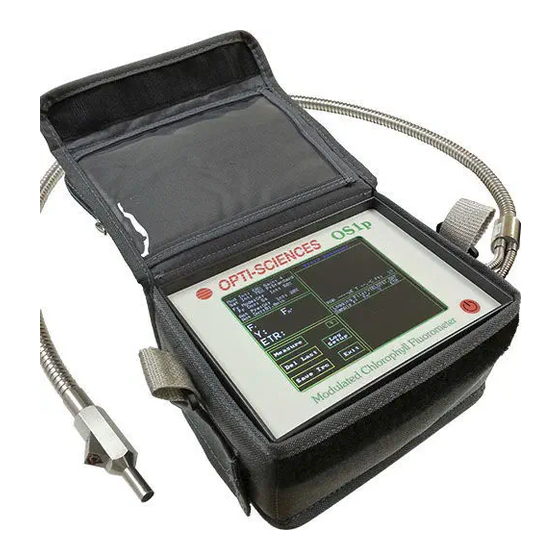
Page 54: Physical Features Panel Photographs
Physical Features Panel Photographs Top Panel: Main Menu Figure 2-1 • Front Panel of OS1p Front Panel of OS1p Touch screen showing Y(II) measuring screen. The Red round button is for OFF and ON Vertical Arrow Left Side Panel: Figure 2-2 • OS1p left side panel SD Card Slot –... - Page 55 It will be red when it is not, and yellow when it is partially charged. It only turns on when the OS1p is turned off and the unit is plugged in. If the light is flashing, check the charger connection. Make sure that it is properly inserted and the wall outlet is working. If...
-
Page 56: Hardware Overview And Measurement Principles
All detection and data logging components are on-board. Fluorescence is measured by a modulated light source in the OS1p. The standard and more commonly used red modulated source is a diode that peaks at 660 nm with filters blocking radiation longer than 690 nm. -
Page 57: Light Sources
The ideal saturation pulse duration for algae and cyanobacteria range from 0.025 seconds and 0.050 seconds (Schreiber 1995). When using the OS1p for algae work, the OS1p uses a special algorithm that finds the highest eight point rolling average at the top of the saturation pulse. -
Page 58: The Led Actinic Light Source
BNC Connectors. This switch can be used to take a measurement, or one can press the enter button on the OS1p front panel, The trigger switch is connected electronically by a wire running down the fiber optic cable, and attaches to the “remote”... -
Page 59: Electronics
No data will be lost due to loss of power. Housing and Carrying Case The OS1p is housed in a durable wear resistant ABS plastic case. This is the same material that is used in the manufacture of motorcycle helmets. It also comes with a nylon field bag... -
Page 60: Chapter 3 • Operating The Os1P
Chapter 3 • Operating the OS1p Introduction The OS1p is shipped with the battery connected. It is a good idea to give the battery a full overnight charge before the first use. Connect the three fiber optic light guide BNC ends to any of the BNC ports on the right side panel of OS1p. -
Page 61: Setup Menu
Setup Menu Set up menu The default time is set for US eastern standard time (24 hour format). On this screen you can adjust the time and date. Press the + or – buttons to change the values. The speaker button allows an audible beep when measurements are made and provides other audible indications as well. -
Page 62: Adjust Screen Touch Sensitivity
Adjust screen touch sensitivity To adjust the sensitivity of the touch screen press “Touch Panel Calibrate” and an adjustment screen will appear as pictured on the next page. Touch screen adjustment screen If it is necessary, to adjust the sensitivity of the touch screen, press the – or + buttons for increased or decreased sensitivity, and the repeat rate keys for speed of response to touch. -
Page 63: Test Menu
Test selection menu found by pushing “Test” Test menu The OS1p has four different test protocols. Each mode providing the necessary setup and data logging for each type of test. Press “Test Menu” using the touch screen and the measuring protocols will appear. Press the button for the measuring protocol that is desired. -
Page 64: Fv/Fm Protocol (Or Fv/M On The Screen)
Fv/Fm measuring Screen Fv/Fm Protocol (or Fv/m on the screen) – Background Dark adapted test - a measurement ratio that represents the maximum potential quantum efficiency of Photosystem II if all capable reaction centers were open. 0.79 to 0.85 is the approximate optimal value for most plant species with lowered values indicating plant stress. -
Page 65: Cookbook Check List Before Making Fv/Fm Measurements
Cookbook check list before making Fv/Fm measurements Fv/Fm is a normalized ratio that does not use a traceable standard. Instead, its accuracy is determined by properly using the instrument and following the lessons learned about plant physiology by several great researchers. To get an accurate measurement, one has to follow tested guidelines. - Page 66 (Opti-Sciences Plant Stress Guide 2010). It may be used effectively in most other types of plant stress. For...
-
Page 67: Running The Fv/Fm Test
“cancel” and go back to the main menu, or “overt” overwrite the last file entirely. To make a measurement with the default settings programmed into the OS1p at the factory, place the end of the fiber optic bundle into a dark clip that is being used to dark adapt a leaf. -
Page 68: Drill Down View Of Fv/Fm Measuring Screens
Press windows to go to other screens Drill down view of Fv/Fm measuring screens Fv/Fm Measuring Screen Fv/Fm Test Calculations screen Fv/Fm Test Data Collection screen Fv/Fm Measurement Pulse Screen ________________________________________ Fv/Fm Test Setup Screen 1p Configuration Loader Screens Loading measuring parameter preset files – Highlight test by touch and press load. -
Page 69: Changing Fv/Fm Measuring Parameters
Changing Fv/Fm measuring parameters - One can change the test parameters by pressing the box in the upper left hand corner of the measuring screen. Fv/Fm measuring Screen 1p Fv/Fm Test Setup Screen Setting the modulation light source intensity - It is adjustable between 0.1:mol and 1 :mol when using a dark clip. -
Page 70: Far Red Light
(Roseqvist and van Kooten 2006).The OS1p provides an automation feature that uses a rolling continuous eight point average to find the highest average value on the top of the saturation pulse. These eight... - Page 71 points represent a time of 25 msec. As a result, the optimal saturation duration is automatically provided for higher plants, algae and cyanobacteria if the duration is long enough. 0.8 seconds is adequate for most plants. The saturation pulse duration is adjustable between 0.1 and 2.0 seconds.
-
Page 72: Entering A Note With A Measurement
Fv/Fm measuring Screen 1p Test Data Collection Control Screen A new feature included with the OS1p makes it possible to enter a note with any measurement, or to require a note with every measurement. To enter a note, press the “Log Setup: button. -
Page 73: Loading And Saving Preset Measuring Routines
Loading measuring parameter preset files – Highlight test by touch and press load. Arrows appear when there are more tests than can be viewed at one time on the screen. Copy only works when an SD card is inserted into the side of the OS1p. -
Page 74: Other Fv/Fm Function Buttons
Other Fv/Fm function buttons Fv/Fm Test Setup Screen 1p Test Data Selection Control Screen Data logging retains all measured values when turned on. Save All Traces for all up coming measurements. Turn “On” the “Save All Traces” button and all future traces will be saved to the measuring file. Turn “Off” the “Save All Traces”... -
Page 75: Measurement Review
Measurement review Fv/Fm Test Setup Screen On the main Fv/Fm measuring screen, the lower right hand side window logs all of the measurements made in the current measuring session for the current file name. One can scroll through measurements by touching the screen. If one touches the top of the review area window, the earliest measurements may be reviewed. -
Page 76: Basic Definitions Of Parameters
Basic definitions of parameters may be viewed by touching the Fv/m section of the Fv/Fm measuring screen. Fv/Fm Test Setup Screen Error messages common to the test modes: There are several common errors that can occur in the test modes. If the battery voltage is 10.5 or less, the warning message “!! Battery Low !!”... -
Page 77: Y(Ii) Protocol: Quantum Photosynthetic Yield Of Psii Y(Ii) Or )F/Fm
In the Y(II) test mode, it is assumed that the sample is being illuminated by an actinic light source to drive photosynthesis. Either the sun or an artificial light can be used. The OS1p has a white light diode that can be used as an actinic light source for Y(II) measurements. -
Page 78: Cookbook Checklist Before Making Y(Ii) Measurements
As with the “Fv/Fm” test, far-red pre-illumination is an option. Far –red illumination may also be turned off or turned on during the entire measurement. If ambient sun light is used for yield measurement, far-red light is provided by sunlight. It can be added in the set up menu if internal artificial illumination is used to drive PSI . - Page 79 (Roseqvist & van Kooten 2006). Some fluorometers allow adjustment of this parameter, and others are preset at the factory at either. 0.8 seconds, or 1.0 seconds for higher plants. 0.8 seconds is the default value on the OS1p and it will work well with almost all higher plants.
- Page 80 10. PSI fluorescence - Part of the fluorescence signal contains PSI fluorescence as well as PSII fluorescence. With Y(II), one is trying to measure variable fluorescence of PSII in a light adapted state. PSI fluorescence is not variable, but the low fluorescent signal from PSI does overlap with PSII.
-
Page 81: Running The Yield Of Psii Y(Ii) Test
“OvrRt” will overwrite the previous measuring file with existing measuring parameter settings. To make a measurement with the default setting programmed into the OS1p at the factory, place the single end of the fiber optic bundle into either the open body clip or the PAR Clip (The PAR Clip is an Optional accessory but it is highly recommended). -
Page 82: Drill Down Menu For Y(Ii)
Drill down menu for Y(II) Press windows to go to other screens Y(II) Measuring Screen Yield Test Setup Screen Y(II) Test Calculation Screen Y(II) Test Data Collection Control Screen Y(II) Measurement Pulse Setup Screen Changes that are made to the “Y(II) Collection Control” screen, the “Y(II) Measurement Pulse Setup”... -
Page 83: Loading And Saving Preset Measuring Routines
Copy only works when an SD card is inserted into the side of the OS1p. When the parameters have been adjusted for a specific set of conditions, the test setup can be saved by pressing “Save preset” while in the Test setup screen. A pop up appears asking if you want to make a new file or use an existing one. -
Page 84: Copy Presets Parameters Into Measuring File
– Insert the SD data card into the SD card port on the OS1p, and press copy while the 1p Configuration Loader screen in open. Presets can be stored on the SD card for future use or transferred to a PC. A preset is different than a measuring file. -
Page 85: Change Y(Ii) Measuring Parameters
Change Y(II) measuring parameters Upper Left Window Y(II) Measuring Screen One can change many of test parameters by pressing the upper left window on the screen. Yield Test Setup Screen Screen revealed by pressing the upper left hand window. Setting modulation light source intensity. It is adjustable between 0.1 :mol and 1 :mol when using an open body clip or a PAR Clip. -
Page 86: New -Automated Modulation Light Set Up
Fm value. The Ideal saturation pulse peak is flat on the top with the trailing edge rounding minimized (Roseqvist and van Kooten 2006).The OS1p provides an automation feature that uses a rolling continuous eight point average to find the highest average value on the top of the saturation pulse. - Page 87 0.1 and 2.0 seconds. Press “Ent” Either the center or right image below, will provide optimal results with the OS1p. Flash Zoom – This button allow a choice between displaying the Y(II) trace on a partial basis or displaying the full saturation pulse trace and the subsequent trailing fluorescence data after the saturation pulse.
- Page 88 One can also test for the proper saturation flash width by using the flash zoom and trying various saturation flash widths. The diagram below explains how to evaluate the flash.
-
Page 89: Multi-Flash Vs. Standard Single Flash Saturation Pulse
Multi-flash vs. standard single flash saturation pulse Multi-flash (“Step Int Lin Regr”) -measuring yield at high actinic light levels. The multi-flash option has been added to correct for the inability of very intense saturation light pulses to completely close reaction centers under high actinic light conditions. - Page 90 Multi-flash Method Regression Analysis Graph Representation of how the flash works Slope is -536 Corrected Fm’ = 557 Infinite :mols saturation pulse 6,000 :mols fluorescence 4,400 :mols 6,000 mols value 2,133 :mols 4,400 mols 2,133 mols 0.16 0.23 0.47 0.10 0.20 0.30 0.40...
-
Page 91: Far Red Light
The Multi-flash option may be turned on or off in the Y(II) Protocol by pressing the second window down from the top on the left had side of the Y(II) measuring screen. Y(II) Measuring Screen Under “Fm’ Measure” select “Step Int Lin Regr”. For using the standard single saturation pulse Standard”... -
Page 92: Pre-Actinic Light
Yield Test Calculation Details screen “Default PAR” When a PAR Clip is not used – When a PAR Clip is not attached to the OS1p, the user may select the approximate pre- illumination intensity. From the Y(II) measuring screen, press the second window down from the top on the left had side to get to the Yield Test Calculation Details screen shown above. - Page 93 ETR appear using the setting selected. When a PAR clip is connected to the OS1p, the “Default PAR” setting is automatically deactivated. Default PAR can be used even when Pre-actinic illumination is not used. In this case, when ambient illumination is used, all ETR values and PAR values found in the measuring file will reflect the preset “Default PAR”...
-
Page 94: Entering A Note With A Measurement
Entering a note with a measurement Y(II) Measuring Screen 1p Test Data Collection Control It is now possible to enter a note with any measurement, or to require a note with every measurement. To enter a note, press the “Log Setup”: button. Next, press “Enter a Note”. A touch keyboard will appear, and one can enter up to a 38 characters note with each measurement. -
Page 95: Other Y(Ii) Or Yield Function Buttons
Other Y(II) or yield function buttons Y(II) Measuring Screen 1p Test Data Collection Control Data Logging - retains all measured values when turned on. Save All Traces -To save all trace data for all up coming measurements, the “Save All Traces”... -
Page 96: Measurement Review
Measurement review Y(II) Measuring Screen On the main Y(II) measuring screen, the lower right hand side window logs all of the measurements made, in the current measuring session, for the current file name. One can scroll through measurements by touching the screen. If one touches the top of the review area window, the earliest measurements may be reviewed. -
Page 97: Help Screen
Help screen Y(II) Measuring Screen The Question mark button is a help screen that provides basic instructions for the screen shown. It also allows one to capture the existing screen image in memory for later retrieval on a PC. Basic definitions of Parameters may be viewed by touching the window shown below in the left hand picture. -
Page 98: Relative Electron Transport Rate
Relative Electron Transport Rate Relative Electron Transport Rate - ETR :mols = (Yield) (PAR) (.84) (.5) (quantum yield of PSII) (measured Photosynthetically Active Radiation measured in :mols quanta m .)( leaf absorption coefficient)(fraction of absorbed light by PSII antennae) Average plant values are used in the standard equation. 0.84 is a good average value for many species of plants (Bjorkman and Demming, 1987). -
Page 99: Error Messages
For a more in depth discussion on this topic, see Quantum photosynthetic yield of PSII – an in depth discussion of its value and limitations in chapter one. “PAR Corr” is for correcting PAR sensor location error according to Rascher (2000). When some artificial light sources are used, Rascher found that the location the PAR sensor relative to the leaf surface can cause an error of up to 10%. -
Page 100: Quenching Protocol - Hendrickson - Klughammer Lake Model
Quenching Protocol – Hendrickson – Klughammer Lake Model: The OS1p can be ordered with various quenching protocols, but the advanced version comes with the Hendrickson – Klughammer lake model protocol as standard. Other options include, Dave Kramer lake model protocol, puddle model protocol, and quenching relaxation protocol that may be used with either the Hendrickson or puddle model protocols. -
Page 101: Cookbook Checklist Before Making Quenching Measurements
Cookbook checklist before making quenching measurements. NPQ and other calculated parameters such as Fv/Fm, Y(II), Y(NPQ), Y(NO) are all normalized ratios that do not use a traceable standard. Instead, their accuracy is determined by properly using the instrument and following the lessons learned about their use with plant physiology by several great researchers. - Page 102 (Schreiber 2006). Some fluorometers allow adjustment of this parameter, and others are preset at the factory at either. 0.8 seconds, or 1.0 seconds for higher plants. 0.8 seconds is the default value on the OS1p and it will work well with almost all higher plants.
- Page 103 This multi-flash method is available on the OS5p and OS1p fluorometers. (see the Multi-flash section in chapter 3 for more details). 13. The time between saturation pulses. Rosenqvist and van Kooten (2006) state that a between one to two minutes is required for complete relaxation of saturation pulse NPQ.
- Page 104 It does not vary with light level or plant stress (Schreiber 2004). With this in mind, comparing samples with similar light histories allows comparison of many types of plant stress. The Plant Stress Guide provided by Opti-Sciences www.optisci.com , references papers that deal with specific types of plant stress and limitations of different chlorophyll fluorescence parameters for measuring plant stress.
-
Page 105: Running The Quenching Test
Running the quenching test Press the “Test icon”, and the Test menu appears. Press “Y(NO) NPQ” and the quenching measuring screen appears. The last file used for this type of measurement will open up, and a small screen will appear within the larger screen. It will show the file name and ask if the file is to be used and if one wants to proceed to measuring with this file and the parameters that have been set. -
Page 106: Screen Drill Down Diagram For Quenching
Screen drill down diagram for quenching Measuring Screen Set up screen #1 Set up screen #2 Set up screen #3 Stored test preset file screen Preset values are selected by touch Log set up screen Arrow appear when there are more preset files than can be displayed... -
Page 107: Saturation Pulse Duration
(Roseqvist and van Kooten 2006).The OS1p provides an automation feature that uses a rolling continuous eight point average to find the highest average value on the top of the saturation pulse. These eight points represent a time of 25 msec. - Page 108 Setting saturation pulse width...
-
Page 109: Saturation Pulse Count
Saturation pulse count Set up screen #1 Flash Count has been set at 10. To get reliable quenching measurements, the leaf must be at steady state photosynthesis, a process that takes between fifteen and twenty minutes at a constant actinic light level. Ten flashes with an interval of 120 seconds allows twenty minutes at a set light level before the quenching measurement is made. -
Page 110: Saturation Pulse Intensity
The resulting value has been shown to correlate well with gas exchange carbon assimilation values. This multi-flash method is available on the OS5p and OS1p fluorometers. (see the Multi-flash section for more details). To use the multi-flash correction, go to the “Kinetic Test Calculation Details Screen” shown above. -
Page 111: Modulation Light Source Intensity
Modulation light source intensity Modulation intensity should be critically set when doing quenching measurements. It must be high enough to prevent a fluorescence signal too low error message, but not high enough to drive photosynthesis. Set up screen #2 The modulation light source intensity is adjustable between 0.1 :mol and 1 :mol. Settings between 5% to 100% can be made in 5% increments. -
Page 112: Far Red Intensity And Duration
1p Kinetic Test Setup Screen Det Gain This is detector electronic gain control. It should only be raised if the modulation intensity can not be raised high enough to prevent a “signal too low” message. Raising this value lowers the signal to noise ratio, and can produce a noisier trace. Far red intensity and duration are set at the default settings of 50% and a duration of 5 seconds. -
Page 113: E Capture And Quantum Eff - Setting Leaf Absorption & Psii Ratio
The OS1p will ask if you want to change the file name when parameters are changed. When one proceeds to the measuring screen, the file that... -
Page 114: Enter A Note
Kwik-Name is a feature that allows the user to use today’s date and time as file name 10 is the year, 12 is the month 23 is the day and 12 is the hour. When it is pressed the number moves to the “Logging file”. This feature has been added as a time saver. Save all traces This allows traces to be saved in the same data file as the measured data. -
Page 115: Measurement Review
Measurement review On the main quenching measuring screen, the lower right hand side window logs all of the measurements made, in the current measuring session, for the current file name. One can scroll through measurements by touching the screen. If one touches the top of the review area window, the earliest measurements may be reviewed. -
Page 116: Test Pre-Set Files. Saving And Loading Test Parameters
Copy only works when an SD card is inserted into the side of the OS1p. Copy - To copy Preset parameters, inset the SD data card into the slot provided on the side of the fluorometer. - Page 117 “Fluorescent signal too low” appears if there is not enough signal getting to the detector. This may be due to the fiber optic being too far from the sample, the intensity of the modulated source being too low or the gain control set too low. “FL >...
-
Page 118: Rapid Light Curves (Rcl)
Rapid Light Curves (RCL) Rapid light curves have been heavily used by researchers to study aquatic plants, and for under canopy research on land. Some traditional fluorescence parameters and methods run into difficulty when the light level changes rapidly, or when one is studying the effects of sun flecks. -
Page 119: How They Work
How they work: Rapid light curves are created by dark adapting samples for a specific period of time and stepping a photosynthesis driving actinic light source for short specific periods of time at specific intensities. The light source is usually built into the fluorometer and the sample is shrouded to allow only the actinic light from the fluorometer to hit the sample. -
Page 120: Curve Fitting Software
Curve fitting software The data can be put into Sigmaplot software where a regression wizard can use a curve fitting model to determine Cardinal points for analysis. (Ralph 2005) Web address for Sigmaplot software: http://www.sigmaplot.com/products/sigmaplot/sigmaplot-details.php Cardinal points are then derived from equations determined by the curve model of the researcher’s choice. -
Page 121: Saturation Pulse Duration
(Roseqvist & van Kooten 2006) The OS1p has a software routine that provides the highest eight-point rolling average intensity value on the top of the saturation pulse peak. This means that it looks only at the... -
Page 122: What Are The Limitations Of Rlc
highest average eight points over a 25msec time frame. It also means that one setting can work well for higher plants, algae, or cyanobacteria. What are the limitations of RLC? The rapid light curve is affected by immediate light history and longer term light history (Rascher 2000, (Ralph 2005). - Page 123 Conclusion: Even with these limitations, the literature supports that Rapid Light Curves offer a tool to investigate the saturation characteristics of plants. One must be careful in drawing additional conclusions.
-
Page 124: Cookbook Checklist Before Making Rapid Light Curve Measurements
Cookbook checklist before making Rapid Light Curve measurements. Fm’ is maximum fluorescence in a light adapted environment. F’ is the fluorescence signal in a light adapted environment. Y(II) is = (Fm’ – Fs’) / Fm’ = )F/Fm’ relative ETR = Y(II) x PAR x 0.84 x 0.5 1. - Page 125 (Roseqvist & van Kooten 2006). Some fluorometers allow adjustment of this parameter, and others are preset at the factory at either. 0.8 seconds, or 1.0 seconds for higher plants. 0.8 seconds is the default value on the OS1p and it will work well with almost all higher plants.
-
Page 126: Running The Rlc Test
Running the RLC Test From the main screen select Test Menu by pressing the touch screen. The Test Selector screen will appear. Press the “RCL” button. The “RLC” measuring screen will appear RLC Measuring Screen small screen second small screen As with the Fv/Fm test, the last file used for this type of measurement will open up, and a small screen will appear within the larger screen. -
Page 127: Drill Down Menu For Rlc
Due to variations in RLC measuring protocols, as well as variations in sun and shade leaves, it is not recommended that you use default settings for RLC measurements. Drill down menu for RLC Press windows to go to other screens Test Menu RLC Measuring Screen Test Setup Screen... -
Page 128: Saving Measuring Parameters
Loading preset measuring parameter files – Highlight test by touch, and press load. Arrows for scrolling appear when there are more tests than can be viewed on the screen. Copy only works when an SD card is inserted into the side of the OS1p. -
Page 129: Loading And Saving Preset Measuring Routines
Copy presets parameters into a new measuring file Insert the SD data card into the SD card port on the OS1p, and press copy while the “1p Configuration Loader” screen is open. Presets can be stored on the SD card for future use or transferred to a PC. -
Page 130: Change Rlc Measuring Parameters
Change RLC measuring parameters Upper Left Window RLC Measuring Screen One can change many of test parameters by pressing the upper left window on the screen. RLC Test Setup Screen Screen revealed by pressing the upper left hand window. Setting modulation light source intensity. It is adjustable between 0.1 :mol and 1 :mol when using an open body clip, a PAR Clip, or a dark clip. -
Page 131: New -Automated Modulation Light Set Up
When adjusting the modulated light for momentary dark adaptation, the modulated light is set correctly, if it is set high enough to get a reading when the measuring button is pressed. The setting is linear. The “Gain” should be as low as possible for the best signal to noise ratio. -
Page 132: Setting Saturation Pulse Duration
25 to 50 msec (Schreiber 1995). Automatic routine for setting of the saturation pulse duration The OS1p will always measure the optimal duration time as long as the duration is set long enough for a particular type of plant. The instrument has an automated software routine that always takes a rolling average of the top continuous eight points on the top of the saturation pulse. -
Page 133: Far Red Light
With the OS1p, the curve in the center or on the right will provide optimal results. RLC Measuring Screen RLCTest Setup Screen Far red light can be used with the internal illuminator for the RLC test to allow the continued reduction of PSI and the re-oxidation PSII. -
Page 134: When The Par Clip Is Used
When the PAR Clip is used The PAR Clip is an Optional accessory but it is highly recommended. Make sure that the fiber bundle is inserted all the way into the hole provided on the PAR Clip, and lock the locking screw. -
Page 135: When A Par Clip Is Not Used "Default Par
Individual Step Set Up Screen When a PAR Clip is not used “Default PAR” When a PAR Clip is not attached to the OS1p, the user may select the approximate pre- illumination intensity. From the RLC measuring screen, press the third window down from the top on the left had side to get to the “Step Set Up Screen”... -
Page 136: Multi-Flash Vs. Standard Single Flash Saturation Pulse
Multi-flash vs. standard single flash saturation pulse Multi-flash (“Step Int Lin Regr”) -measuring yield at high actinic light levels. The multi-flash option has been added to correct for the inability of very intense saturation light pulses to completely close reaction centers under high actinic light conditions. - Page 137 Multi-flash Method Regression Analysis Graph Representation of how the flash works Slope is -536 Corrected Fm’ = 557 Infinite :mols saturation pulse 6,000 :mols fluorescence 4,400 :mols 6,000 mols value 2,133 :mols 4,400 mols 2,133 mols 0.16 0.23 0.47 0.10 0.20 0.30 0.40...
- Page 138 The Multi-flash option may be turned on or off in the RLC Protocol by pressing the second window down from the top on the left had side of the RLC measuring screen. RLC Measuring Screen Under “Fm’ Measure” select “Step Int Lin Regr” For using the standard single saturation pulse method select “Standard”.
-
Page 139: Relative Electron Transport Rate
C plants (Laisk and Loreto,1996). The ratio of PSII reaction centers can be changed in the equation, on the OS1p, by pressing “e capture” and using the key board screen. Similarly, the over all leaf absorption can be changed by pressing “quantum eff”. This correction is not needed for most relative comparison ETR applications, however, it has been made available for more exacting work when necessary. - Page 140 Notes: When using the blue modulated light it was found that the average absorption value should be set to 0.94 instead of 0.84 as is used by the red modulated light. By plotting ETR vs. PAR, potential ETR rates, photosynthetic capacity, and ETR rate limitations, can be determined at given light intensities.
-
Page 141: Entering A Note With A Measurement
Entering a note with a measurement RLC Measuring Screen RLC Log set up screen It is now possible to enter a note with any RLC. To enter a note, press the “Log Setup”: button. Next, press “Enter a Note”. A touch keyboard will appear, and one can enter up to a 38 characters note with each measurement. -
Page 142: Measurement Review
Measurement review RLC Measuring Screen On the main RLC measuring screen, the lower right hand side window logs all of the measurements made, in the current measuring session, for the current file name. One can scroll through measurements by touching the screen. If one touches the top of the review area window, the earliest measurements may be reviewed. -
Page 143: Help Screen
Help screen Y(II) Measuring Screen The Question mark button is a help screen that provides basic instructions for the screen shown. It also allows one to capture the existing screen image in memory for later retrieval on a PC. Basic definitions of Parameters may be viewed by touching the window shown below in the left hand picture. -
Page 144: Chapter 4 • Os5P Data Management
A Screen will appear that says: USB Remote PC Access Mode V1.0 The OS1p is now connected to your host PC. Ready to transfer data or update files. Use the PS eject feature to stop drive access. Do not disconnect the USB cable when data is being transferred or the file may be lost or... -
Page 145: File Transfer By Usb Cable
File transfer by USB cable Turn on the OS1p and press “Data Mgnt”. Next, plug in the USB cable provided to a PC and the OS1p. When the PC and the fluorometer are connected, the fluorometer screen will display a message titled: USB Remote PC Access Mode V1.0 and a green colored message. - Page 146 Microsoft Windows Screen on a PC From this window, the various files may be opened using Excel for viewing, analysis or graphing. (The “System” folder is the software that is used to run the fluorometer. If updates become available this window can also be used to update software with an e-mailed link.
- Page 147 Turn on the OS1p and press “Data Mgnt”. Next, plug in the USB cable provided to a PC and the OS1p. When the PC and the fluorometer are connected, the fluorometer screen will display a message titled: USB Remote PC Access Mode V1.0 and a green colored message. Under these conditions, the fluorometer becomes a removable drive for the PC.
- Page 148 Select Excel Microsoft Windows Screen on a PC Microsoft Windows Screen on a PC...
-
Page 149: Ejection Process
Microsoft Windows Screen on a PC When done, there is usually a double beep sound from the OS1p, and a message appears on the OS1p screen that says that “Disconnect is successful. Unplug the USB Cable to... -
Page 150: File Transfer By Sd Card And Data Management Utilities
Data Management Screen File selected by touch. The Main Menu appears a few seconds after the OS1p is turned on. Press the “Data Management”, an the Data Management Screen appears. “HDD:” is for the non-volatile 1 GByte of internal flash memory. Flash memory retains data even when power is lost. - Page 151 Do not remove the card when transferring data. To remove the card from the OS1p, push in the card and it will pop out. Remove the card. If one does not have an MMC/SD data card port on their computer, take the MMC/SD adapter provided with the OS1p, and insert it into a USB port while the computer is on.
- Page 152 With many versions of the Windows operating system, a small window appears on the PC screen that should look something like the one pictured below. If it does not appear then go to the page section shown below the computer mouse Select the “Open folder to view files”...
- Page 153 Open Windows Explorer, and click on “My Computer”. The image should look something like the one shown below. The OS1p drive may be listed as OS1P and the appropriate new drive letter designation. Below, the drive is listed as G, but it may be any letter.
- Page 154 The Data card may be removed from your PS when done. Do not remove the data card until file transfer is complete. “Erase” allows the erasure of files in the flash memory, or on the inserted SD data card. Select HDD to erase a file from the internal flash memory, or SD to erase a file from an SD card.
-
Page 155: Data Viewer
Data Viewer The data management section has a data viewer that allows the review of all previous measurements in a measuring file, and saved graphs, without exporting the file to Excel. To use this feature go to the Main Menu screen and press “Data Mgmt” Main Menu The following data management screen will appear. - Page 156 File viewer with no graph File viewer with graph By using the “Line” arrows, you can select the measurement of interest. It will become highlighted and if there is a graph associated with the data, it will be displayed in the lower left hand corner of the screen, as shown on the right hand screen.
-
Page 157: Software Updates
Software Updates From time to time, software updates may be available for improvement of existing functionality or to increase instrument functionality. To update software versions., contact Opti-Sciences Inc. 603-883-4400 www.optisci.com, or support@optisci.com , 8 Winn Ave. Hudson, NH 03051. -
Page 158: Chapter 5 Diagnostics
Software Version Notes: The Battery test and Access command require a special password from Opti-Sciences and they can not be accessed without contacting the factory. The Fluorometer will not charge unless it is turned off. However, It may be used with AC power when it is... -
Page 159: Appendix A • Maintenance
PAR Clip. Fluorometers by themselves, do not require calibration The Nickel Metal Hydride battery that is supplied with the OS1p, is a very reliable type of battery. It exhibits no memory effects whatsoever. It is recommended that when the system is not in use, even for very long periods of time, that the charger should be plugged into the OS1p and into a wall outlet for continuous charging. -
Page 160: Cleaning
As the battery ages, it will lose its ability to hold a charge. When this gets to four hours, send the unit to the factory for battery replacement. Note: you can run the OS1p off the battery charger alone, however it will not recharge while the instrument is on. -
Page 161: Trouble Shooting Power Problems
Current models are supplied with a Nickel Metal Hydride Batteries. The charge life of the NMH battery is eight and twelve hours between charges, under most conditions. The charger should be plugged in the OS1p and a wall outlet when not in use. Prolonged periods of discharge will significantly decrease it’s life span. -
Page 162: Trouble Shooting Tables
Trouble shooting tables Symptom Probable Cause Cure Unit will not turn on Dead battery Charge battery or use AC power. Unit resets when a test is Battery insufficiently Charge battery charged Battery has become "weak" Contact factory and needs replacement Display dims or changes Battery low Charge battery... - Page 163 - or - Odd characters appear on various screens The main screen does not A software bug that has Contact Opti-Sciences Inc appear when the instrument been corrected in the latest to reload the latest version is turned on, version of software of software.
- Page 164 PAR connected cuvette attached Charge Status Light It only turns on when the OS1p is turned off and the unit is plugged in. The light turns green when Nothing is required Green - the Nickel Metal Hydride battery is fully charged.
-
Page 165: Appendix B• Par Clip
Appendix B• PAR Clip PAR Clip The PAR leaf Clip is designed to provide data to the OS1p system on Photosynthetically Active Radiation, or PAR and leaf temperature conditions. This clip resembles the standard 45 angle open body clip provided with the OS1p, with two additional features. -
Page 166: Using The Par Clip
Using the PAR Clip The PAR clip must be connected to the accessory port on the OS1p when the unit is turned off. The PAR Clip will continuously read different light or irradiation values as PAR in the Y(II) and quenching kinetic tests, as it moves from one light condition to another before a measurement. -
Page 167: What Is The Value Of A Par Clip In Photosynthesis Measurement
at its current orientation and changing the angle of the leaf will cause plant mechanisms to start to adjust to the new actinic light level. Yield measurements are always done at steady state photosynthesis or errors will result. Reoriented leafs are not at steady state. According to Maxwell and Johnson (2000), it take between fifteen and twenty minutes for most leaves to reach steady state. -
Page 168: Appendix C • Technical Specifications
Measured and calculated parameters Optional ETR, PAR, and leaf temperature are measured when the optional PAR Clip is purchased. Standard Advanced OS1p parameters Fo, Fm, Fv/Fm, Fm’, Fs, Y(II) or ) F /Fm’) Hendrickson - Klughammer and Schreiber’s simplified lake model quenching equations Y(II) = (Fms -Fs)/Fms or )Fm’/ Fm’... - Page 169 = ((Fm-Fmt) / Fm-Fms)) Relaxation of q starts at about forty minutes and can take up to sixty hours. q can be determined from the dark adapted Fm measurement and the saturation pulse after 20 minutes used for q . (Values can be changed in Excel). Fod (or Fo’) q , NPQ, q PAR, Leaf temperature, estimated ETR (using Standard PAR Clip).
- Page 170 User Interface Display: 320 x 240 dot super-twist Color LCD, with LED back light., touch screen Power Supply Internal rechargeable sealed Nickel Metal Hydride battery, or AC current. Battery Life 8 to 12 hours of continuous operation. Dimensions 7.75 in x 6 in x 4.5 in. in carrying bag 7.25 in x 5.38 in x 3.25 in without bag Weight 3.0 lbs.
-
Page 171: Appendix D • Data Formats
Excel or other spread sheet products. Data exists in two forms in the OS1p. The first type is the fluorescence signal over the course of a test. This "raw data" is useful when visualizing what is happening dynamically in photosystem II, as it is exposed to the different illumination sources over the course of the test. -
Page 172: Data Format Information
Data format information Data formats for test protocols are listed below. All data types and output methods are presented in a ASCII format that is comma delimited with a character 13 (<CR.>) code at the end of each line. This type of data output format, while bulkier than binary coding, is compatible with most data analysis and spreadsheet programs "Import"... -
Page 173: Y(Ii) Data File Format
Y(II) data file format... -
Page 174: Quenching Data File Format - Hendrickson - Klughammer Equations
Quenching data file format – Hendrickson – Klughammer equations... -
Page 175: Rcl Rapid Light Curve Data Format
RCL Rapid Light Curve data format...
Need help?
Do you have a question about the OS1p and is the answer not in the manual?
Questions and answers