Chapters
Table of Contents
Troubleshooting

Related Manuals for Stanford Research Systems RGA100


Summary of Contents for Stanford Research Systems RGA100
- Page 1 Operating Manual and Programming Reference Models RGA100, RGA200, and RGA300 Residual Gas Analyzer 1290-D Reamwood Ave. Sunnyvale, CA 94089 408-744-9040 · 408-744-9049 fax info@thinkSRS.com · www.thinkSRS.com Revision 1.8 (May, 2009)
- Page 2 (1) year from the date of shipment. Service For warranty service or repair, this product must be returned to a Stanford Research Systems authorized service facility. Contact Stanford Research Systems or an authorized representative before returning this product for repair.
- Page 3 Safety and Preparation For Use Printed in U.S.A. Safety and Preparation for Use WARNING! Dangerous voltages, capable of causing injury or death, are present in this instrument. Use extreme caution whenever the instrument cover is removed. Do not remove the cover while the unit is plugged into a live outlet.
- Page 4 SRS Residual Gas Analyzer...
-
Page 5: Table Of Contents
Contents Contents Safety and Preparation For Use ....................... iii Contents ..............................v Specifications ............................xiv Command List............................xvi Chapter 1 Getting Started Unpacking ..............................1-2 Before You Open the Box......................1-2 Checklist............................1-2 Standard Equipment / Supplies ....................1-2 Accessories..........................1-2 Optional Equipment ........................1-2 Related Equipment ........................1-3 Installation..............................1-4 Introduction ..........................1-4 Probe Installation ........................1-4... - Page 6 Contents Chapter 3 RGA Quadrupole Probe Introduction ............................. 3-2 Ionizer ..............................3-3 Description ..........................3-3 Principle of operation ......................... 3-3 Parameter Settings ........................3-4 Quadrupole mass filter........................... 3-7 Description ..........................3-7 Principle of operation ......................... 3-8 Mass Range, Resolution and Throughput ................3-9 Zero Blast Suppression......................
- Page 7 Contents Mass Filter Power Supply........................4-10 Maintenance and Service ........................4-11 Chapter 5 RGA Windows Software Overview ..............................5-3 Program Structure........................5-3 RGA Files .............................5-3 RGA files (.rga).........................5-3 RGA Scan log files (.ana .hst .tbl) ....................5-3 RGA ASCII Data files (.asc).....................5-4 RGA Graph Metafiles (.wmf) ....................5-4 System Requirements.........................5-4 Getting Started............................5-5 Starting the RGA Software ......................5-5...
- Page 8 viii Contents Running in Split Display Mode ....................5-16 Manual Scaling of Graphs......................5-16 Using Scan Data as Background..................... 5-17 General Utilities............................. 5-18 Using the Data Cursors ......................5-18 Cursor command........................5-18 Cursor Properties command ....................5-18 Scheduled Saving of Data......................5-18 Logging Scans ........................
- Page 9 Contents Communication Errors..........................6-9 Command errors........................6-9 Parameter errors ........................6-9 Jumper Protection violation ......................6-9 Troubleshooting the RGA communications ..................6-11 Programming the RGA Head ........................6-12 Initializing the RGA Head......................6-12 Programming the Ionizer ......................6-13 Programming the Detector .......................6-14 Setting up Analog Scans ......................6-16 Setting up Histogram Scans ....................6-18 Single Mass Measurements .....................6-20 Total Pressure Measurements ....................6-22 Storing information in the RGA Head..................6-23...
- Page 10 Contents MGparam, param: 0.0000 - 2000.0000,?................ 6-55 MVparam, param: 0 - 2490,?..................6-55 SPparam, param:0.0000 - 10.0000, ?................6-56 STparam, param:0.0000 - 100.0000, ?................6-56 Mass Filter Control Commands....................6-58 MLparam, param: 0.0000 - M_MAX ................6-58 Error Reporting Commands..................... 6-59 EC? ..........................
- Page 11 Contents Procedure.............................8-8 Filament Replacement ..........................8-11 Handling and care of the filament....................8-11 Equipment ..........................8-11 Procedure...........................8-11 CDEM Handling and Care ........................8-14 Handling and mounting ......................8-14 Operating pressure ........................8-14 Operating temperature......................8-14 Bakeout temperature ........................8-14 Operating voltage........................8-14 Initial pump-down........................8-14 Contamination ...........................8-15 Storage ............................8-15 CDEM Pre-conditioning ........................8-16 CDEM Refreshment ..........................8-17 Materials .............................8-17 Procedure...........................8-17...
- Page 12 Contents Chapter 10 RGA Circuit Description 10-1 Overview of the RGA ..........................10-3 Circuit Description..........................10-4 General Description........................10-4 Circuit Boards ........................... 10-5 Description of Schematics........................10-6 Schematic name: QMSE_T1 ....................10-6 Microprocessor ........................10-6 Digital I/O Ports........................10-6 The LED port.......................... 10-7 The MPX port.........................
- Page 13 Contents xiii Appendix B Using SRS RGA’s to Sample High Pressure Gasses Appendix C Do I Need a PPM100 Partial Pressure Monitor for My SRS RGA? Appendix D SRS RGA LabVIEW Development Kit Glossary of Terms Vacuum References RGA Parts List and Schematics Declaration of Contamination of Vacuum Equipment Form SRS Residual Gas Analyzer...
-
Page 14: Specifications
Specifications Specifications Operational Mass Range: RGA100 1 to 100 amu RGA200 1 to 200 amu RGA300 1 to 300 amu Quadrupole Mass filter type (Cylindrical rods, rod diameter: 0.25”, rod length: 4.5”) Faraday cup (FC) - standard Detector type Electron multiplier (CDEM) - optional Resolution Better than 0.5 amu @ 10% peak height... - Page 15 Specifications Thoriated Iridium (dual) with firmware protection. Field Filament replaceable. 1 to 10 W Degas ramp-up. Degas 25 to 105 V, programmable. Electron energy 8 or 12 V, programmable. Ion energy 0 to 150 V, programmable. Focus voltage 0 to 3.5 mA, programmable. Electron emission current General...
-
Page 16: Command List
Command List Command List Initialization Name Description Parameters Echo Identification Query ID String Initialization 0,1,2 STATUS Byte Ionizer Control Name Description Parameters Echo Degas Ionizer 0-20, * STATUS Byte Electron Energy 25-105, *, ? STATUS Byte or query response Electron Emission Current 0-3.50, *, ? STATUS Byte or query response... - Page 17 DET_ERR Byte Query Query response QMF_ERR Byte Query Query response CEM_ERR Byte Query Query response FIL_ERR Byte Query Query response RS232_ERR Byte Query Query response Note: M_MAX= 100 for RGA100, 200 for RGA200 and 300 for RGA300. SRS Residual Gas Analyzer...
- Page 18 xviii Command List SRS Residual Gas Analyzer...
-
Page 19: Chapter 1 Getting Started
Chapter 1 Getting Started This chapter describes the process of unpacking, checking and installing the SRS RGA on a vacuum system. Please read and follow all installation instructions to insure that the optimum performance of the instrument is not compromised during the installation process. In This Chapter Unpacking.............................. -
Page 20: Unpacking
7. Read the General Operation chapter of this manual for an overview of the instrument and its functions. 8. Inspect all components of the SRS RGA System upon unpacking. Report any damage to Stanford Research Systems immediately. Compare the contents of the shipping container with the Checklist below and report any discrepancies. Checklist Standard Equipment / Supplies 1. -
Page 21: Related Equipment
Unpacking 2. Option 02 Built-in power module for AC line operation (Option 02). Preinstalled at the factory. Includes one power cord. 3. Option 03 Electron Multiplier Ion Counting Output (must also have Option 01.) 4. Option 04 NIST Traceable 5 % calibration (N 5. -
Page 22: Installation
Installation Installation Introduction The standard SRS RGA System consists of: 1. RGA Probe. 2. Electronics Control Unit (ECU.) 3. RGA Windows Software. Specific hardware requirements and installation instructions are needed for each one of the components. Important Follow the installation steps in the strict order in which they are presented in this chapter. -
Page 23: Hardware Requirements
Installation Wear gloves! Do not talk or breath directly into the probe’’s ionizer. Use clean tools during the installation procedure! Protect the integrity of the Vacuum seals: Do not use nonmetal seals. Avoid scratching the metal seals. Verify that the vacuum port is electrically grounded before attempting the installation of the RGA Probe on the vacuum system. -
Page 24: Procedure
Installation Enough clearance must be allowed for the ECU box that attaches directly to the probe’’s feedthru flange. Choose the orientation of the ECU box prior to the installation of the probe. Six different orientations can be obtained rotating the probe about its axis and lining up the bolt holes of the 2 3/4””... - Page 25 Installation and do not use non-metal gaskets. Important: Avoid touching the internal walls of the vacuum port with the repeller cage during the installation procedure, since that could lead to serious misalignment of the ionizer. Get an extra hand from a co-worker if necessary. RGA Mounting Flange Vacuum Chamber RGA Cover Nipple...
-
Page 26: Electronics Control Unit Installation
Failure to follow the installation instructions below could result in damage to the ceramic feedthru connectors of the probe’’s flange, and would require sending the entire unit back to Stanford Research Systems for a complete flange replacement. Hardware Requirements 1. External Power source: Standard ECU boxes require an external 24 +/- 2V DC power supply @ 2.5 Amps... - Page 27 Installation 2. Power cables: External 24V power supplies must have a cable with a 9 pin, type D, female connector on the free end, wired as described in the ““ECU- 24VDC power connector”” diagram shown below. Note: A power cable, with a properly wired, female, DB-9 cable connector, is provided by SRS with all RGA units that do not include the built-in power module (Option 02).
-
Page 28: Procedure
1-10 Installation Procedure 1. Begin by inspecting the front panel of the ECU box. Use the following diagram as a reference during installation. Probe alignment holes WARNING High Voltage inside this unit. See manual for safety notice. Clearance holes (6 places) Internal connectors Locking screws (2 places) -
Page 29: Rga Windows Installation
Installation 1-11 feedthrus. Instead, rock the ECU box up and down, while gently pushing on its back, until the connectors line up. Once the connectors are all lined up, push the box in the rest of the way. 7. Once the ECU is in place, use the knobs on the back panel of the ECU box, to turn the locking screws and lock the assembly in place. -
Page 30: Turning On The Rga
1-12 Installation 2. Insert the RGA Windows software CD into the CD-drive of the computer. 3. Run the Setup program. 4. The software is automatically and completely installed by the RGA Setup Wizard. Read and follow all instructions. 5. An ““RGA”” program group with the ““RGA 3.0”” icon is automatically created at the end of the installation process. -
Page 31: Running The Srs Rga System
Running the SRS RGA System 1-13 Running the SRS RGA System This section describes how to launch the RGA Windows program and start acquiring data from the RGA Head. An analog scan from 1 to 50 amu is executed as an example. Important: The following steps assume that all the installation instructions described in the previous section were completed. - Page 32 1-14 Running the SRS RGA System Head Menu. A green status LED on the back panel of the ECU box indicates the emission status of the filament at all times and it provides the fastest way to verify if the filament is emitting electrons. 6.
-
Page 33: Chapter 2 Rga General Operation
Chapter 2 RGA General Operation This chapter describes the basic properties of the Stanford Research Systems Residual Gas Analyzer (SRS RGA). In This Chapter What is an RGA?............................. 2-2 The SRS RGA ............................2-3 Basic Operating Modes of the SRS RGA ..................... 2-5 The SRS RGA as a Mass spectrometer .................. -
Page 34: What Is An Rga
What is an RGA? What is an RGA? Complete characterization of a vacuum environment requires the detection of all the component gases present, as well as measurement of the total pressure. The instruments used for this purpose are called Residual Gas Analyzers or Partial Pressure Analyzers. A Residual Gas Analyzer (RGA) is mass spectrometer of small physical dimensions that can be connected directly to a vacuum system and whose function is to analyze the gases inside the vacuum chamber. -
Page 35: The Srs Rga
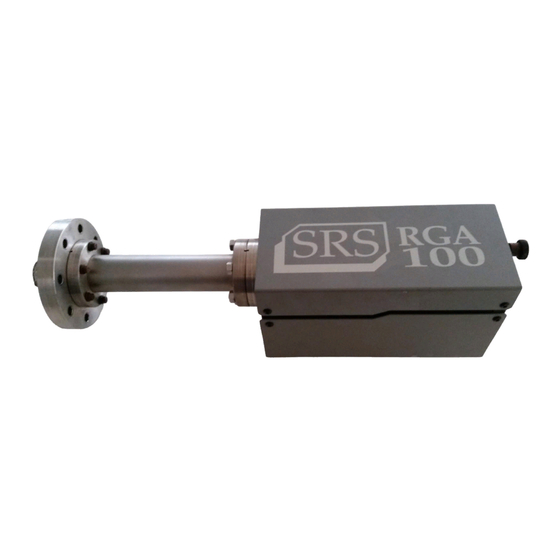
The SRS RGA The SRS RGA The SRS RGA is a mass spectrometer consisting of a quadrupole probe, and an Electronics Control Unit (ECU) which mounts directly on the probe’’s flange, and contains all the electronics necessary to operate the instrument. Ionizer Quadrupole Probe Electronics Control... - Page 36 The SRS RGA is available in three different models with mass ranges of 1 to 100 (RGA100), 1 to 200 amu (RGA 200), and 1 to 300 amu (RGA300). All models operate in the ““Constant Resolution”” or ““Constant m”” mode, with M preset to one amu at the factory.
-
Page 37: Basic Operating Modes Of The Srs Rga
Basic Operating Modes of the SRS RGA Basic Operating Modes of the SRS RGA The SRS RGA is a mass spectrometer that analyzes residual gases by ionizing some of the gas molecules (positive ions), separating the resulting ions according to their respective masses and measuring the ion currents at each mass. -
Page 38: The Srs Rga As A Single Gas Monitor
Basic Operating Modes of the SRS RGA RGA Windows uses the two modes to generate the data for the Analog and Histogram Scan Modes. Analog scanning is the most basic operation of the RGA as a quadrupole mass spectrometer. During analog scanning the quadrupole mass spectrometer is stepped at fixed mass increments through a pre-specified mass-range. - Page 39 Basic Operating Modes of the SRS RGA Important: The RGA’’s sensitivity factor for total pressure measurements is highly mass dependent. Some residual mass discrimination takes place in the filter that results in the mass dependence of the RGA readings being different from that of the Bayard-Alpert gauges.
-
Page 40: Residual Gas Analysis Basics
Residual Gas Analysis Basics Residual Gas Analysis Basics The SRS RGA can perform both qualitative and quantitative analysis of the gases in a vacuum system. Obtaining spectra with the SRS RGA is very simple. Interpreting the spectra, that is, understanding what the spectra is trying to tell you about your vacuum system requires some work. -
Page 41: Partial Pressure Measurement
Residual Gas Analysis Basics In cases where only the major components are of interest, some of the minor peaks of the spectrum will remain unassigned. If only a few species are being monitored, only the peaks corresponding to the substances of interest need to be assigned and monitored. Notes on Fragmentation Patterns: The electron impact type of ionizer used in modern RGA’’s almost always causes more than one kind of ion to be produced from a single type of gas molecule. - Page 42 2-10 Residual Gas Analysis Basics = total peak height (amps) of the spectrum at mass number M. = peak height contribution (amps) from gas g at mass M. is related to the fragmentation pattern, the RGA’’s sensitivity and the partial pressure of gas g by the equation: where: = Fragmentation factor of gas g at mass M: Ratio of ion signal at mass M to the ion...
-
Page 43: Partial Pressure Sensitivity Factors
Residual Gas Analysis Basics 2-11 Partial Pressure Sensitivity Factors The partial pressure sensitivity of the RGA to a gas g, , is defined as the ratio of the (H-H (P-P change in principal mass peak height to the corresponding change total pressure due to a change in partial pressure of the particular gas species. - Page 44 2-12 Residual Gas Analysis Basics The underlying assumption when using sensitivity factors in quantitative calculations is that there is a linear relation between the partial pressure and the corresponding RGA signals of the gases. Deviations from linearity are to be expected above 10 Torr due to space charge effects in the ionizer and ion-neutral scattering interactions in the filter.
- Page 45 Residual Gas Analysis Basics 2-13 Torr of Ar. Note that equation (4) is a particular case of equation (3), and that the fragmentation factor for the principal peak of Ar is one by definition. SRS Residual Gas Analyzer...
- Page 46 2-14 Residual Gas Analysis Basics SRS Residual Gas Analyzer...
-
Page 47: Chapter 3 Rga Quadrupole Probe
Chapter 3 RGA Quadrupole Probe This chapter describes the design and principles of operation of the components of the RGA Quadrupole probe. In This Chapter Introduction ............................. 3-2 Ionizer............................... 3-3 Description ..........................3-3 Principle of operation ......................... 3-3 Parameter Settings ........................3-4 Quadrupole mass filter........................... -
Page 48: Introduction
Introduction Introduction The SRS RGA is a mass spectrometer consisting of a quadrupole probe, and an Electronics Control Unit (ECU) which mounts directly on the probe’’s flange and contains all the necessary electronics for operating the instrument. Ionizer Quadrupole Probe Electronics Control Unit (ECU) Figure 1 Quadrupole Head Components... -
Page 49: Ionizer
Ionizer Ionizer Positive ions are produced in the ionizer by bombarding residual gas molecules with electrons derived from a heated filament. The ions are then directed toward the entrance of the ion filter where they are separated based on their mass-to-charge ratio. Description The SRS RGA ionizer is of an open design (wire mesh construction) with cylindrical symmetry and mounted co-axially with the filter assembly. -
Page 50: Parameter Settings
Ionizer Filament Repeller Focus plate Anode grid Figure 4 Ionizer Schematic The filament is the source of the electrons used in ionizing the gas molecules. It operates at a negative potential relative to ground and is resistively heated to incandescence with an electrical current from the emission regulator. - Page 51 Ionizer The ECU contains all the necessary high voltage and current supplies needed to bias the ionizer’’s electrodes and establish an electron emission current. The ionizer settings can be directly controlled and monitored by the user through the RGA’’s high level command set.
- Page 52 Ionizer at low mass settings (1 to 10 amu) and can easily be eliminated biasing the focus plate at least 30V more negative than the repeller. The electron emission current is the electron current from the filament to the grid. The available emission current range is 0 to 3.5 mA.
-
Page 53: Quadrupole Mass Filter
Quadrupole mass filter Quadrupole mass filter Positive ions are transferred from the ionizer into the quadrupole where they are filtered according to their mass-to-charge ratios. Ions that successfully pass through the quadrupole are focused towards the detector by an exit aperture held at ground potential. Description The quadrupole mass filter is an electrodynamic quadrupole operated by a combination of DC and RF voltages. -
Page 54: Principle Of Operation
Quadrupole mass filter Principle of operation The following figure schematically represents the quadrupole mass filter and its connections. Quadrupole axis – – ions – – cosωt -(U+V cosωt) Figure 6 Quadrupole Connections During operation, a two dimensional (X-Y) quadrupole field is established between the four cylindrical electrodes with the two opposite rods connected together electrically. -
Page 55: Mass Range, Resolution And Throughput
Quadrupole mass filter free path of the ions. The general principle of operation of the filter can be visualized qualitatively in the following terms: One rod pair (X-Z plane) is connected to a positive DC voltage upon which a sinusoidal RF voltage is superimposed. The other rod pair (Y-Z plane) is connected to a negative DC voltage upon which a sinusoidal RF voltage is superimposed, 180 degrees out of phase with the RF voltage of the first set of rods. - Page 56 The SRS RGA is offered in three different models with mass ranges of 1 to 100 (RGA100), 1 to 200 amu (RGA 200) and 1 to 300 amu (RGA300). The main difference between the three models is given by the maximum supply voltage available to the rods.
-
Page 57: Zero Blast Suppression
Quadrupole mass filter 3-11 It is well established that the resolution attainable by a quadrupole is limited by the number of cycles of RF field to which the ions are exposed before they reach the detector. In practice, the minimum resolution ( M ) value attainable is mass independent, linearly related to the ion energy, and inversely proportional to the square of the product of the quadrupole length and frequency. -
Page 58: Ion Detector
3-12 Ion Detector Ion Detector Positive ions that successfully pass through the quadrupole are focused towards the detector by an exit aperture held at ground potential. The detector measures the ion currents directly (Faraday Cup) or, using an optional electron multiplier detector, measures an electron current proportional to the ion current. -
Page 59: Faraday Cup Operation
Ion Detector 3-13 necessary electrical contacts. A plate (CDEM Anode) mounted at the exit of the CDEM collects the secondary electrons. The resulting electron current flows into the electrometer through a separate feedthru of the flange. The entire setup is self -aligning and easily serviced by the user in the field. For example, removing the screw that fastens the clamp to the HV rod is all that is needed to replace the CDEM (Please see the Maintenance chapter for details.) FC detection is standard in all RGA probes. - Page 60 3-14 Ion Detector attracted away from the FC and strike the cone at high velocity producing electrons by secondary electron emission. The secondary electrons are subsequently accelerated down the four channels and produce more secondary electrons. For each ion entering the cone of the CDEM, and depending on the bias voltage applied, up to 10 electrons come out at the back end and are picked up by a grounded plate (the CDEM anode).
- Page 61 Ion Detector 3-15 mass discrimination effects, gain instabilities and finite lifetime of the device. A good understanding of these limitations is very important to assure accurate quantitative measurements. The dynamic range of electron multipliers is determined by their dark current at the low end, and by the bias current value at the high end.
- Page 62 3-16 Ion Detector by cleaning them in high purity isopropyl alcohol. The procedure is described in the RGA Maintenance chapter (CDEM Refreshment section) and, even though it is not guaranteed to always work, it is worth trying as a last resort before discarding a multiplier.
-
Page 63: Hardware Modifications
Hardware modifications 3-17 Hardware modifications Warning The information in this section is for the use of Qualified Personnel only. To avoid shock and irreparable damage to the unit, do not attempt any of the changes in this section unless you are authorized to do so. Read and follow all ““Safety and Precaution””... -
Page 64: Repeller Removal
3-18 Hardware modifications quadrupole). For example, it is well established that the correct alignment of the anode grid is critical to the operation of RGA spectrometers: a misalignment as small as 0.010”” can result in decreased sensitivity, decreased resolution and peak shape deterioration ( i.e. peak splitting). -
Page 65: Rga Cover Nipple Replacement
Hardware modifications 3-19 In order to scan without filament emission, uncheck the ““warn if the filament off”” box in the ionizer settings menu of the RGA software. RGA Cover Nipple Replacement A stainless steel tube covers the probe assembly with the exception of the ionizer. This tube, referred to as the RGA Cover Nipple, contributes to the overall capacitance of the quadrupole rod assembly, and should not be removed from the probe unless it is replaced with a similar grounded metal shield tube inside the vacuum system (see below). -
Page 67: Chapter 4 Rga Electronics Control Unit
Chapter 4 RGA Electronics Control Unit This chapter describes the most important features of the RGA Electronics Control Unit. In This Chapter Introduction ............................. 4-2 Front Panel .............................. 4-3 Rear Panel ............................... 4-4 +24VDC@2.5A Connector ......................4-4 RS232/DCE/28.8k Connector ..................... 4-5 LED’’s ............................ -
Page 68: Introduction
Introduction Introduction The SRS RGA is a mass spectrometer consisting of a quadrupole probe, and an Electronics Control Unit (ECU). The ECU completely controls the operation of the RGA, handles its data and transmits it to the computer for analysis and display. Ionizer Quadrupole Probe Electronics Control... -
Page 69: Front Panel
Front Panel Front Panel The ECU mounts directly on the probe’’s feedthru flange. Its front panel is designed to rest flat against the back surface of the probe’’s flange, and it is not visible while the ECU is locked in place. Probe alignment holes WARNING High Voltage inside... -
Page 70: Rear Panel
Rear Panel Rear Panel The rear panel of the standard ECU Box has two connectors, two locking knobs, a cooling fan, and eight LED’’s. Units with the optional, built-in power module (Option 02) also have a fused Power Entry Module with a built-in power switch. Locking knob RS232/DCE/28.8k RS232 connector... -
Page 71: Rs232/Dce/28.8K Connector
Rear Panel Pin # Voltage +24VDC +24VDC Ground Ground Ground +24 VDC Ground +24 VDC Ground Figure 4 ECU 24 VDC Power Connector RS232/DCE/28.8k Connector Use this connector to interface the RGA to a computer. The RS232 interface connector of the RGA is configured as a DCE (transmit on pin 3, receive on pin 2) with full RTS/CTS handshaking enabled. -
Page 72: Led Functionality
Rear Panel LED Functionality LED's on the rear panel of the ECU provide constant feedback on the status of the filament, electron multiplier, electronics system, probe and communications, and alert the user of any detected errors. This section describes in detail the function of each LED. RS232/DCE/28.8k Lock ERROR... -
Page 73: Error (Red) Led's
Rear Panel ElecMult: The ElecMult LED is turned on whenever the electron multiplier detector is active (i.e. when a finite biasing voltage is applied across the electron multiplier). Several different mechanisms can turn off the electron multiplier and its LED: a null bias voltage request by the user, a Degas process, and an overpressure that shuts down the filament emission. -
Page 74: Electrometer
Electrometer Electrometer Detection limit vs. scan rate A unique, temperature-compensated, logarithmic picoammeter built into the ECU box measures the ion currents collected by the Faraday cup (FC), or electron multiplier (CDEM). The output voltage of the electrometer is equal to the logarithm of the ion current so that several decades of signal can be read on the meter without any gain switching being necessary. -
Page 75: Adjusting The Zero Of The Ion Detector
Electrometer setting available in the Scan Parameter Setups of the Scan menu is used to set the NF parameter value in the RGA Head according to the equation: NF = ScanSpeed - 1. The following table summarizes the performance of the RGA electrometer during mass measurements as a function of the Scan Speed and NF settings. -
Page 76: Mass Filter Power Supply
ECU, under microprocessor control, and based on internal calibration parameters permanently stored in non-volatile memory. The difference between the three RGA models (RGA100, RGA200 and RGA300) is given by the maximum supply voltage available to the rods. For example, the maximum RF amplitude delivered to the probe in the RGA300 is 1284 V (2568 Vpp) and corresponds to ions with mass of 300 amu (8.56 Vpp/amu). -
Page 77: Maintenance And Service
Maintance and Service 4-11 Maintenance and Service The ECU box does not have any serviceable parts and does not require any routine maintenance. Do not perform any unauthorized service, adjustment or modification of the instrument. Do not install any substitute parts. Contact the factory for instructions on how to return the instrument for authorized service and adjustment. - Page 78 4-12 Mass Filter Power supply SRS Residual Gas Analyzer...
-
Page 79: Chapter 5 Rga Windows Software
Chapter 5 RGA Windows Software For detailed information and command description of the RGA program please refer to the RGA On-Line Help files provided with the program disks. The RGA help system includes current and detailed description of all the features, procedures, and commands available in the program. In This Chapter Overview..............................5-3 Program Structure........................5-3... - Page 80 RGA Windows Software Sensitivity Factors ........................5-13 Spectrum Analysis........................5-13 Background Data ........................5-13 RGA Head and Scan Parameters......................5-14 Changing Scanning Parameters ..................... 5-14 Changing Head Parameters ..................... 5-14 Changing Scan Trigger Rates ....................5-15 Display Modes ............................5-16 Changing Display Modes ......................
-
Page 81: Overview
Overview Overview Program Structure The RGA program is a fully interactive Windows program capable of managing several RGA Heads simultaneously. Fully interactive means that you can double-click on any graph object and the program responds by executing a specific command such as editing the color of a data line. -
Page 82: Rga Ascii Data Files (.Asc)
Overview RGA ASCII Data files (.txt) The RGA program can save the last scan data in an ASCII format that is easily read by spreadsheet programs for data analysis. The file header contains the scan setup information followed by the scan data. The RGA program does not read these ASCII file, it only writes them. -
Page 83: Getting Started
Getting Started Getting Started The following sections describe how to launch the RGA program and start acquiring data from the RGA Head. Note: For detailed information and command description of the RGA program please refer to the RGA On-Line Help files provided with the program disks. The RGA help system includes current and detailed description of all the features, procedures and commands available in the program. - Page 84 Getting Started 1. Stop the scan if there is one in progress using the Stop Now command in the Scan menu or click the shortcut button (the STOP sign button). 2. Turn off the filament by deselecting the Filament On command in the Head menu or click the shortcut button (the filament figure button).
-
Page 85: Features And Operation
Features and Operation Features and Operation Note: For detailed information and command description of the RGA program please refer to the RGA On-Line Help files provided with the program disks. The RGA help system includes a detailed description of all the features, procedures and commands available in the program. The RGA Window The RGA window represents one SRS RGA Head operating in a specific display and scan mode. -
Page 86: Histogram (Mode Menu)
Features and Operation time to acquire each partial pressure depends on the scan speed selected (the plotting speed depends on the user's computer). Histogram (Mode Menu Histogram mode displays the individual mass amplitudes for the selected scan range. In this mode the RGA head performs a peak-lock for each mass and calculates one amplitude per mass. -
Page 87: P Vs T (Mode Menu)
Features and Operation The data acquisition method for the table scan will vary depending on the display mode selected: In Table mode or Table mode split with P vs T mode, each table entry value (partial pressure) is acquired directly from the RGA head by individually querying the partial pressure for the appropriate mass. -
Page 88: Leak Test (Mode Menu)
5-10 Features and Operation individual mass query is performed. If a P vs T mass lies outside the Analog or Histogram mass range, its partial pressure will show a zero value. A table entry can be easily disabled using the Table Parameters dialog box. Leak Test (Mode Menu Leak Test mode provides the most effective way to study the behavior of a single gas. -
Page 89: Library (Mode Menu)
Features and Operation 5-11 alarm parameters, and graph trace colors. In Annunciator mode each channel value (partial pressure) is acquired directly from the RGA head by individually querying the partial pressure for the appropriate mass. This is done for all the selected masses using the present scan schedule as a trigger. Library (Mode Menu Library mode displays the selected library gas fragment patterns in a histogram graph. -
Page 90: Graph Management
5-12 Features and Operation Scan logging continuously saves scan data along with the time and date, with only the essential information about each scan. The user can easily browse through the scans after the scan logging is complete using the Next Item and Previous Item commands from the View menu or the arrow buttons in the Tool Bar. -
Page 91: Sensitivity Factors
Features and Operation 5-13 Saving RGA files does not save any of the head parameters to that file since each RGA Head has unique parameters due to minor variations in electronic and physical properties. Head parameters cannot be changed unless an SRS RGA Head is connected and turned on. -
Page 92: Rga Head And Scan Parameters
5-14 RGA Head and Scan Parameters RGA Head and Scan Parameters The following topics describe how a user might change any of the RGA Head or scan parameters. For specific command information please use the On-Line Help for the RGA Program. Note: For detailed information and command description of the RGA program please refer to the RGA On-Line Help files provided with the program disks. -
Page 93: Changing Scan Trigger Rates
RGA Head and Scan Parameters 5-15 If the operation is not canceled, the new parameters are stored in the Head and are used in subsequent operations. Changing Scan Trigger Rates The scan trigger rate (schedule) determines the frequency with which a scan is repeated. Not all display modes have the same schedule options. -
Page 94: Display Modes
5-16 Display Modes Display Modes Note: For detailed information and command description of the RGA program please refer to the RGA On-Line Help files provided with the program disks. The RGA help system includes detailed description of all the features, procedures and commands available in the program. Changing Display Modes A display mode presents the user with a specific way to analyze the RGA data acquired. -
Page 95: Using Scan Data As Background
Display Modes 5-17 1. Select the any axis by double-clicking on it or selecting X- or Y-Axis form the Graph menu. 2. Enter the new desired limits for the axis in the From and To parameters. 3. Select OK. Using Scan Data as Background This mode is helpful in providing the user with a clean baseline after the background data gets subtracted from newly acquired scans. -
Page 96: General Utilities
5-18 General Utilities General Utilities Note: For detailed information and command description of the RGA program please refer to the RGA On-Line Help files provided with the program disks. The RGA help system includes a detailed description of all the features, procedures and commands available in the program. Using the Data Cursors Cursor command The cursor command is enabled in Analog, Histogram and P vs. -
Page 97: Browsing Through The Gas Library
General Utilities 5-19 To view analog or histogram or table scans stored on disk do the following: 1. Select the Open Scan Logs from the File menu or double-click a file or drag in a file to the RGA program window. 2. -
Page 98: Analyzing The Mass Spectrum
5-20 General Utilities Analyzing the Mass Spectrum Spectrum Analysis description This utility provides the user with immediate analysis of residual gas based on a complete histogram or analog scan. Using a matrix inversion technique, the composition of the residual gas is analyzed and the best approximation to its composition is given in either pressure units or percentages. -
Page 99: Pressure Reduction
General Utilities 5-21 4. Enable averaging with the function button. The button should be pressed. 5. Start the scan if it is not running. Pressure Reduction If you purchased a pressure reduction system from SRS this feature allows you to display true pressure values using the pressure reduction factor that corresponds to your system. -
Page 100: Head Calibration And Security
Head Calibration and Security 5-22 Head Calibration and Security Note: For detailed information and command description of the RGA program please refer to the RGA On-Line Help files provided with the program disks. The RGA help system includes current and detailed description of all the features, procedures and commands available in the program. -
Page 101: Peak Tuning The Rga Head
Head Calibration and Security 5-23 To change the CEM Gain do the following: 1. Connect to an RGA Head with a CEM option (Utilities menu). 2. Select the CEM Settings command form the Head menu. 3. Enter the desired gain in the Gain edit box. 4. -
Page 102: Securing The Rga Head
5-24 Head Calibration and Security 4. Repeat step 3 for the High Mass Peak Position 5. Iterate between steps 3 and 4 as needed 6. Enter a Width Adjust value for the Low Mass Peak (if needed ) and press scan (The full width of the mass peak at 10% of its maximum should be less than or equal to 1 amu). -
Page 103: Rga On-Line Help
5-25 RGA On-line Help The RGA Help system contains detailed information on the operation of the program that is not contained in this manual. Use the On-Line Help to get up to date detailed information on the RGA Windows program. The following sections describe the different ways to use the RGA Help system. Context Sensitive Help Context Sensitive Help provides a quick and direct way to display information on a specific topic. -
Page 105: Chapter 6 Programming The Rga Head
Chapter 6 Programming the RGA Head This chapter describes how to program the RGA Head from a host computer using the RGA Command Set and an RS232 Link. In This Chapter Introduction ............................. 6-4 The RGA COM Utility ..........................6-4 Intoduction .......................... - Page 106 Programming the RGA Head RGA Command Set ..........................6-29 Initialization Commands ......................6-30 ID?............................6-30 IN0, IN1, IN2 .........................6-30 Ionizer Control Commands ......................6-32 DGparam, param: 0 - 20,*.....................6-32 EEparam, param: 25 - 105, *, ?.....................6-33 FLparam, param: 0.00 - 3.50, *, ? ..................6-34 IEparam, param: 0,1, *, ? ......................6-36 VFparam, param: 0 - 150, *, ?....................6-36 Detection Control Commands ....................6-38...
- Page 107 Programming the RGA Head Error Byte Definitions........................... 6-69 SRS Residual Gas Analyzer...
-
Page 108: Introduction
The RGA Com Utility Introduction The RGA comes standard with an RS232 communications port. A host computer interfaced to the RGA can easily configure, calibrate, diagnose and operate the quadrupole mass spectrometer using ASCII commands. The RGA head executes the commands in the order received and, when information is requested, data is quickly returned to the computer for analysis and display. -
Page 109: The Rga Com Utility
The RGA Com Utility When you first connect to the head (step 4 above), send the ID? command to verify the connection with the RGA Head. This command will return the Model number, Serial number , and firmware version of the RGA Unit you are connected to. Important If you make typing error the RGA’’s Error LED will blink. -
Page 110: Rs232 Interface
RS232 Interface RS232 Interface The RS232 interface connector of the RGA is a standard 9 pin, type D, female connector configured as a DCE (transmit on pin 3, receive on pin 2) with full RTS/CTS handshaking enabled. The CTS signal (pin 8) is an output indicating that the RGA is ready, while the RTS signal (pin 7) is an input that is used by the host computer to control the RGA’’s data transmission. -
Page 111: Command Syntax
Command Syntax Command Syntax The RGA commands are ASCII character strings consisting of a two letter (case insensitive) command name, a parameter, and a carriage return terminator. Note: The carriage return character, decimal ASCII value=13, is represented throughout this manual with the symbol <CR>. All command strings must be terminated with this character in order to be acknowledged by the RGA. -
Page 112: Programming Tips
Command Syntax RGA Identification Query. Set initial scan mass to 1 amu. MF100 Set final scan mass to 100 amu. FL1.0 Turn on the filament to a 1.0 mA emission current. Use default noise floor setting. (sets scan rate and averaging.) Query the number of scan points to be received by the computer. -
Page 113: Communication Errors
Communication Errors Communication Errors Communication errors are signaled to the user flashing the Error LED a few times, setting Bit 0 of the STATUS error byte and setting the error-specific bits of the RS232_ERR error byte . Many different circumstances can result in a communication error being reported after a command string is received by the RGA. - Page 114 6-10 Communication Errors jumper setting provides very solid protection against inadvertently tampering with important calibration parameters stored in the RGA’’s memory. Please refer to the ““RGA Command Set”” list to find out which calibration commands are jumper protected. SRS Residual Gas Analyzer...
-
Page 115: Troubleshooting The Rga Communications
Troubleshooting the RGA communications 6-11 Troubleshooting the RGA communications The RGA’’s communication interface includes a complete set of tools for troubleshooting communications between a host computer and the spectrometer’’s head during programming: 1. Visual Clue The first clue of a communication error can be obtained watching the Error LED while communicating with the head. -
Page 116: Programming The Rga Head
6-12 Programming the RGA Head Programming the RGA Head This section describes the basic programming steps needed to configure, operate, and diagnose the RGA. The emphasis is on general program implementation without going into specific details on the different commands that are mentioned. Please consult the ““RGA Command Set””... -
Page 117: Programming The Ionizer
Programming the RGA Head 6-13 Programming the Ionizer Positive ions are produced in the ionizer by bombarding residual gas molecules with electrons derived from a heated filament. The operational parameters that affect the efficiency of the ionizer are: electron energy, ion energy, electron emission current, and focusing voltage. -
Page 118: Programming The Detector
6-14 Programming the RGA Head Programming the Detector Positive ions that successfully pass through the quadrupole filter are focused towards a detector that measures the ion currents directly (Faraday Cup, FC) or, using an optional electron multiplier (CDEM), measures an ion signal proportional to the ion current. Use the Detection Control commands to choose the detector type (FC or CDEM), query the CDEM option, recalibrate the electrometer’’s I-V response and set the electrometer’’s averaging and bandwidth. - Page 119 Programming the RGA Head 6-15 memory. However, all offset correction factors are cleared after a recalibration (CL) of the electrometer is performed, and when the unit is turned off. Please consult the RGA Command Set section for details on the CA command. Detector Programming example The following list of commands starts by checking the RGA head to make sure there is a multiplier installed: A CDEM is present if a 1<LF><CR>...
-
Page 120: Setting Up Analog Scans
6-16 Programming the RGA Head The scan rates and signal-to-noise ratios for the different NF settings of the electrometer are listed in a table in the Electrometer section of the ““RGA Electronics Control Unit”” chapter. When using the RGA Windows program to operate the RGA, the Scan Speed parameter setting available in the Scan Parameter Setups of the Scan menu is used to set the NF parameter value in the RGA Head according to the equation: NF = ScanSpeed - 1. - Page 121 Programming the RGA Head 6-17 Important: The detector’’s zero and the internal scan parameters are checked and corrected at the beginning of each scan resulting in a slight delay before the scan actually starts. The measurements are performed with the detector that is active at the time the scan is triggered.
-
Page 122: Setting Up Histogram Scans
6-18 Programming the RGA Head Before a new scan starts the RGA checks its internal memory to make sure that no data from any previous scan is pending to be transmitted. If data is still pending, the RGA must finish transmitting it before the new scan can start. This process may result in a delay from the time the scan trigger is received to the time it actually starts. - Page 123 Programming the RGA Head 6-19 A Total Pressure measurement is performed at the end of each scan and transmitted out to the host computer. In the event where the CDEM is turned on, the total pressure returned from the head is 0.00. (Please see AP and TP Commands). Setting up a histogram scan The following list of commands sets a scanning range of 1 to 50 amu and the slowest scan rate, and, after checking the number of currents to be measured per scan (not...
-
Page 124: Single Mass Measurements
6-20 Programming the RGA Head process may result in a delay from the time the scan trigger is received to the time it actually starts. Using the HS1 command and waiting until the whole scan data stream is transmitted back to the host computer will minimize the problems that are associated to this feature. - Page 125 Programming the RGA Head 6-21 electrometer, the noise floor is set to the maximum averaging (best signal-to-noise ratio and longest measurement time), the zero of the detector is readjusted, and the measurement is triggered. The single current value returned by this command is the maximum current in the 28 +/-0.3 amu region of the mass spectrum, and must be corrected with a sensitivity factor to obtain the actual partial pressure reading at mass 28.
-
Page 126: Total Pressure Measurements
6-22 Programming the RGA Head The RF/DC voltages are not turned off at the end of a measurement. Use the MR0 command at the end of a set of measurements and before quitting a program to make sure the RF/DC voltages are deactivated completely. Total Pressure Measurements The RGA might be thought of as a Total Pressure Ionization gauge with a mass analyzer interposed between the ionizer and the detector. -
Page 127: Storing Information In The Rga Head
Programming the RGA Head 6-23 Total Pressure measurement programming tips Use the TP query command to check the total pressure with the FC prior to turning on the CDEM. Do not turn on the CDEM if the pressure is too high! See the CDEM Handling and Care recommendations, in the RGA Maintenance chapter, for details. -
Page 128: Programming The Quadrupole Mass Filter
6-24 Programming the RGA Head MV and MG are only available in units with the CDEM option (Option 01) installed (See MO command for details) and usually store a calibrated pair of [gain, high voltage] values for the CDEM. Programming example The following list shows a typical application of the storage commands to save head specific information in the RGA Head. -
Page 129: Error Checking The Rga
Programming the RGA Head 6-25 QMF Programming tips Take advantage of the stabilization feature of the ML command whenever possible. For example: Do not send any new commands to the RGA Head once the QMF has been set to the specified mass value, or otherwise recall the ML command, whenever practical, to refresh the QMF RF/DC settings. - Page 130 6-26 Programming the RGA Head Important: The RGA is free of detected errors as long as the STATUS byte is clear (no bits set). Each bit of the STATUS byte reflects the result of a different type of internal check. Each internal check involves several different tests on a component of the RGA (See the RGA Troubleshooting Chapter for details).
- Page 131 Programming the RGA Head 6-27 LED is turned off and the Error LED is turned on. The problem is immediately diagnosed visually as a failure in the 24V External P/S check. A multimeter could be used to check the output of the external power supply and determine the nature of the problem; however, the computer could also be used to diagnose the problem using the query commands: The ER query command returns a STATUS Byte with bit 6 set indicating a 24V P/S...
- Page 132 6-28 Programming the RGA Head RGA and the ID string is never returned (i.e. receive timeout). The STATUS byte returned by the ER command has the bit 0 set as expected for a communications problem. The specific communications problem is diagnosed using the EC? command. Bit 0 of RS232_ERR is found set indicating that a bad command is being detected by the RGA.
-
Page 133: Rga Command Set
The maximum mass number recognized by the RGA is model dependent and is represented by M_MAX: 100 for the RGA100, 200 for the RGA200, and 300 for the RGA300. -
Page 134: Initialization Commands
The RGA returns the ID string (ASCII format): SRSRGA###VER#.##SN#####<LF><CR> The three string parameters, in the exact format shown above, correspond to: 1. Model number (=M_MAX): 100 for RGA100, 200 for RGA200 and 300 for the RGA300. 2. Firmware version ( for example: 0.23). - Page 135 Initialization Commands 6-31 Command excecution times vary depending on the pre-existing ionizer conditions. The end of the command excecution is prompted to the host computer returning the STATUS byte over RS232. Parameters: IN0: Initialize communications and check the ECU hardware. The input and output data buffers are emptied (all communications are disabled while this happens).
-
Page 136: Ionizer Control Commands
6-32 Ionizer Control Commands Ionizer Control Commands DGparam, param: 0 - 20,* Description: Ionizer Degas command Echo: STATUS error byte (unless command is stopped before completion, or param=0). DEGAS the ionizer by heating and electron stimulated desorption. The parameter represents the desired DEGAS time in minutes and includes a one minute initial ramping time. -
Page 137: Eeparam, Param: 25 - 105
Ionizer Control Commands 6-33 If a filament check fails at any time the following steps are taken automatically: filament is turned off, Degas_LED is turned off, jump to step 12). 8. At the end of the time specified by the parameter (and if no problems were encountered) the Degas_LED is turned off. -
Page 138: Flparam, Param: 0.00 - 3.50, *, ?
6-34 Ionizer Control Commands the filament is off, the new electron energy setting is stored in memory for the next time the filament’’s emission is activated Command excecution times vary depending on the pre-existing ionizer conditions. The end of the command excecution is prompted to the host computer by sending out the STATUS byte over RS232. - Page 139 Ionizer Control Commands 6-35 A firmware-driven ““Filament Protection Mode”” monitors the performance of the filament while it is emitting electrons and if a problem is detected at any time, the heater is immediately shut down and the problem is reported through the error bytes and the error LED’’s (see below).
-
Page 140: Ieparam, Param: 0,1
6-36 Ionizer Control Commands it has been set, FIL_ERR can only be cleared after succesfully turning on the filament. IEparam, param: 0,1, *, ? Description: Ion Energy (eV). Echo: STATUS error byte or query response. Set the Ion Energy to one of two possible levels: Low (8eV) or High(12eV). The parameter represents the ion energy level: 0 for Low and 1 for High. - Page 141 Ionizer Control Commands 6-37 Careful adjustment of the voltage results in optimum coupling of the ion beam into the QMF and maximum sensitivity. If the filament is emitting electrons at the time the command is invoked, the focus voltage is immediately reprogrammed, while the ion energy, electron energy and electron emission currents remain unaffected.
-
Page 142: Detection Control Commands
6-38 Detection Control Commands Detection Control Commands Description: Calibrate All. Echo: STATUS Error Byte. Readjust the zero of the ion detector under the present detector settings, and correct the internal scan parameters against small temperature fluctuations to assure that the correct RF voltages (i.e. as specified by the last Peak Tuning procedure) are programmed on the QMF rods as a funtion of mass. - Page 143 Detection Control Commands 6-39 Notes: This mass axis correction procedure can also be triggered at any time, by itself, using the RS and RI commands with no parameters (See Tuning commands). The correction procedure is also automatically performed at the beginning of all analog and histogram scans.
-
Page 144: Hvparam, Param: 0 - 2490
6-40 Detection Control Commands All offset correction factors previously stored in memory are cleared after a complete calibration of the electrometer is performed (see CA command for more information). Parameters: Only one possible command format is allowed Error Checking: An attempt to pass any parameter with CL results in a bad-parameter error being reported. - Page 145 Detection Control Commands 6-41 It is good practice to readjust the Zero of the ion detector every time the type of detector (FC or CDEM) is changed. This is particularly important if the new detector settings have not been used in a long time or since the unit was turned on or recalibrated with the CL command.
-
Page 146: Nfparam, Param: 0 - 7
6-42 Detection Control Commands Error Checking: The CDEM option (Option 01) must be available in the RGA head receiving the command or a bad-command error is reported (see MO command for details). Number parameters must be within the accepted range, and must be integers. No parameter (i. - Page 147 Detection Control Commands 6-43 measurement and scanning times due to the reduced bandwidth of the electrometer and increased averaging. The NF parameter must be chosen keeping in mind the strong interplay between detection limit and acquisition speed. Histogram scans, analog scans, single-mass measurements and total pressure measurements all share the same value of NF setting during measurements.
-
Page 148: Scan And Measurement Commands
6-44 Scan and Measurement Commands Scan and Measurement Commands Description: Analog Scan Points Query. Echo: Query Response. Query the total number of ion currents that will be measured and transmitted during an analog scan under the current scan conditions. Important: The query response does not include the extra current (4 bytes) corresponding to the total pressure measurement performed at the end of all analog scans (Please see SC command for details). -
Page 149: Hsparam, Param:0 - 255
Scan and Measurement Commands 6-45 The number of points (ion currents) retuned over RS232 is calculated based on the MI and MF parameter values. Number of points = MF - MI + 1. Each point transmitted represents an ion current and as such corresponds to 4 bytes being received by the host computer. - Page 150 6-46 Scan and Measurement Commands A Total Pressure measurement is performed at the end of each scan and transmitted out to the host computer (Please see HP and TP Commands). The measurements are performed with the detector that is active at the time the scan is triggered.
-
Page 151: Mfparam, Param: 1 - M_Max
The upper mass limit depends on the RGA model number: The upper mass limit depends on the SRS RGA model number: M_MAX=100 for RGA100, 200 for RGA200 and 300 for the RGA300 units. MF*: The final mass value is set to its default value. -
Page 152: Mrparam, Param:0 - M_Max
MIparam, param: 1-M_MAX: The parameter represents the initial scan mass in amu units. The upper mass limit depends on the SRS RGA model number: M_MAX=100 for RGA100, 200 for RGA200 and 300 for the RGA300. MI*: The initial mass value is set to its default value. Default value: 1. - Page 153 RS232. The upper mass limit depends on the SRS RGA model number: M_MAX=100 for RGA100, 200 for RGA200 and 300 for the RGA300. Error Checking: The command does not accept query or default parameters.
-
Page 154: Saparam, Param: 10 - 25
6-50 Scan and Measurement Commands mass measurements in a set with the same type of detector and at the same noise floor (NF) setting. Fixed detector settings eliminate settling time problems in the electrometer and in the CDEM’’s HV power supply. It is good practice to perform an analog scan before triggering a long set of measurements to assure the correct tuning (i.e. -
Page 155: Sc[Param], Param: 0 - 255
Scan and Measurement Commands 6-51 SC[param], param: 0 - 255, * Description: Analog Scan Trigger. Echo: Ion Currents Excecute one or multiple analog scans under the present scan conditions. The scan parameter can be set for single, multiple and continuous scanning operation. -
Page 156: Tp?, Tp0, Tp1
6-52 Scan and Measurement Commands is halted and the transmit buffer is flushed (all remaining data is lost). The stopping command is executed after the scan is stopped. SC0: Commonly used to interrupt continuous scanning mode. SCparam, param: 1 - 255: Multiple scans.The number of scans specified by the parameter is executed. - Page 157 Scan and Measurement Commands 6-53 Perform a Total Pressure measurement or toggle the TP_Flag on/off. Total pressure measurements are automatically requested at the end of each analog and histogram scan, and can also be triggered directly by the user with the TP? command.
- Page 158 6-54 Scan and Measurement Commands TP?: Total Pressure query. A total pressure measurement is triggered and a total ion current value is returned over RS232. The actual response to the command depends on the status of TP_Flag as described above. Error Checking: The absence of a parameter is considered an error.
-
Page 159: Parameter Storage Commands
Parameter Storage Commands 6-55 Parameter Storage Commands MGparam, param: 0.0000 - 2000.0000,? Description: Electron Multiplier Gain Storage. Echo: Query Response. Store a value of electron multiplier (CDEM) Gain, expressed in units of thousands, in the non-volatile memory of the RGA head. The command is typically used together with the MV instruction to store calibrated sets of [High Voltage and gain] for the Electron Multiplier. -
Page 160: Spparam, Param:0.0000 - 10.0000
6-56 Parameter Storage Commands Parameters: MVparam, param: 0-2490: The parameter, interpreted as a CDEM bias voltage in units of Volts, is stored in the non-volatile memory of the head. MV?: CDEM Bias voltage query. Error checking: The absence of a parameter (i. e. MV) is treated as an error. No default value is available. - Page 161 Parameter Storage Commands 6-57 Important: The sensitivity factor is not used internally by the RGA to turn ion currents into total pressures, it is simply stored so it can be read and used by any host computer connected to the instrument. Total Pressure Sensitivity factors are gas specific, probe specific, and highly dependent on the ionizer conditions and on aging of the probe.
-
Page 162: Mass Filter Control Commands
QMF in amu units. The minimum mass increment value is 1/256 amu. The upper mass limit depends on the RGA model number: M_MAX=100 for RGA100, 200 for RGA200 and 300 for RGA300. Error checking: Parameters must be numbers within the specified range. -
Page 163: Error Reporting Commands
Error Reporting Commands 6-59 Error Reporting Commands Description: RS232_ERR Byte Query Echo: RS232_ERR Byte. Query the value of the RS232_ERR byte. The value of the RS232_ERR byte is sent to the computer in ASCII format and with a <LF><CR> terminator. RS232_ERR and bit 0 of STATUS are then cleared to provide a clean error reporting slate. - Page 164 6-60 Error Reporting Commands Error checking: The only acceptable parameter is a question mark. The absence of a parameter (i. e. ED) is treated as a bad-parameter error. Description: FIL_ERR Byte Query Echo: FIL_ERR Byte. Query the value of FIL_ERR. The FIL_ERR byte value is returned to the computer in ASCII format and with a <LF>...
- Page 165 Error Reporting Commands 6-61 Parameters: This command is a query, and can only have one parameter format: Error checking: The only acceptable parameter is a question mark. The absence of a parameter (i. e. EM) is treated as a bad-parameter error. Description: PS_ERR Byte Query.
- Page 166 6-62 Error Reporting Commands Always try the query a second time before declaring a hardware problem. Parameters: This command is a query, and can only have one parameter format: Error checking: The only acceptable parameter is a question mark. The absence of a parameter (i. e. EQ) is treated as a bad-parameter error. Description: STATUS Byte Query.
-
Page 167: Tuning Commands
Tuning Commands 6-63 Tuning Commands Description: Calibration Enable Query. Echo: JP100 setting. Query the Calibration Enable/Disable jumper (JP100) status. An internal jumper (JP100) on the digital (i.e. top) electronics board of the RGA’’s ECU box can be configured by the end-user to enable/disable the modification of the peak tuning parameters. -
Page 168: Dsparam, Param: -0.8500 - +0.8500
Important: RGA200 DS range: -1.2750 - +1.2750 RGA100 DS range: -2.5500 - +2.5500 Program the value of DS during the Peak Width Tuning Procedure. The parameter (one of four peak tuning parameters) represents the DS value, in units of bits/amu. -
Page 169: Riparam, Param: -86.0000 - +86.0000, *, ?, None
(See CE Command) the value of DS in non-volatile memory is updated and the internal scan parameters used to program the DC during scans and single mass measurements are updated accordingly. RGA100 DS range: -2.5500 - +2.5500 DS*: Use this format to replace the peak tuning parameter with the original factory setting for DS. - Page 170 6-66 Tuning Commands Warning: Please read the Peak Tuning Section of the RGA Tuning Chapter before using this command. Program the output of the RF_Driver @ 0 amu during a Peak Posion Tuning Procedure. The parameter (one of four peak tuning parameters) represents the voltage output selected for the RF_Driver @ 0 amu, in mV.
-
Page 171: Rsparam, Param: 600.0000 - 1600.0000, *, ?, None
Tuning Commands 6-67 This parameter is protected by an internal calibration jumper (JP100) and a Protection- violation error will result if the jumper is in the Calibration Disabled mode (see CE command). RSparam, param: 600.0000 - 1600.0000, *, ?, none Description: RF_Driver output @ 128 amu (Peak Position Tuning command). - Page 172 6-68 Tuning Commands RS: Uses the current parameter value to recalculate the internal scan parameters used to step the RF during scans and single mass measurements. This is often used to compensate against small temperature drifts in the mass scale, caused by drifts in the output of the RF_Driver.
-
Page 173: Error Byte Definitions
Error Byte Definitions 6-69 Error Byte Definitions The Error Bytes described in this section store the results of the firmware-driven checks built into the RGA Head. Use the Error Reporting commands to query the value of the bytes. Important: No errors are present as long as all bits in the Error Bytes are cleared. The RGA Windows software supports all the Error Reporting commands and reports the errors detected based on their Error Codes. - Page 174 6-70 Error Byte Definitions Description Error Code External 24V P/S error: Voltage >26V. External 24V P/S error: Voltage <22V. Not used Not Used Not Used Not Used Not Used Not Used PS_ERR Error Byte: 24V P/S Error Byte. Description Error Code ADC16 Test failure.
- Page 175 Error Byte Definitions 6-71 Description Error Code RF_CT exceeds (V_EXT- 2V) at M_MAX Primary current exceeds 2.0A Not used Power supply in current limited mode. Not Used Not Used Not Used Not Used QMF_ERR Error Byte: Quadrupole Mass Filter RF P/S Error Byte. Description Error Code No Electron Multiplier Option installed...
- Page 176 6-72 Error Byte Definitions Description Error Code No filament detected. Unable to set the requested emission current. Vacuum Chamber pressure too high. Not used Not used Not used Not used Single filament operation. FIL_ERR Error Byte: Filament Error Byte. Description Not used Parameter conflict Jumper protection violation...
-
Page 177: Chapter 7 Rga Tuning
Chapter 7 RGA Tuning This chapter describes the tuning procedures needed to calibrate the RGA head and assure accurate qualitative and quantitative measurements. WARNING! The Tuning procedures described in this chapter should be performed by qualified personnel only. A mistuned RGA Head could give Erroneous Readings until it is retuned properly. -
Page 178: Introduction
Introduction Introduction Accurate qualitative and quantitative partial pressure measurements can only be assured by proper tuning of the RGA Head. Correct calibration of the mass scale is essential during qualitative analysis for the correct assignment of mass numbers to the different peaks. The mass resolution of the quadrupole mass filter, m , must be kept at or under 1 amu to avoid severe overlap between adjacent peaks. -
Page 179: Tuning Options
Tuning Options Tuning Options The different tuning procedures, including the corresponding RGA Windows commands, are listed in the following table: Tuning Procedure RGA Windows Cmd. Options Peak Tuning Peak Tuning Peak Position Peak Width Sensitivity Tuning Sensitivity Tuning Partial Pressure Total Pressure Electron Multiplier Channel Electron... -
Page 180: Peak Tuning Procedure
Peak Tuning Procedure Peak Tuning Procedure Introduction When analyzing a sample, you expect the peaks of the different gases to be displayed at their correct mass-to-charge ratio values and the peak widths to be less or equal than 1 amu at 10% of peak height. The correct location of the peaks is essential for accurate qualitative analysis, and unity resolution ( m =1 amu) minimizes the overlap between adjacent peaks. -
Page 181: General Procedure
Peak Tuning Procedure On-line Help Files included with the program for details. Note to Supervisors: A calibration disable jumper (JP100) can be configured to block any attempt to change the value of the mass filter settings in the RGA Head. The jumper is located on the top electronics board of the ECU box, next to the microprocessor chip (i.e. -
Page 182: Peak Position Tuning Algorithms
Peak Tuning Procedure their known mass-to-charge ratio (This is needed to make sure the Peak-locking algorithm used for single mass measurements always finds the mass peak within its search window). The peak width, m , must be a constant, and less than 1 amu throughout the whole scan range. - Page 183 Peak Tuning Procedure Please consult the Tuning Commands List in the RGA Programming chapter of this manual for details on the RS and RI commands. As described above, the peak position tuning procedure requires the introduction of two known gases into the vacuum system. A low mass gas (1-20 amu recommended) is used to adjust the low mass end of the mass axis, a high mass gas, with a mass-to-charge ratio close to the upper limit of the scanning range of the RGA, is used to adjust the high mass end of the mass scale.
-
Page 184: Peak Width Tuning Algorithms
Peak Tuning Procedure Iterations: In most cases it will be necessary to repeat the two position adjustments one or two more times until both low and high mass peaks show up at their known positions. Peak Width Tuning Algorithms: Constant absolute resolution ( m ) in a quadrupole mass filter requires DC voltages linearly related to the mass, with a slight negative offset at low masses (i.e. -
Page 185: Temperature Effects On The Mass Scale Calibration
Peak Tuning Procedure DI = DI m * 28 Notes: The new DI value must fall within the acceptable parameter range of the DI command. A change in DI affects the width of all the peaks in the spectrum. A decrease in DI results in broader peaks at a rate of 0.036 amu per bit removed. High Mass Peak Width Adjustment: To modify the high mass peak width by an amount m amus, modify the value of DS from its original value DS DS = DS... - Page 186 7-10 Peak Tuning Procedure For large temperature changes: The sensitivity of the RF power supply to its controlling voltages might be affected or, more fundamentally, the relationship between mass and RF levels in the filter might change ( for example, if the QMF changes its physical dimensions).
-
Page 187: Sensitivity Tuning Procedure
Sensitivity Tuning Procedure 7-11 Sensitivity Tuning Procedure All quantitative calculations performed with the SRS RGA rely on the assumption that there is a linear relation between the partial pressure and the corresponding RGA signals of the gases. Each gas ionizes differently, and its ions make it through the mass filter with different efficiencies. - Page 188 7-12 Sensitivity Tuning Procedure 6. Run a few analog or histogram scans on the sample gas to assure the purity and levels of the calibration gas. 7. Measure the output signal from the RGA for the principal mass peak of the calibration gas (i.e.
- Page 189 Sensitivity Tuning Procedure 7-13 The sensitivity factors used by SRS RGA are all for Faraday Cup detection. A separate Electron Multiplier Gain Factor, stored in the non-volatile memory of the RGA Head, is used by the RGA Windows program to correct the ion signals when the electron multiplier is turned on (i.e.
-
Page 190: Electron Multiplier Tuning Procedure
7-14 Electron Multiplier Tuning Procedure Electron Multiplier Tuning Procedure Accurate quantitative measurements with the electron multiplier detector require the determination of the CDEM gain for all the ion peaks being measured. Frequent recalibrations are recommended to correct against aging of the device. The gain of the electron multiplier (CDEM) in the SRS RGA is defined relative to the Faraday Cup output (which is assumed to be mass independent). -
Page 191: Chapter 8 Rga Maintenance
Chapter 8 RGA Maintenance This chapter describes how to maintain the components of the quadrupole probe. The ECU does not have any serviceable parts and should not require any routine maintenance. In This Chapter Warnings! ..............................8-3 Probe Bakeout............................8-5 Procedure ............................ - Page 192 Equipment..........................8-18 Procedure...........................8-18 Quadrupole filter cleaning........................8-21 Equipment..........................8-21 Procedure...........................8-22 SRS Probe Refurbishing Service......................8-25 SRS Residual Gas Analyzer...
-
Page 193: Warnings
Warnings Warnings! The service information in this chapter is for the use of Qualified Service Personnel. To avoid shock, do not perform any procedures in this chapter unless you are qualified to do so. Read and follow all ““Safety and Precaution”” warnings before servicing the product. - Page 194 Warnings Stanford Research Systems does not guarantee that the cleaning procedures described in this chapter will completely remove contamination from the probe. In some cases (i.e. depending on the vacuum composition) replacement of the parts might be the only solution to a contamination problem.
-
Page 195: Probe Bakeout
Probe Bakeout Probe Bakeout Bakeout of the RGA probe is recommended in the following cases: 1. After installation of the probe in the vacuum chamber. 2. After prolonged exposure of the probe assembly to open air. 2. When background contamination is present in the mass spectra. 3. -
Page 196: Procedure
Probe Bakeout Procedure 1. The quadrupole probe must be mounted on the vacuum system and at a base pressure under 10 Torr. 2. Turn off the RGA and disconnect the ECU from the probe. 3. Wrap a heating tape or heating jacket around the entire probe and cover with fiberglass insulation if necessary. -
Page 197: Ionizer Degas
Ionizer Degas Ionizer Degas An Ionizer Degas program is built into the RGA head to clean up the filament and the ionizer by Electron Impact Desorption. Degassing provides a fast way to clean up the ion source, however, it compromises the lifetime of the thoria coating of the filaments and it is no substitute for a complete bakeout of the probe. -
Page 198: Ionizer Replacement
Ionizer Replacement Ionizer Replacement As the RGA is used, deposits form on the ionizer parts and the sensitivity of the sensor is degraded. Once the sensitivity of the spectrometer is significantly affected by this buildup it is necessary to completely replace the ionizer. All components of the ionizer should be replaced together at once. - Page 199 Ionizer Replacement Feedthru Flange Vacuum Chamber RGA Cover Nipple Ionizer Vacuum Port Probe Assembly Figure 1 Probe Removal for Ionizer Replacement 6. Carry the probe to a clean, dust free area immediately. Avoid contamination using handling procedures compatible with high vacuum requirements. 7.
- Page 200 8-10 Ionizer Replacement 16. Attach the new repeller to the longer filament rod using a fresh screw. Align the cage and tighten the screw (Correct alignment is best assured when the two small holes on the side of the repeller cage line up with the filament screws.) 17.
-
Page 201: Filament Replacement
Filament Replacement 8-11 Filament Replacement The filament eventually wears out and needs to be replaced. There is no need to send the RGA unit back to the factory for this service. The replacement procedure is simple and can be completed in a few minutes by qualified personnel. The filament is very delicate and should be handled with extreme care. - Page 202 8-12 Filament Replacement RGA Mounting Flange Vacuum Chamber RGA Cover Nipple Vacuum Port Ionizer Probe Assembly Figure 2 Probe Removal for Filament Replacement 6. Immediately carry the probe to a clean, dust-free area and secure it in an upright position. Avoid contamination using handling procedures compatible with high vacuum requirements.
- Page 203 Filament Replacement 8-13 15. Visually inspect the filament alignment and do any adjustments that might be necessary. The filament should form a circle around the anode grid. Slight bends in the filament are common, and do not compromise its performance. Severe bends might result in electrical-shorts to the repeller and anode grid and need to be corrected.
-
Page 204: Cdem Handling And Care
8-14 CDEM Handling and Care CDEM Handling and Care Continuous Dynode Electron Multipliers (CDEM) have a history of high performance and dependability in mass spectrometry applications. By following the simple recommendations described below the user should achieve a long useful lifetime from these detectors. -
Page 205: Storage
CDEM Handling and Care 8-15 multiplier and lead to slow performance degradation (due to reduced secondary emission efficiency). Oil contamination is a serious problem, and can result in catastrophic destruction of the multiplier: use liquid nitrogen traps with diffusion pumps (particularly for slicone oil based pumps) , and molecular sieves traps with mechanical roughing pumps whenever possible. -
Page 206: Cdem Pre-Conditioning
8-16 CDEM Pre-conditioning CDEM Pre-conditioning The following preconditioning procedure is recommended for the first pump-down and initial operation of a new CDEM: 1. Pump overnight prior to initial application of voltage. 2. Begin operation at the lowest voltage possible, working up to the voltage required to produce observable peaks. -
Page 207: Cdem Refreshment
The CDEM should show a gain improvement after the cleaning. Warning Stanford Research Systems does not guarantee that this procedure will remove contamination from a detector. Use this method as a last resort only. Materials Ultrasonic cleaner Isopropyl alcohol, Electronic grade or better. -
Page 208: Cdem Replacement
8-18 CDEM Refreshment CDEM Replacement There is no need to send the RGA unit back to the factory for this service. The replacement procedure is very simple and can be completed in a few minutes by qualified personnel. Gain degradation limits the lifetime of all electron multipliers. Eventually the gain drops to unacceptable values and the multiplier needs to be replaced. - Page 209 CDEM Replacement 8-19 5. Without disconnecting the cover nipple from the vacuum port, remove the six bolts from the feedthru flange at the end of the probe and slide the entire probe assembly out of the vacuum system (Note the rotational orientation of the Feedthru Flange before removing the probe assembly from the vacuum system so that the probe can be reassembled in the exact same way at the end of the replacement procedure.
- Page 210 8-20 CDEM Refreshment CDEM Clip Remove this screw only! Faraday Cup Shield CDEM Anode CDEM CDEM Clamp Figure 4 CDEM Replacement 9. Using the clean flat head screwdriver, remove the small screw that fastens the clamp to the HV rod and rotate the entire multiplier about its axis until the clamp’’s end points away from the FC Shield.
-
Page 211: Quadrupole Filter Cleaning
Quadrupole filter cleaning 8-21 Quadrupole filter cleaning The quadrupole mass filter is the heart of the RGA. The sensitivity and resolution of the instrument are ultimately limited by the quality of the quadrupole field between its rods. Deposits on the rods accumulate electrostatic charge and distort the field, resulting in degraded performance. -
Page 212: Procedure
8-22 Quadrupole filter cleaning Procedure 1. Read all warnings at the beginning of this chapter before attempting to service the probe. 2. Set up in advance a clean dust-free working area where to carry out this procedure. 3. Turn off the RGA and disconnect the ECU from the probe. 4. - Page 213 Quadrupole filter cleaning 8-23 the entire quadrupole assembly from the detector/feedthru assembly. There are no serviceable parts in the flange. Set it apart in a safe, clean area. Next, separate the ionizer from the quadrupole filter by removing the e-clips that hold the 1/8”” diameter rods in place.
- Page 214 8-24 Quadrupole filter cleaning If the RGA probe has a CDEM, mount the multiplier at this time. Adjust the HV connect rod as needed, and tighten all the necessary screws (The threaded hole on the side slot of the rod lines up with the CDEM Clamp hole, and the top groove should be correctly lined up with the edge of the alumina spacer’’s alignment hole.) Install new bowed e-clips in all the grooves located above the alignment holes of the bottom alumina spacer.
-
Page 215: Srs Probe Refurbishing Service
SRS Probe Refurbishing Service 8-25 SRS Probe Refurbishing Service The procedures described in this chapter are designed to guide the user through the various steps needed to maintain and/or repair the different components of the RGA probe. These procedures should only be carried out by qualified personnel who fully understand the critical alignment aspects of the instrument. - Page 216 8-26 Quadrupole filter cleaning SRS Residual Gas Analyzer...
-
Page 217: Chapter 9 Rga Troubleshooting
Chapter 9 RGA Troubleshooting This chapter describes basic troubleshooting procedures for the SRS RGA. In This Chapter Warnings..............................9-2 Internal Error Detection in the SRS RGA ..................... 9-3 Basic Troubleshooting ........................... 9-5 Built-in Hardware Checks ........................9-10 24V DC Power Supply ......................9-10 Electrometer .......................... -
Page 218: Warnings
Warnings Warnings The service information in this chapter is for the use of Qualified Service Personnel. To avoid shock, do not perform any procedures in this chapter unless you are qualified to do so. Read and follow all ““Safety and Precaution”” warnings before servicing the product. -
Page 219: Internal Error Detection In The Srs Rga
Internal Error Detection in the SRS RGA Internal Error Detection in the SRS RGA Several firmware-driven checks automatically test the RGA when the instrument is turned on, and continuously monitor the internal workings of the unit. A ““Background Filament Protection Mode”” is activated, when the filament is turned on to protect the delicate filament (and CDEM) from accidental overpressures. - Page 220 Internal Error Detection in the SRS RGA RGA Programmers: Repeat the query command, if a problem was detected after the last query. Note that the values of the Error Bytes often change after an Error Byte query command is executed. Some query commands update the byte value after performing a fresh test on the hardware, while others clear error bits, after they are read, to provide a clean error-reporting slate.
-
Page 221: Basic Troubleshooting
Basic Troubleshooting Basic Troubleshooting A unique Error Code has been assigned to each one of the fault conditions that can be internally detected by the RGA Head. The Error Codes are used only by the RGA Windows program to report all internally detected errors. This section lists causes and troubleshooting procedures for all the possible Error Code values available in the SRS RGA. - Page 222 Basic Troubleshooting Error Code: DET6 Type of Error: Electrometer Error Message: Electrometer Error: DETECT fails to read +5nA input current. The logarithmic output of the picoammeter is not within the levels expected for a Error Cause: +5 nA input current. Troubleshooting: Contact SRS.
- Page 223 Basic Troubleshooting causing severe overpressures. If the pressure is OK ( i.e. <10 Torr), check for shorts in the ionizer assembly. Using an ohmmeter check the conductance between the ionizer’’s connectors and the vacuum system. (The ionizer feedthrus can be easily identified using the drawings in the RGA Assembly Chapter).
- Page 224 Quadrupole Mass Filter RF P/S. Error Message: RF P/S Error. RF_CT exceeds (V_EXT-2V) at M_MAX. (M_MAX=100 for the RGA100, 200 for RGA200 and 300 for RGA300) Error Cause: The RF P/S goes out of regulation when the quadrupole mass filter is set to M_MAX amu.
- Page 225 Basic Troubleshooting readings at high masses. Troubleshooting: Is the quadrupole probe connected to the ECU box? The ECU’’s RF P/S does not operate properly in the absence of a probe. Is the RGA Cover Nipple in place? The SRS RGA will not operate without the RGA Cover Nipple in place.Consult Hardware Modifications in the RGA Probe chapter of the manual for details.
-
Page 226: Built-In Hardware Checks
9-10 Built-in Hardware Checks Built-in Hardware Checks Several firmware driven hardware checks are built into the RGA Head. Some checks are automatically performed as soon as the unit is powered up (i.e. Power-on checks), and others are activated when the emission from the ionizer is turned on (i.e. filament’’s Background Protection Mode). -
Page 227: Quadrupole Mass Filter Rf P/S
EQ?. The RF amplitude is set at the level corresponding to the maximum mass value for the head (100 amu for RGA100, 200 amu for RGA200 and 300 amu for RGA300) and the following tests are done: The voltage on the primary of the RF transformer is checked to make sure it is at least 2V lower than the DC voltage used to power the instrument. -
Page 228: Filament’'S Background Protection Mode
9-12 Built-in Hardware Checks If a problem is detected in any of these checks Bit 4 of STATUS is set, QMF_ERR is updated, and the Error LED is turned on. Filament’’s Background Protection mode STATUS Bit affected: Error Byte affected: FIL_ERR Error Reporting Command: Error Codes prefix:... -
Page 229: Chapter 10 Rga Circuit Description
10-1 Chapter 10 RGA Circuit Description This chapter describes the electronics circuits located inside the Electronics Control Unit of the RGA. There are no electronics components inside the RGA Probe. The information in this chapter is provided for the use by qualified technical personnel during service and repairs. - Page 230 10-2 A/D Conversion ........................10-8 Power-up Conditioning ......................10-9 Schematic name: QMSE_T3)....................10-9 DC Control Voltages.......................10-9 RF Amplitude Detection ......................10-9 RF Amplitude Control......................10-10 Foldback Current Limiting....................10-10 Schematic name: QMSE_B1....................10-11 Mass filter RF Supply ......................10-11 DC Potentials ........................10-12 Schematic name: QMSE_B2....................10-12 Filament Heater Supply......................10-12 Bias Regulators ........................10-13 Schematic name: QMSE_B3 ....................10-14 Power Supplies........................10-14...
-
Page 231: Overview Of The Rga
Overview of the RGA 10-3 Overview of the RGA The SRS RGA is a mass spectrometer consisting of a quadrupole probe, and an Electronics Control Unit (ECU) which mounts directly on the probe’’s flange. The quadrupole probe is a mass spectrometer sensor consisting of an ion source, a quadrupole mass filter, a Faraday cup and an optional electron multiplier (Option 01). -
Page 232: Circuit Description
10-4 Circuit Description Circuit Description General Description The specifications and features of the many circuits that drive the RGA are determined by characteristics of the quadrupole mass spectrometer such as: the ionizer settings available to the user, the characteristics of the quadrupole mass filter, the magnitude of the ion current levels detected during measurements, an optional electron multiplier. -
Page 233: Circuit Boards
Circuit Description 10-5 Circuit Boards There are two main PCBs inside the ECU package. The top PCB has the CPU, RS232, digital ports, the analog electronics for A/Ds and D/As, and the RF amplitude detection circuit. A small vertical PCB which holds the log I/V converter connects to the top PCB. -
Page 234: Description Of Schematics
10-6 Description of Schematics Description of Schematics Schematic name: QMSE_T1 Microprocessor An MC68HC11E9 microcontroller is used to control the system and to communicate with the host computer. This central processing unit (CPU) also has RAM, ROM, EEPROM, UART, octal 8-bit A/D converter, counter timers, and a multiplexed address/data bus to accommodate an external 32Kx8 RAM. -
Page 235: The Led Port
Description of Schematics 10-7 In addition to the I/O port on the microcontroller, there are three 8-bit digital shift registers which are loaded via the SPI, then strobed by a LD bit to transfer data to the parts’’ output registers. The three digital output ports are assigned as follows: The LED port Set high to light an LED to indicate that the +24V power supply is ““okay””. -
Page 236: Rs232 Interface
10-8 Description of Schematics Since the A/D convert rate is a sub-multiple of all the other system clocks, crosstalk from the clocks will be synchronous, and will generate a fixed offset to the signal (which may be measured and subtracted) instead of noise. The clock division for the 28.8 kBaud rate is done by the microcontroller;... -
Page 237: Power-Up Conditioning
Description of Schematics 10-9 The CPU can measure the offset of the input multiplexer, op-amp, and A/D converter by selecting input X7 (the circuit ground). The measured offset is subtracted from readings taken for the other inputs. A conversion is initiated by -CS_ADC16 going low while R/-C is low. -CS_ADC16 is asserted when the 675 Hz convert clock from the 74HC4020 (U108) goes low provided that CS_VETO (MISC port bit 7) is low. -
Page 238: Rf Amplitude Control
10-10 Description of Schematics summed. The charge pump works as follows: as the potential on the rod reaches a peak, the 0.5 pF capacitor (C750 on the PCB which holds the flange socket) is charged to the maximum voltage, Vp + Vdc - Vdiode with current flowing to ground via D303, a Schottky diode. -
Page 239: Schematic Name: Qmse_B1
Description of Schematics 10-11 Schematic name: QMSE_B1. Mass filter RF Supply The Toroid: The design approach was dominated by the characteristics of the RF transformer. This iron-powder toroid provides a step-up of 39:1 for the RF. The secondaries have a self-inductance of about 16 µH so as to resonate at 2.7648 MHz with the capacitive load presented by the rods in the mass filter together with the parasitic capacitance of the secondaries. -
Page 240: Dc Potentials
10-12 Description of Schematics DC Potentials In addition to the RF, DC potentials of about 1/12th the RF peak-to-peak value is required for the two rod pairs. The op-amp U403A is the error amplifier which maintains the negative potential equal to a fraction of the set RF level. When DC_SET goes up, the output of the op-amp goes up, increasing the current in Q406, increasing the current in Q407, bringing down the collector of Q407, which is the output of the negative potential voltage regulator. -
Page 241: Bias Regulators
Description of Schematics 10-13 2.766VDC.) The emission current may be set to values as high as 50 mA during the de- gas procedure. The primary side current drive may be sensed in the 0.5 FET source resistor. The voltage across this resistor is filtered and amplified by 6X, and may be measured by the CPU. -
Page 242: Schematic Name: Qmse_B3
10-14 Description of Schematics de-gas, the filament emission current is set to 20 mA, which will provide about 8W of power to heat the grid, in addition to 15W of filament heater power. Schematic name: QMSE_B3 Power Supplies The unit is operated from +24VDC, and requires up to 2.0A. (The current draw will be the highest when the unit is scanning at the high end of the mass range, or during de-gas.) The unit is protected against power supply reversal by D610. -
Page 243: Schematic Name: Qmse_V2
Description of Schematics 10-15 the quantization noise of the A/D is smaller than the shot noise of the I/V converter's bias source, and to provide sufficient resolution.) At the core of the detection system is the log I/V converter. A standard arrangement is used, where the current is applied to the inverting input of a very low bias current op-amp (U700) and a diode is used between the output and the inverting input of the op-amp. - Page 244 10-16 Description of Schematics multiplier output is compared to the set level (HV_SET) by an error amplifier (U800A) which controls the voltage on the center tap of the primary via Q800. The primary current in the HV inverter is sensed by R814, a 2.2 resistor. If the primary drive exceeds 230 mA, the output of the difference amplifier U800B will go positive, reducing down the primary drive level.
-
Page 245: Chapter 11 Rga Probe Assembly
11-1 Chapter 11 RGA Probe Assembly This chapter contains two RGA probe assembly drawings. In This Chapter RGA Probe Assembly Schematic......................11-3 Feedthru Flange Connectors Schematic..................... 11-4 O100MAX Maximum Insertion Nipple Drawing................... 11-5 SRS Residual Gas Analyzer... - Page 246 11-2 SRS Residual Gas Analyzer...
- Page 249 Appendix A Appendix A Vacuum Diagnosis with SRS RGA’’s Introduction Residual Gas Analyzer (RGA) is the term for a class of mass spectrometers. They are all quadrupole mass spectrometers and typically cover mass ranges from 1 to 100 or 200 amu (atomic mass units).
- Page 250 Appendix A Composition Analysis The SRS RGA software allows the composition of the vacuum system to be analyzed by two methods. The most common is to measure the mass spectrum of the vacuum. This provides a ““fingerprint”” of the residual gases in the vacuum system. A second method is to track specific species or peaks of the mass spectrum.
- Page 251 Appendix A dioxide shows a peak at 44 and a peaks for CO and C at 22 and 12. The other peaks are caused by fragments of these species and contaminants. The presence of air components in the spectra might lead us to believe that the system is leaking, but this is untrue.
- Page 252 Appendix A Vacuum Diagnosis Torr 1.2x10 1.1x10 9.6x10 8.4x10 7.2x10 6.0x10 4.8x10 3.6x10 2.4x10 1.2x10 Atomic Mass Units Figure 2a: Pump Oil Contamination Mechanical Pump Oil Torr MP OIL 1.0x10 9.0x10 8.0x10 7.0x10 6.0x10 5.0x10 4.0x10 3.0x10 2.0x10 1.0x10 Figure 2b: Library Pump Oil Data SRS Residual Gas Analyzer...
- Page 253 Appendix A The presence of mechanical pump oil is immediately obvious. The peaks at masses 39, 41, 43, 55, and 57 are caused by mechanical pump oil backstreaming into the vacuum chamber during a load lock sequence. The total pressure in the chamber was dominated by water and was less than 2 10 Torr.
- Page 254 Appendix A would have been without the cleaning. The mass spectrum provides a more accurate evaluation of cleaning procedures than pump down time and base pressure. Just because a system pumps down quickly does not guarantee that undesirable contaminants have been eliminated.
- Page 255 Appendix A Single Mass Measurement For vacuum systems that only need to be clean, the mass spectrum is the most useful measurement. During experiments and processes the partial pressure of certain species is of more interest. The RGA software provides three modes that are used to measure selected peaks.
- Page 256 Appendix A Airlock Sequence mBar 1.0x10 Hydrogen Water 1.0x10 Nitrogen Oxygen 1.0x10 Floor 1.0x10 1.0x10 1.0x10 1.0x10 00:00:00 00:00:37 00:01:15 00:01:53 00:02:31 00:03:09 00:03:46 00:04:24 00:05:02 00:05:40 00:06:18 Time (hh:mm:ss) Figure 4: Airlock Sequence To make these measurements, the electron multiplier detector has been used with a gain of 100, which allows all six channels to be recorded every three seconds.
- Page 257 Appendix A At 2:40, the load lock is opened to the main chamber causing a jump in pressure. The rise in oxygen and oil pressure indicates that the procedure is operating poorly. Even though the load lock was purged three times with 99.999% nitrogen, oxygen was still introduced into the chamber.
-
Page 258: Leak Testing
Appendix A RGA Table Scan Name Mass Value Alarm Speed NORMAL Hydrogen 1.00 3.8E-07 HIGH Water 7.1E-08 1.00 Nitrogen HIGH 1.00 1.4E-05 NORMAL Oxygen 1.00 4.6E-10 NORMAL 1.00 3.4E-11 NORMAL 1.6E-12 1.00 Floor NORMAL 1.00 1.5E-13 Figure 5: SRS RGA Table Display Leak Testing In addition to the diagnosis of vacuum systems, the RGA is invaluable as an intrinsic leak detector. - Page 259 Appendix A Chamber Leak Test Helium Torr 1.9E-10 6.0x10 5.4x10 4.8x10 4.2x10 3.6x10 3.0x10 2.4x10 1.8x10 1.2x10 6.0x10 00:00:00 00:00:48 00:01:36 00:02:24 00:03:12 00:04:01 00:04:49 00:05:37 00:06:25 00:07:14 00:08:02 Time (hh:mm:ss) Figure 6: Helium Leak Test Data The partial pressure of the test gas is directly related to the leak rate into the chamber. Assuming that the vacuum pump is not operating near its compression limit, the throughput of the test gas is equal to the product of the partial pressure and the effective speed of the pump at the RGA ionizer (Q = S P).
- Page 260 Appendix A the leak requires a large flowrate and waiting for an extended time for the gas to diffuse into the fitting. Because of the flowrate and time, it is possible that the test gas can travel to adjacent tube fittings and cause a misleading indication of a leak. Often times ““fugitive””...
- Page 261 Appendix A Conclusion An RGA is a real eye opener for users of vacuum systems. With an RGA the process of working with vacuum systems is elevated from an empirical trial and error approach to a systematic approach. The status of the vacuum system can be constantly assessed. When an experiment or process is having problems, the possibility of contamination or leaks in the vacuum system can be immediately ascertained.
- Page 262 Appendix B Appendix B Using SRS RGA’’s to Sample High Pressure Gasses Introduction The types of analysis performed by an RGA are useful in many applications other than vacuum systems. But, the RGA is intrinsically a vacuum instrument that operates best under 10 mbar.
- Page 263 Appendix B Hi-C Valve Process Aperature Hybrid Turbo Pump Sample Valve Diaphragm Pump Figure 1: Schematic of a mid-vacuum pressure reduction system Apertures can be readily designed for process pressures in the range from 10 mbar to 10 mbar. If the process always operates within a small range, the aperture can be optimized to deliver gas to the RGA at about 10 to 10 mbar.
- Page 264 Appendix B background peaks, the operating pressure should be kept as high as possible. The background can be minimized by designing the tubing such that the effective pumping speed at the RGA ionizer is as high as possible. Figure 2 shows two layouts that both have the same ““signal””...
- Page 265 Appendix B Figure 2: Two Layouts of Post-Aperture Vacuum System. The system shown in Figure 1 can be assembled as a simple package. Using a small (70 liter s or less) hybrid turbo pump and a diaphragm backing pump will eliminate any concern of oil.
- Page 266 Appendix B tubing will use the kinetic energy of the sampled gas to mix the dead volume (in a sense keeping the volume alive). Figure 5 shows the response to bursts of gas at the inlet of an atmospheric sampler designed with the above considerations. The sub-second response and cleanup are almost as fast as the RGA can acquire data.
- Page 267 Appendix B Glass capillaries are available with small enough bores to reduce pressure from 1000 mbar to 10 mbar without bypass pumping. While it is possible to build a atmospheric sampling system based on a 1/4 meter 50 m glass capillary, there are considerable reasons to use a bypass pump configuration.
- Page 268 Appendix B SRS Residual Gas Analyzer...
- Page 269 Appendix C Appendix C Do I need a PPM100 Partial Pressure Monitor for my SRS RGA? Introduction What is the PPM100 controller? How does the PPM100 interface to the SRS RGA? What does the PPM100 controller do? Partial Pressure Monitor and Control ............Leak Test Analysis..................
-
Page 270: Introduction
Appendix C Introduction If you are planning to purchase an SRS RGA, or even if you already own one, you might want to consider the addition of a PPM100 Partial Pressure Monitor to your vacuum setup. The PPM100 was designed based on recommendations from vacuum users with a broad range of partial pressure measurement requirements. -
Page 271: What Is The Ppm100 Controller
RGA control buttons. The PPM100 Partial Pressure Monitor is a standalone, fully-programmable, microprocessor-based vacuum system controller that when connected to any SRS RGA100/200/300 residual gas analyzer can continuously monitor and display partial pressures of up to eight individual gas components. It includes a touchscreen/LCD front-panel display, pressure vs. -
Page 272: How Does The Ppm100 Interface To The Srs Rga
Appendix C How does the PPM100 interface to the SRS RGA? A very important feature of the PPM100 controller is that it eliminates the requirement to connect the SRS RGA to a host PC computer. The RGA is instead connected directly to the PPM100 controller through its standard RGA-RS232 serial interface port and all data is displayed on the front panel of the controller. -
Page 273: What Does The Ppm100 Controller Do
Appendix C What does the PPM100 controller do? Partial Pressure Monitor and Control PPM100 can monitor and display up to eight independent RGA partial pressures on its front panel LCD. Each partial pressure reading has its own (1) mass, (2) detector , (3) scan rate and (4) alarm settings. The Partial Pressure Display mode of operation is primarily used to generate single gas data for leak testing applications, and to track changes in the concentrations of up to eight independent components of a gas mixture as a function of time. -
Page 274: Mass Spec Display
Appendix C Figure 4. Leak trend Display Mode. Use this graphical mode to Leak test components of your vacuum system. PP2 data bar is set to Leak trend, and three display modes are available on the same screen to visualize leak rates during testing. Mass Spec Display A Scan Display mode is available to graph RGA Mass Spectra directly on the front panel of the controller. -
Page 275: Rga Control
Appendix C Figure 5. The Mass Spec Display mode of the PPM100 shows complete RGA Mass spectra and includes a cursor for fast peak identification. RGA Control The PPM100 includes a FILAMENT button on its front panel for manual activation of filament emission as required for partial pressure measurements. -
Page 276: Capacitance Manometer Readings (Cm1-4)
Appendix C Figure 7. The AnalogIO Display mode of the PPM100 (w/CM readings disabled) shows the voltage levels at the analog I/O ports. Use analog I/O ports as inputs to read voltages from vacuum system instruments such as capacitance manometers, analog output third-party gauges, mass flow controllers, turbo pump controllers, etc. Analog output levels can be programmed manually from the front panel, remotely through the computer interface, or they can be linked to partial pressure readings for closed-loop control of gas composition. - Page 277 Appendix C Figure 8. Data Logging (Chart) Display mode of the PPM100. Both Graph and Table display modes are shown side-to-side. The signal-vs-time display allows you to monitor pump-down and venting cycles and follow the time behavior of your system. The logged data can be accessed through the touchscreen LCD.
-
Page 278: Vacuum Process Control
Appendix C Vacuum Process Control Eight channels of process control are standard in the PPM100 controller. Figure 9. Process Control Display mode of the PPM100. Eight process control channels bring additional power and versatility to the PPM100. Each channel has a relay closure output and corresponding opto-isolated TTL output signal, that may be linked to a variety of input sources with intuitive user-programmable rules. -
Page 279: Internet Access
Appendix C Figure 10. Back panel of PPM100. Computer interface ports on the back panel of the PPM100 include: (1) HOST RS232, (2) GPIB, (3) USB, and (4) 10 BASET Ethernet port (for embedded web server) Tip! Computer interfacing is only required for: (1) Computer monitor/control of the PPM100 and vacuum system, (2) Remote access to data-logs and history lists, (3) calibration data uploads, and (4) firmware upgrades (for controller and web server). - Page 280 Appendix C Figure 11. Sample of the PPM100 web page. The EWS provides the most convenient way to access PPM100 data from a computer without writing custom serial or GPIB based software. Display modes supported include: analog-scans, pressure-versus- time, tables, etc. The EWS can also be configured to allow access to process control functions, so that any vacuum system can be monitored and controlled from anywhere in the world.
-
Page 281: Who Should Consider The Ppm100
Appendix C Who should consider the PPM100? RGA users who require auxiliary Analog I/O capabilities. Process vacuum applications often require monitoring analog signals from multiple electronic sources such as capacitance manometers, third-party gauges with analog outputs, mass flow controllers, turbo pump controllers, thermometers, etc. - Page 282 Appendix C If uninterrupted datalogging is a requirement in your process, you should seriously consider the PPM100 as an upgrade for the PC/RGA Windows setup. RGA users who require access to RGA data over the World Wide Web The Embedded Web Server (EWS) available for the PPM100 provides the most convenient way to access RGA data through the Internet.
- Page 283 Appendix C RGA users who demand a traditional standalone controller box Standalone partial pressure display units, which connect directly to RGA mass spectrometers, have been available since the early days of mass spectrometry and are still the preferred display option for many vacuum users.
-
Page 284: Do I Still Need Rga Windows
Appendix C Do I still need RGA Windows? PPM100 is not a complete substitute for RGA Windows. RGA Windows offers several RGA data display options that are not feasible in a standalone, monochrome display unit as the PPM110. Obvious examples include: bigger screen, color-coded gas traces, fast display update, scan logging, deeper data buffers and hard disk data storage. -
Page 285: Ppm100 Specifications
Appendix C PPM100 Specifications Specifications apply after 1 hour of warm-up General Interfaces RS-232 (std.), USB (std), GPIB (std) or Ethernet interface with embedded web server. Power 90 to 264 VAC, 47 to 63 Hz, 240 W Operating temperature 0°C to 40°C, non-condensing Less than 90% humidity Weight/Dimensions 15 lbs. - Page 286 Appendix D Appendix D SRS RGA LabVIEW Development Kit Important! The drivers in the development kit are provided free of charge and AS IS. Support of any modification is solely the responsibility of the end user. This kit was developed and tested under LabVIEW version 5.1. It was also tested for compatibility with LabVIEW version 6.0 (also known as LabVIEW 6i).
- Page 287 Appendix D What does the kit include? The VIs in the kit are divided into three layers. The lowest layer, termed a ““communications layer””, simply encapsulates the RS232 interface commands. The next layer, an ““operations layer”” draws on several of the communications layer VIs and adds some data manipulation to allow rapid development of custom LabVIEW experiments that incorporate the SRS RGA.
- Page 288 Appendix D (Contact National Instruments for the most up-to-date information regarding the requirements for running their LabVIEW software) If you wish to use the kit in order to easily put your data on the web, LabVIEW version 6i includes a built-in web-publishing tool.
- Page 289 Appendix D A good way to get familiar with what each of the sub-VIs of a given VI do is to invoke LabVIEW’’s help feature (press Control-H) and simply move your mouse over each of the VIs. The help will list the input and outputs of each VI as well as any general remarks about the VI.
- Page 290 Appendix D program flow much more quickly than by simply looking at the code. Bear in mind that performance of the program slows drastically as it creates this ““movie”” of what goes on during execution. Layers in the SRS RGA Development Kit Communications Layer VIs What are the communications layer VIs? The VIs in the communications layer encapsulate the low-level serial communication commands as well...
- Page 291 Appendix D The VI takes a few moments before the scan begins in order to perform some initialization tasks on the RGA. After this time, you should see a trace corresponding to the ion currents detected by the RGA as its mass filter is swept.
- Page 292 Appendix D Note that at the far left side of the block diagram, a COM port is specified and an SRS RGA ““session”” is established. The user specifies the COM port in use from the front panel of the VI. A sub-VI, SRSRGAC Connect, handles setting the baud rate, parity and other serial line parameters appropriate for the RGA.
- Page 293 Appendix D Examples The development kit provides three examples of how to use the operations layer. Each example is an application that performs a common RGA scanning mode (table, analog, and histogram). It is likely that your custom application can be created simply modifying one of these examples. Simple Table Try the example: Open LabVIEW...
- Page 294 Appendix D The VI takes a few moments before the scan begins in order to perform some initialization tasks on the RGA. After this time, you should see traces corresponding to the partial pressures detected by the RGA as its mass filter is swept. If the traces do not appear after thirty seconds or you get an error, use the RGA COM program supplied with your RGA to verify communications are set up correctly.
- Page 295 Appendix D As shown in the figure, the Simple Table example uses just six VIs. All the VIs in gray are taken from the operations layer, while the only one that is not is the general SRSRGA Error handler VI. Just as in the communications layer example, you can see that an error cluster is propagated through the six VIs.
- Page 296 Appendix D The VI takes a few moments before the scan begins in order to perform some initialization tasks on the RGA. After this time, you should see a trace corresponding to the partial pressures detected by the RGA as its mass filter is swept. If the trace does not appear after thirty seconds or you get an error, use the RGA COM program supplied with your RGA to verify communications are set up correctly.
- Page 297 Appendix D Note that this block diagram is very similar to the Simple Table block diagram. Again, only six VIs are used. All the VIs in gray are taken from the operations layer, while the only one that is not is the general SRSRGA Error handler VI.
- Page 298 Appendix D Simple Histogram Try the example: Open LabVIEW Select the RGA LabVIEW Library Open the Simple Histogram example, SRSRGAa Simple Histogram From the front panel of the VI, set the COM port that the RGA is using Set the noise floor, mass, and electron multiplier state Run the VI The VI takes a few moments before the scan begins in order to perform some initialization tasks on the RGA.
- Page 299 Appendix D Concepts from the example: Within LabVIEW, view the block diagram of SRSRGAa Simple Analog (press Control-E if you are already looking at the front panel of the VI). The next figure shows this block diagram. Note that this block diagram is very similar to the Simple Table block diagram. Again, only six VIs are used.
- Page 300 Appendix D When should I use this layer? While the simple applications built from the operations layer make great starting points, the fully developed application (SRS RGA LabVIEW) is really for expert LabVIEW programmers. The code is complex, and sparsely documented. It is easy to get stuck with an application that will no longer function correctly.
- Page 301 Appendix D Press the ““Connect”” button. At this point, the application sends some queries to determine hardware parameters and to perform initialization tasks. After a few moments, you should see a menu similar to the next figure: Notice that the window has re-sized to show new menu choices once RGA communication is established. Also, you cannot exit the program without first disconnecting from the RGA.
- Page 302 Appendix D This dialog allows you to change parameters relating to the detector of the RGA. You may wish to change the noise floor value (0 gives the slowest scan with the best signal to noise ratio, 7 is the fastest scan with the poorest signal to noise ratio).
- Page 303 Appendix D The ““virtual led”” next to the Filament label should be lit before performing a scan. (Note: If your vacuum chamber is equipped with an external ionization source SRS RGA LabVIEW will let you scan with the filament off.) Scanning &...
- Page 304 Appendix D we will run a table scan of four different masses with a 10 to 50 AMU scan range and we will log all the data the RGA produces. Change your dialog to look like the following figure: To change the mass range you can either click and drag the graphical bar labeled Mass Range, or enter the initial and final masses directly in the spaces provided.
- Page 305 Appendix D Click the button labeled ““Start Scanning””. After a few moments, you should get a window that looks something like the next figure: SRS Residual Gas Analyzer...
- Page 306 Appendix D If you were doing a leak test, you would change the value in the box labeled ““Leak Ref”” to a reference value. This is the value you wish to classify as a leak. If the partial pressure of the mass selected for leak testing approaches this value, a tone is generated.
- Page 307 Appendix D Configure the Web Server Open LabVIEW 6i Start a new VI Under the Tools menu, select Options From the pull-down menu (whose default tab is ““Paths””, select Web Server: Configuration Click the checkboxes for ““Enable Web Server”” and Log File Unless you have reason to use other values, simply use the default values for the root directory and the log filename.
- Page 308 Appendix D Open and run SRS RGA LabVIEW by selecting the main VI from the library. Perform the scan you wish to publish on the web, then stop the scan and exit the main program. The front panel for both the main VI and the scanning VI remain open. In this example, we will use an analog scan, and SRSRGAa Analog.VI From the front panel toolbar of SRSRGAa Analog.vi, select Tools, then Web Publishing Tool.
- Page 309 Appendix D Once the HTML file is saved, you can preview it in your browser, by clicking the ““Preview in Browser”” button. Once you are satisfied with the HTML file, click ““Start Web Server”” and then click ““Done””. You will get a pop-up notice box that looks something like this: Note that this Universal Resource Locator (URL) address will not work on computers other than the one running the VI.
- Page 310 Appendix D Select TCP/IP and click the Properties button to find the IP address: SRS Residual Gas Analyzer...
- Page 311 Appendix D WARNING!! DO NOT CHANGE any network settings! Making changes will cause problems with your network. Use this dialog box simply to get the IP address of the computer running the VI you wish to put on the web. If you are unable to find the IP address of the computer that will run your VI and serve the web page, contact your network administrator.
- Page 312 Appendix D SRS Residual Gas Analyzer...
- Page 313 Appendix D SRS Residual Gas Analyzer...
- Page 314 Glossary of Terms Glossary of Terms The following is a listing of some of the most important terms used throughout the SRS RGA Operations Manual. For a more complete listing of terms relevant to partial pressure analyzers in general, refer to: ““A Dictionary of Vacuum Terms used in Vacuum Science and Technology, Surface Science, Thin Film Technology and Vacuum Metalurgy””, edited by M.
- Page 315 Glossary of Terms Electron emission. The release of electrons from the heated filament in the ionizer. The electrons are accelerated into the anode grid where the ionization of the gas molecules occurs. Electron emission current. The electron current from the filament to the grid in mAmps. Ion current signals scale linearly with the electron emission current.
- Page 316 Glossary of Terms Ion current. The rate of ion flow into the detector. Usually expressed in units of amps. Ion Energy. The kinetic energy of the ions as they move down the quadrupole mass filter, and expressed in eV. Note: In the SRS RGA the Ion Energy is equal to the voltage biasing of the anode grid in Volts and has two possible settings (i.e.
- Page 317 Glossary of Terms Mass peak. The ion current pattern in the vicinity of maximum amplitude by scanning through a small portion of the mass range containing ions of a single mass-to-charge ratio. Very often, the term ““mass peak”” refers to the signal developed from singly charged ions.
- Page 318 Glossary of Terms Probe (also RGA Probe). Quadrupole mass spectrometer sensor consisting of an ionizer, a mass analyzer and a detector (Farday cup or optional electron multiplier). Repeller (Ionizer Component). The repeller grid cage completely encloses the ionizer, is biased negative relative to the filament, and prevents the loss of electrons from the ion source.
- Page 319 Glossary of Terms Sensitivity calibration. The act of establishing a a correspondence between the change in ion current and the corresponding change in partial pressure of the gas from which the ion is produced. The correspondence might be represented graphically or as a table of values.
- Page 320 Vacuum References ABLE OF ONTENTS ..........................2 ACUUM ECHNOLOGY OOKS ............................2 ESIDUAL NALYSIS ............. 4 PPLICATIONS OF ESIDUAL NALYZERS TO ROCESS UALITY ONTROL ..................... 7 PECIALIZED NUSUAL PPLICATIONS OF ....................9 RESSURE AMPLING IFFERENTIAL UMPING ................. 9 UANTITATIVE EASUREMENTS WITH ESIDUAL NALYZERS ..................
-
Page 321: Vacuum Technology Books
Vacuum Technology Books 1. J. M. Lafferty , editor, ““Foundations of Vacuum Science and Technology””, John Wiley and Sons, Inc., NY, 1998. Note: A great book that every vacuum practitioner should own. 2. J. H. Leck, ““Total and Partial Pressure Measurement in Vacuum Systems””, Blackie, Glasgow&London, 1989. - Page 322 Vacuum References 5. Batey, Vacuum, 37 (1987) 659-668:”” Quadrupole Gas Analyzers”” 6. Fu Ming Mao et. al., Vacuum, 37 (1987) 669-675: ““ The quadrupole mass spectrometer in practical operation”” 7. Dawson, Mass Spectrometry Reviews, 5 (1986) 1-37: ““Quadrupole mass analyzers: Performance, design, and some recent applications””...
- Page 323 Vacuum References 19. S. Boumsellek and R. J. Ferran, ““Trade Offs in Miniature Quadrupole Designs””, J. Am. Soc. Mass Spectrom. 12 (2001) 633. Note: A complete article describing the inherent advantages and limitations of small quadrupole designs. 20. Gerardo A. Brucker, ““How to use an RGA””, R&D Magazine, June 2001, p. 13. 21.
- Page 324 Vacuum References 4. Rosenberg, Semiconductor International, October 1995, p. 149: ““The Advantages of Continuous On-line RGA Monitoring””. 5. Lakeman, Semiconductor International. October 1995, p. 127: ““Increase overall Equipment Effectiveness with In Situ Mass Spectrometry””. 6. Semiconductor International Magazine, October 1995, p. 70, ““ Researchers Demonstrate Viability of QMS for In Situ Diagnostics””...
- Page 325 Vacuum References 19. Jim Snow, Stuart Tison and Walter Plante, ““Evolving gas flow, measurement, and control technologies””, Solid State Technology, October 1999, p. 51. 20. Paul Espitalier-Noel, ““Integrate gas, chemical, vacuum, and exhaust design””, Solid State Technology, Oct. 1999, p. 65 21.
- Page 326 5. Babu Chalamala, Robert Wallace and Bruce Gnade, ““Poisoning of Spindt-type molybdenum field emitter arrays by CO2””, J. Vac. Sci. Technol. B 16(5) (1998) 2866. Note: SRS RGA100 is used in the study of the effect of CO2 on the emission characteristics of Spindt-type molybdenum field emission cathode arrays.
- Page 327 Permanent Gas Analysis””, J. Am. Soc. Mass Spec. 13 (2002) 1004. Note: The SRS RGA100 is compared to several commercial (i.e. Leybold XPR-2 and Ferran Micropole) and research mass specs and found to be the best match for the analysis of cryogenic fuels around the Space Shuttle.
-
Page 328: High Pressure Sampling / D
Vacuum References peak is seen under a completely new light. Note: The 19 amu peak commonly een in RGAs and other mass sspecs is broken down into its multiple subcomponents and hydronium ions are identified as an important contributor””. Prof. Ron Outlaw uses SRS RGA Application notes 7 and 9 as references. - Page 329 Permanent Gas Analysis””, J. Am. Soc. Mass Spec. 13 (2002) 1004. Note: The SRS RGA100 is compared to several commercial (i.e. Leybold XPR-2 and Ferran Micropole) and research mass specs and found to be the best match for the analysis of cryogenic fuels around the Space Shuttle.
- Page 330 Vacuum References 2. Gerhard Lewin, ““An elementary introduction to vacuum technique””, AVS Monograph Series published by the Education Committee of the American Vacuum Society. 3. John T. Yates, ““Experimental Innovations in Surface Science. A guide to Practical Laboratory Methods and Instruments””, Springer-Verlag, New York, 1997. Note: This is an excellent book, with lots of great practical ideas! We highly recommend it.
- Page 331 Vacuum References 18. Phil Danielson, ““Advances in Vacuum Sealing””, Vacuum & Thin Film, Sept. 1999, p. 8 19. Ian Stevenson et. al., ““Choosing a Chamber, Varouos Functions to Consider””, Vacuum & Thin Film, Sept. 1999, p. 23 20. Mike Ackeret, ““Manipulators in a Vacuum: The challenge of manipulating samples in a controlled, ultra-clean or vacuum environment””, Vacuum &...
- Page 332 Vacuum References 34. M. McKeown, ““What you should know about traps, valves and gauges””, Semiconductor International, March 1991, p. 109. 35. M. Lenzen and R.E. Collins, ““Hermetic indium metal-to-glass tube seal””, J. Vac. Sci. Technol A18(2) (2000) 552. 36. Adam M. Hawkridge et. al. ““Cryogenic ultrahigh vacuum manipulator for angle dependent x-ray photelectron spectroscopy studies””, J.
- Page 333 Vacuum References 51. Phil Danielson, ““How to Use the Q= S P Vacuum Relationship””, R&D Magazine, March 2001, p. 33. 52. Donald Mattox, ““Safety Aspects of Vacuum Processing””, Vacuum Technology and Coating, March 2001, p. 22. 53. Gerardo Brucker, ““Prevention is Key to Vacuum System Safety””, R&D Magazine, Feb.
-
Page 334: Vacuum System Contamination
Vacuum References 67. Stan Kassela, ““Improving fab productivity with predictive vacuum maintenance””, Solid State Technology, Feb 2003, p.77. 68. Phil Danielson, ““The Flavor Issue-How to Choose the Right Vacuum Materials””, R&D Magazine, April 2003, p. 39-40. 69. Philip Lessard, ““Vacuum Issues in the semiconductor Industry, Ion Implantation””, Vacuum Technology and Coating, June 2003, p. - Page 335 Vacuum References 1. Vic Comello, R&D Magazine, March 1993, p. 57, ““Cleansing your quadrupole, Cryopumps Enhance Low-Level Contamination Detection”” 2. J. Gomez-Goni and A. G. Mathewson, J. Vac. Sci. Technol. A 15(6) (1997) 3093, ““Temperature dependence of the electron induced gas desorption yields on stainless steel, copper and aluminum””...
- Page 336 Vacuum References 17. Greg A. Pfister, ““Eliminating Seal Contamination in Semiconductor Process Equipment””, Vacuum Technology &Coating, June 2000, p. 29. 18. L. Layden and D. Wadlow, ““High Velocity carbon dioxide snow for cleaning vacuum system surfaces””, J. Vac. Sci. Technol. A 8(5) (1990) 3881. 19.
-
Page 337: Vacuum Pumps
Vacuum References 32. Donald Mattox, ““Cleaning with CO ””, Vacuum Technology and Coating, March 2003, p.62. 33. Y. Saito, et. al., ““Outgassing measurements of stacked laminations for use as electromagnet core””, J. Vac. Sci. Technol. A 22(5)(2004) 2206. 34. Hans H. Funke, Jianlong Yao, and Mark W. Raynora), ““Trace moisture emissions from heated metal surfaces in hydrogen service””, J. - Page 338 Vacuum References 14. Gary Ash, ““Cryogenic High Vacuum Pumps: An overview of their application and use””, Vacuum&ThinFilm, August 1999, p. 20. 15. Phil Danielson, ““Cryopump Crossover””, Vacuum&ThinFilm, November 1999, p. 8 16. Vic Comello, ““Tailoring Traps to Specific applications””, R&D Magazine, January 2000, p.
- Page 339 Vacuum References 30. Vic Comello, ““Ion Pumps Provide Clean UHV Environments””, R&D Magazine, July 2000, p. 45 31. Steven Chambreau, et. al. , ““Low cost, mechanically refrigerated diffusion pump baffle for ultrahigh vacuum chambers””, J. Vac. Sci. Technol. A 18(5) (2000) 2581 32.
- Page 340 Vacuum References 47. Phil Danielson, ““Matching Vacuum Pump to process””, R&D Magazine, November 2001, p. 53. Note: A quick , concise and useful primer on pump choices. 48. Phil Danielson, ““Water Vapor Pumping Produces Unique Problems””, R&D Magazine Feb 2002, p.59. 49.
- Page 341 Vacuum References Total Pressure Measurement 1. J. H. Leck, ““Total and Partial Pressure Measurement in Vacuum Systems””, edited by Blackie and Son Limited, 1989, Glasgow and London,. 2. Stephen P. Hansen, Vacuum and Thin Film, May 1999, p. 24, ““Vacuum Pressure Measurement””.
- Page 342 Vacuum References 18. Emil Drubetsky and Richard Glazewski, ““Vacuum Measuremeents using Modern Cold Cathode Technology””, Vacuum Technology and Coating, Oct 2002, p. 54. 19. Donald Mattox, ““Vacuum Gauging””, Vacuum Technology & Coating, February 2003, p. 26. 20. Donald Mattox, ““Vacuum Gauges for the Plasma Environment””, Vacuum Technology and Coating, June 2003, p.
- Page 343 Vacuum References 12. Filipelli AS. R., JVST A14(5) (1996) 2953, ““Influence of envelope geometry on the sensitivity of ““nude”” ionization gauges”” 13. Suginuma S. et. al. , ““Dependence of sensitivity coefficient of a nude type Bayard- Alpert Gauge on the diameter of an envelope””, Vacuum 53 (1999) 177-180. 14.
- Page 344 Vacuum References 28. R. Baptist et. al. ,””Bayard-Alpert vacuum Gauge with microtips”” J. Vac. Sci. Technol. B14(3) (1996) 2119 29. Peacock, R. N. et. al. , JVST A9(3) (1991) 1977, ““Comparison of hot cathode and cold cathode ionization gauges””. 30. Beeck, U. et. al. , JVST 9 (1971) 126 , ““Comparison of the pressure indication of a Bayard-Alpert and an Extractor Gauge””.
-
Page 345: Pirani/Thermocouple Gauges
Vacuum References 43. Hiroshi Saeki, ““Vacuum Gauge system with a self-compensator for photoelectrons produced in the Spring-8 storage ring””, J. Vac. Sci. Technol. A 19(1) (2001) 349 44. P. H. LaMarche, et. al.,””Neutral Pressure and gas flow instrumentation for TFTR””, Rev. - Page 346 Vacuum References 2. Sharrill Dittmann, ““High Vacuum Standard and its use””, NIST Special Publication 250-34. U.S. Department of Commerce , National Institute of Standards and Technology, 3. K. E. McCulloh et. al. ““Summary Abstract: The national Bureau of standards orifice- flow primary high vacuum standard””, J.
-
Page 347: Esorption
Vacuum References 18. S. P. Hansen, ““ Vacuum Instrument Calibration & Personnel Training Boost Productivity””, Vacuum Technology &Coating, April 2001, p. 46. 19. Kimo Welch, ““Verifying a Leak Checker’’s Sensitivity to 10 TorrL/s (He)””, Vacuum Technology &Coating, April 2001, p.12. Temperature Programmed Desorption 1. - Page 348 Vacuum References 14. R. M. Hardeveld et. al.””Kinetics of elementary surface reactions studied by static secondary ion mass spectrometry and temperature programmed reaction spectroscopy””, J. Mol. Catalysis A: Chem 131 (1998) 199-208 15. Herbert J. Tobias and Paul J. Ziemann, ““Compound Identification in Organic Aerosols Using TPD Particle Beam Mass Spectrometry””, Anal Chem.
-
Page 349: Publications
Vacuum References 2. Colin S. Creaser, David Gomez Lamarca, Jeffrey Brum, Christopher Werner, Anthony P. New and Luisa M. Freitas dos Santos,””Reversed-Phase Membrane Inlet Mass Spectrometry Applied to the Real-Time Monitoring of Low Molecular Weight Alcohols in Chloroform””, Anal. Chem. 74(2002) 300-304. NOTE: A SRS QMS300 is used to perform real-time MIMS determinations of alcohols in chloroform. - Page 350 Vacuum References Vacuum Technology &Coating. A new magazine that started on JAN 2000. For subscriptions contact www.vactechmag.com. Loaded with vacuum information, high on editorial, low on ads. Semiconductor International. Another monthly Cahners publication dedicated to semiconductor processing subjects. Available on the web: www.semiconductor.net Solid State Technology.
- Page 351 Packaging, Transportation and Labeling of Dangerous Substances. Name (print): _________________________________________________________ Job Title: _______________________________________________________________ Organization: ____________________________________________________________ Address: ________________________________________________________________ Telephone: ______________________________ Fax: __________________________ Legally binding signature: ____________________________________________________ Date: ______________ Stanford Research Systems, 1290 D Reamwood Ave., Sunnyvale, CA 94089, Ph. (408) 744-9040, FX. 744-9049...
- Page 352 RGA Parts List RGA Parts List Rev E Components Top Board Components Ref. SRS p/n Value Description C 100 5-00023-529 Cap, Monolythic Ceramic, 50V, 20%, Z5U C 101 5-00221-529 330P Cap, Monolythic Ceramic, 50V, 20%, Z5U C 102 5-00221-529 330P Cap, Monolythic Ceramic, 50V, 20%, Z5U C 103 5-00285-562...
- Page 353 RGA Parts List D 109 3-00004-301 1N4148 Diode D 300 3-00203-301 1N5711 Diode D 301 3-00203-301 1N5711 Diode D 302 3-00203-301 1N5711 Diode D 303 3-00203-301 1N5711 Diode D 304 3-00004-301 1N4148 Diode D 305 3-00203-301 1N5711 Diode J 100 1-00143-101 TEST JACK Vertical Test Jack...
- Page 354 RGA Parts List R 128 4-00022-401 1.0M Resistor, Carbon Film, 1/4W, 5% R 202 4-00138-407 10.0K Resistor, Metal Film, 1/8W, 1%, 50PPM R 203 4-00138-407 10.0K Resistor, Metal Film, 1/8W, 1%, 50PPM R 204 4-00053-401 Resistor, Carbon Film, 1/4W, 5% R 205 4-00031-401 Resistor, Carbon Film, 1/4W, 5%...
- Page 355 RGA Parts List U 103 3-00366-341 32KX8-35 STATIC RAM, I.C. U 104 3-00109-340 MC1488 Integrated Circuit (Thru-hole Pkg) U 105 3-00110-340 MC1489 Integrated Circuit (Thru-hole Pkg) U 106 3-00036-340 74HC00 Integrated Circuit (Thru-hole Pkg) U 107 6-00185-621 11.0592 Crystal Oscillator U 108 3-00169-340 74HC4020...
- Page 356 RGA Parts List C 423 5-00121-566 .0047U Cap, Polyester Film 50V 5% -40/+85c Rad C 424 5-00121-566 .0047U Cap, Polyester Film 50V 5% -40/+85c Rad C 425 5-00005-501 150P Capacitor, Ceramic Disc, 50V, 10%, SL C 500 5-00034-526 100U Capacitor, Electrolytic, 35V, 20%, Rad C 501 5-00003-501 Capacitor, Ceramic Disc, 50V, 10%, SL...
- Page 357 RGA Parts List D 617 3-00228-301 MUR160 Diode D 618 3-00228-301 MUR160 Diode D 619 3-00228-301 MUR160 Diode D 620 3-00228-301 MUR160 Diode D 621 3-00228-301 MUR160 Diode D 622 3-00228-301 MUR160 Diode D 623 3-00625-302 MBR1535CT Diode, Dual Schottky F 600 6-00135-611 5A 2AG...
- Page 358 RGA Parts List R 415 4-00800-401 Resistor, Carbon Film, 1/4W, 5% R 416 4-00800-401 Resistor, Carbon Film, 1/4W, 5% R 417 4-00800-401 Resistor, Carbon Film, 1/4W, 5% R 418 4-00800-401 Resistor, Carbon Film, 1/4W, 5% R 419 4-00034-401 Resistor, Carbon Film, 1/4W, 5% R 420 4-00192-407 49.9K...
- Page 359 RGA Parts List R 526 4-00048-401 2.2K Resistor, Carbon Film, 1/4W, 5% R 527 4-00079-401 4.7K Resistor, Carbon Film, 1/4W, 5% R 528 4-00021-401 1.0K Resistor, Carbon Film, 1/4W, 5% R 529 4-00457-407 33.2K Resistor, Metal Film, 1/8W, 1%, 50PPM R 530 4-00034-401 Resistor, Carbon Film, 1/4W, 5%...
- Page 360 RGA Parts List Vertical Board Components Ref. SRS p/n Value Description C 700 5-00023-529 Cap, Monolythic Ceramic, 50V, 20%, Z5U C 701 5-00023-529 Cap, Monolythic Ceramic, 50V, 20%, Z5U C 750 5-00339-574 .5P 500V SMT SMT, High Voltage Porcelain Cap. C 751 5-00339-574 .5P 500V SMT...
- Page 361 RGA Parts List LX800 0-00772-000 1.5" WIRE Hardware, Misc. 7-00669-701 RGA VERTICALS Printed Circuit Board Q 401 3-00082-329 D44VH10 Voltage Reg., TO-220 (TAB) Package Q 402 3-00629-329 IRF510 Voltage Reg., TO-220 (TAB) Package Q 403 3-00629-329 IRF510 Voltage Reg., TO-220 (TAB) Package Q 500 3-00283-340 IRF530/IRF532...
- Page 362 RGA Parts List 0-00231-043 1-32, #4 SHOULD Washer, nylon 0-00238-026 6-32X1/4PF Screw, Black, All Types 0-00259-021 4-40X1/2"PP Screw, Panhead Phillips 0-00308-021 4-40X7/8PP Screw, Panhead Phillips 0-00316-003 PLTFM-28 Insulators 0-00317-070 40MM 24V Fans, & Hardware 0-00551-000 40MM FAN GUARD Hardware, Misc. 0-00588-030 #4X5/16"...
Need help?
Do you have a question about the RGA100 and is the answer not in the manual?
Questions and answers