Table of Contents
Advertisement
Quick Links
Operating Manual and
Programming Reference
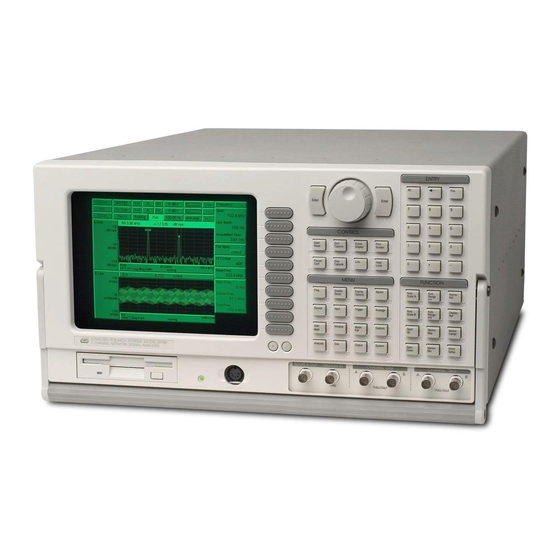
Model SR780
Network Signal Analyzer
1290-D Reamwood Avenue
Sunnyvale, CA 94089 U.S.A.
Phone: (408) 744-9040 • Fax: (408) 744-9049
Email: info@thinkSRS.com • www.thinkSRS.com
Copyright © 1995, 1996, 2005, 2014, 2017
Stanford Research Systems, Inc.
All Rights Reserved
Revision 2.4. (
201 )
Advertisement
Table of Contents

Related Manuals for Stanford Research Systems SR780


Summary of Contents for Stanford Research Systems SR780
- Page 1 Network Signal Analyzer 1290-D Reamwood Avenue Sunnyvale, CA 94089 U.S.A. Phone: (408) 744-9040 • Fax: (408) 744-9049 Email: info@thinkSRS.com • www.thinkSRS.com Copyright © 1995, 1996, 2005, 2014, 2017 Stanford Research Systems, Inc. All Rights Reserved Revision 2.4. ( 201 )
- Page 2 (1) year from the date of shipment. Service For warranty service or repair, this product must be returned to a Stanford Research Systems authorized service facility. Contact Stanford Research Systems or an authorized representative before returning this product for repair.
- Page 3 Contact the factory for instructions on how to return the instrument for authorized service and adjustment. The fans in the SR780 are required to maintain proper operation. Do not block the vents in the chassis or the unit may not operate properly.
- Page 4 SR780 Network Signal Analyzer...
-
Page 5: Table Of Contents
2-30 The Source 2-33 Octave Analysis 2-35 Swept Sine Measurements 2-41 Trace Storage 2-48 User Math Functions 2-49 Signal Inputs 2-55 Input Connections 2-58 Intrinsic Noise Sources 2-60 External Noise Sources 2-61 Chapter 3 Operation Overview SR780 Network Signal Analyzer... - Page 6 Average Menus 4-91 FFT Average Menu 4-91 Octave Average Menu 4-99 Swept Sine Average Menu 4-103 User Math Menu 4-107 Window Menu 4-115 Waterfall Menu 4-119 Capture Menu 4-127 Analysis Menu 4-131 Data Table Analysis Menu 4-133 SR780 Network Signal Analyzer...
- Page 7 5-75 Disk Commands 5-76 Output Commands 5-79 System Commands 5-82 Front Panel Commands 5-84 Data Transfer Commands 5-89 Interface Commands 5-101 Nodal Degree-of-Freedom Commands 5-102 Status Reporting Commands 5-104 Status Word Definitions 5-108 Example Program 5-113 SR780 Network Signal Analyzer...
- Page 8 Contents Chapter 6 File Conversion Why File Conversion Supported External File Types SR780 File Types Using the File Conversion Utility SR780 Network Signal Analyzer...
-
Page 9: Table Of Figures
3-12 Figure 3-5 Vertical Scale Bar 3-13 Figure 3-6 Horizontal Scale Bar 3-14 Figure 3-7 Marker Region 3-14 Figure 3-8 Marker Position Bar 3-15 Figure 3-9 Status Indicator Panel 3-17 Figure 3-10 Front Panel Keypad 3-22 SR780 Network Signal Analyzer... - Page 10 SR780 Network Signal Analyzer...
-
Page 11: Features
Burst Noise Chirp Burst Chirp Arbitrary Trigger Free Run External (Analog and TTL) Internal Source Auto/Manual Arming Time Capture Capture time data for later analysis (FFT or Octave). Up to 2M samples of data can be saved. SR780 Network Signal Analyzer... - Page 12 Print/Plot on-line (serial, parallel or IEEE-488) or to disk file. GIF, EPS and PCX graphic formats available for disk output. Interfaces RS232 serial, Centronics parallel and IEEE-488. Help On screen help system provides Operating Manual and Programming Reference on-line. SR780 Network Signal Analyzer...
-
Page 13: Specifications
Cross Channel ± 0.5 deg (dc to 51.2 kHz) ± 1.0 deg (dc to 102.4 kHz) (Transfer Function measurement, both inputs on the same Input Range, Vector averaged.) SR780 Network Signal Analyzer... - Page 14 Lower rates may be used for longer capture. Maximum Capture Length 2M samples standard, 4M and 8M samples optional. Octave Analysis Standards Conforms to ANSI S1.11-1986, Order 3, Type 1-D. Frequency Range Band centers: Single Channel SR780 Network Signal Analyzer...
-
Page 15: White Noise
<0.25 dB pk-pk (typical), <1.0 dB pk-pk (max), (5000 rms averages). Pink Noise Time Record Continuous or Burst Bandwidth DC to 102.4 kHz Flatness <2.0 dB pk-pk, 20 Hz - 20 kHz, (measured using averaged 1/3 Octave Analysis). SR780 Network Signal Analyzer... - Page 16 Storage of data, setups and hardcopy. Preamp Power Power connector for SRS preamplifiers. Power 70 Watts, 100/120/220/240 VAC, 50/60 Hz. Dimensions 17"W x 8"H x 22"D Weight 56 lb. Warranty One year parts and labor on materials and workmanship. SR780 Network Signal Analyzer...
- Page 17 These example measurements are designed to acquaint the first time user with the SR780 Network Analyzer. They provide a foundation for understanding how to use the SR780. For a more complete overview of the instrument and its capabilities, refer to the ‘Analyzer Basics’ and ‘Operation’ sections of this manual.
- Page 18 Getting Started SR780 Network Signal Analyzer...
-
Page 19: General Installation
Dimmer buttons below the softkeys (below right of the display). Do not set the brightness higher than necessary. The fans in the SR780 are required to maintain proper operation. Do not block the vents in the chassis or the unit may not operate properly. -
Page 20: Front Panel Quick Start
<Softkeys> The SR780 has a menu driven user interface. The Menu keys each display a menu of softkeys. The softkeys are at the right of the video display and have different functions depending upon the displayed menu. -
Page 21: Things To Watch Out For
Trigger Level is appropriate for the trigger signal. Check that the Trigger Mode is set to Auto Arm. If the Trigger Mode is Manual Arm, then the analyzer will only trigger once and then wait for the next Manual Arm command. SR780 Network Signal Analyzer... -
Page 22: Getting Started
If the analyzer still seems to function improperly, turn the power off and turn it back on while holding down the [<-] (backspace) key. This will reset the analyzer into the default configuration. The analyzer should power on running and taking measurements. SR780 Network Signal Analyzer... -
Page 23: Analyzing A Sine Wave
Analyzing a Sine Wave This measurement investigates the spectrum of a 1.024 kHz sine wave. You will use the SR780 source to provide the sine signal (or you can use a function generator capable of providing a 1.024 kHz sine wave at a level of 100 mV to 1 V, such as the SRS DS345). - Page 24 Position (for the active display). The signal will be at the center of the span. Further adjustments to the span will keep the center frequency fixed. 10. Let's look at the signal distortion. Press [Freq] Select the Frequency menu. SR780 Network Signal Analyzer...
- Page 25 Choose the Harmonic Marker for the active display. [Enter]. Press <# Harmonics> Adjust the Number Of Harmonics for analysis. Use the knob to adjust the Number Of Enter 10 harmonics. Harmonics to 10 and press [Enter]. SR780 Network Signal Analyzer...
- Page 26 Harmonic power is an absolute measurement of the harmonic power level. This concludes this measurement example. You should have a feeling for the basic operation of the menus, knob and numeric entry, marker movement and some function keys. SR780 Network Signal Analyzer...
-
Page 27: Measuring A Transfer Function
This example investigates the transfer function of the test filter (enclosed with this manual) using FFT measurements. You will use the SR780 source to provide a broad band chirp and both input channels to measure the input to and output from the device under test. - Page 28 The graph might look better on a log x axis. Select (Log) with the knob and press [Enter]. Log scale is a common way to display filter response functions. 9. Let’s show phase response on DisplayB The two displays have separate Measurements. (bottom). SR780 Network Signal Analyzer...
- Page 29 12. Press [Link] and use the knob to move the The [Link] key links the two display markers marker. together. This allows simultaneous readout of Transfer Function Magnitude (top) and Phase (bottom). Press [Enter] Pressing any key removes the link between the markers. SR780 Network Signal Analyzer...
- Page 30 DisplayA Marker. To do this, change the DisplayB Marker Type to Linked also. This concludes this measurement example. You should have a feeling for the basic operation of two channel measurements and the use of [Active Display]. SR780 Network Signal Analyzer...
-
Page 31: Linking (Advanced Operation)
This example investigates the test filter (enclosed with this manual) using FFT measurements. You will use the SR780 source to provide a broad band source and both displays to measure the output of the device under test. Display parameter linking and function linking will be explored in greater detail. - Page 32 Use the knob to adjust the Span to 3.2 kHz and Change the Span of DisplayA to 3.2 kHz. The Span press [Enter]. of DisplayB remains at 12.8 kHz. The SR780 allows the two displays to have differing Spans and Start frequencies.
- Page 33 Auto Scale keys. Press [Link] and then [Auto Scale A] Pressing [Link] [Auto Scale A] first auto scales DisplayA and then changes the scale of DisplayB to match. This is convenient when you are comparing the two displays. SR780 Network Signal Analyzer...
- Page 34 [Link] [Auto Scale] matches the active display. [Span Up] and [Span Down] are always linked. This concludes this measurement example. You should have a feeling for linking and unlinking and the flexibility of unlinked measurements. SR780 Network Signal Analyzer...
-
Page 35: Triggering And The Time Record
Change the Measurement of the active display (B). Select (Time1) with the knob and press [Enter]. Choose Time Record of Ch1 for the measurement in DisplayB (bottom). 5. Press [Trigger] Select the Trigger menu. Press <Trigger Mode> Change the Trigger Mode. SR780 Network Signal Analyzer... - Page 36 Choose the Hanning window. Notice how the [Enter]. spectrum in DisplayA goes away. Press [Display Setup] Select the Display Setup menu. Press <Measurement> Change the Measurement of DisplayB to show the effect of the Hanning window on the time record. SR780 Network Signal Analyzer...
- Page 37 The Uniform (and Force) windows have no gain and should be used with pulsed signals such as this. Press <DelayA> We need to change the trigger delay for DisplayA in order to recover the spectrum. SR780 Network Signal Analyzer...
- Page 38 If the generator is set to 256 Hz pulse rate, the signal will drift slowly in the time record. This is because the SR780 time records are exactly 1/256 Hz (3.90625 ms) long (400 lines at full span) and the analyzer is running in real time (no missed data).
- Page 39 Triggering and the Time Record 1-23 SR780 Network Signal Analyzer...
- Page 40 1-24 Triggering and the Time Record SR780 Network Signal Analyzer...
-
Page 41: Octave Analysis
Octave Analysis This example investigates the test filter (enclosed with this manual) using Octave measurements. You will use the SR780 source to provide a broad band source and both displays to measure the output of the device under test. Refer to ‘Octave Analysis’ in Chapter 2 for more about Octave Analysis measurements. - Page 42 Change the number of bands per octave. Use the knob to select (Full) and press [Enter]. Choose Full octave bands. Each band represents a full octave with very poor frequency resolution. Press <Octave Resolution> Change the number of bands per octave again. SR780 Network Signal Analyzer...
- Page 43 1 channel analysis. Use the knob to select 40 kHz and press [Enter]. Set the highest band to 40 kHz. This is the highest allowed band for 1 channel, 1/3 octave analysis. SR780 Network Signal Analyzer...
- Page 44 Press [Link] [Auto Scale A] The A-Weighted spectrum is a bandpass centered around 2 kHz. This concludes this measurement example. You should have a feeling for Octave measurements and how they are setup. SR780 Network Signal Analyzer...
-
Page 45: Capture
Capture 1-29 Capture This example investigates the Capture buffer using FFT measurements. You will use the SR780 to capture a signal and then analyze it from memory. 1. Press [System] Display the System menu. Press <Preset> Preset returns the unit to its default settings. - Page 46 The graph shows the envelope of the data in this case. Zoom in to show individual points. ‘Expand’ below the graph indicates that the graph has been graphically zoomed and does not show all of the data along the X axis. SR780 Network Signal Analyzer...
- Page 47 Select the Input menu. Press <Input Source> Change the Input Source. Use the knob to select (Analog) and press Choose Analog input again. The Capture [Enter]. parameters can not be modified while the measurement input is Playback. SR780 Network Signal Analyzer...
- Page 48 Use the knob to select (Playback) and press Choose Playback from Capture. Since there is [Enter]. captured data for both inputs, both displays start measuring from the capture. Press [Auto Scale A] and [Auto Scale B]. Scale the displays to show the measurements. SR780 Network Signal Analyzer...
- Page 49 11. Press [Freq] Select the Frequency menu. Press <Span> Change the measurement span. The span can not be increased above 51.2 kHz since the captured data is bandwidth limited to 51.2 kHz (because of our capture sampling rate). SR780 Network Signal Analyzer...
- Page 50 Change the Playback Length to an exact number of time records. Press [Start/Reset] Start the playback again. This concludes this example. Capture and Playback is a way to record a signal and re-analyze it over and over. SR780 Network Signal Analyzer...
-
Page 51: Waterfall Display
In this example, we will simulate a reverberation measurement measuring the SR780 source. To perform a real measurement, you would use the source to drive a power amplifier and a microphone to receive the signal. - Page 52 In this case, a new measurement is made every 8 ms, regardless of triggering. If we choose Triggered, then a measurement is made only when triggered. Press <Power Bin> Change the Power Bin. SR780 Network Signal Analyzer...
- Page 53 (Linear Avg Mode=Continuous). Since the source only outputs noise for 96 ms, the rise and fall of the measurement goes by very quickly. Press [System] Select the System menu. Press <Preferences> Select the user Preferences menu. SR780 Network Signal Analyzer...
- Page 54 Entering 50 changes the total count for both displays to 50. 10. Press [Trigger] Select the Trigger menu again. Press [Start/Reset] [Start/Reset] starts the measurement. Since the measurement is triggered (not Free Run), nothing happens until the first trigger is received. SR780 Network Signal Analyzer...
- Page 55 Move the marker all the way to the right hand The last bin in the octave display is the total sound edge of the display. The marker position should level L (as selected by <Power Bin>). read ‘L:49’. SR780 Network Signal Analyzer...
- Page 56 Press [0] [Enter]. Enter record 0 (most recent at the back). Press <Angle> Change the skew angle of the display. Use the knob to select (45°) and press [Enter]. Choose 45° to skew the opposite way. SR780 Network Signal Analyzer...
- Page 57 Waterfall menu which you should familiarize yourself with. The transient response of any FFT or Octave measurement may be recorded in a waterfall buffer. Using a slice will give a time evolution of a single X axis bin. SR780 Network Signal Analyzer...
- Page 58 1-42 Waterfall Display SR780 Network Signal Analyzer...
-
Page 59: Swept Sine Measurement
This example investigates the test filter (enclosed with this manual) using Swept Sine measurements. You will use the SR780 source to provide a sweeping sine source and both inputs to measure the input to and output from the device under test. - Page 60 Scale the display to show the Transfer Function. 7. Press [Marker] Select the Marker menu. Press <Width> Change the Marker Region width. Select (Normal) with the knob and press [Enter]. Choose Normal Width (1/2 division). Press <Seeks> Change the Marker Seeks function. SR780 Network Signal Analyzer...
- Page 61 Let’s change these to optimize both the measurement and the measurement time. Press [Auto Range Ch1] and [Auto Range Ch2] Change both inputs to Auto Range (the Input Range indicators at the top of the screen are highlighted). SR780 Network Signal Analyzer...
- Page 62 Threshold (on either input), then the sweep returns to the earlier point and continues with no skipping. This ‘fills’ in the region where the response is rapidly changing. The sweep continues from this point, speeding up when allowed and slowing down when required. SR780 Network Signal Analyzer...
- Page 63 Source level of 1 V and the Ch2 signal drops to -60 dBV. The spectrum of Ch1 measures the actual source level at each point and the Transfer Function is still calculated correctly. 12. Press [Active Display] Switch back to DisplayA (Transfer Function). SR780 Network Signal Analyzer...
- Page 64 This concludes this measurement example. You should have a basic understanding of Swept Sine measurements. The Input Range, Resolution and Source Level optimizations greatly extend the dynamic range of the measurement while minimizing the measurement times. SR780 Network Signal Analyzer...
-
Page 65: Saving And Recalling
The marker can also be set to read the current data relative to the reference graph. The reference graph can be loaded by copying the current live data or by copying a stored trace. SR780 Network Signal Analyzer... - Page 66 Press [Span Up] twice to return to full span. Change the live measurement. Press [Active Display] Make DisplayB (bottom) active. Press [Alt] [Help/Local] Trace to Display is an alternate function. This function recalls trace data to the active display. SR780 Network Signal Analyzer...
- Page 67 6. Put a blank 1.44MB, 3.5” disk into the disk Let’s save DisplayA to a disk file. drive. Use a blank disk if possible, otherwise any disk that you don’t mind formatting will do. Make sure the write protect tab is off. SR780 Network Signal Analyzer...
- Page 68 To recall a file, first specify the file name. You can either enter the name or select from the file catalog. Turn the knob to display the file catalog. Turning the knob while <File Name> is highlighted displays the file catalog of the current directory. SR780 Network Signal Analyzer...
- Page 69 Use the knob to select (Live) and press [Enter]. Choose Live to return the live measurement to DisplayB. This concludes this example. Remember, ‘Off-Line’ displays are showing stored data, not live measurement results. Many measurement parameters can not be adjusted for an ‘Off-Line’ display. SR780 Network Signal Analyzer...
- Page 70 1-54 Saving and Recalling SR780 Network Signal Analyzer...
-
Page 71: User Math Functions
This example measures the group delay of the test filter (enclosed with this manual) using User Math Functions. You will use the SR780 source to provide a broad band source and both displays to measure the output of the device under test. - Page 72 Choose FFT(1) as the denominator of the transfer [Enter]. function. Press <Function String> This key moves the marker to the function string at the top of the screen. This allows you to delete terms and insert new ones. SR780 Network Signal Analyzer...
- Page 73 Most points are in the neighborhood of 10 to 600 µ At the 1 kHz notch, the group delay has a singularity. Remember, the notch filter has a phase discontinuity at the notch frequency. SR780 Network Signal Analyzer...
- Page 74 This concludes this example. User Functions allow you to define your own measurements starting with the basic SR780 measurements. User Functions can also use stored trace data (for calibrations and normalizations) and user constants. SR780 Network Signal Analyzer...
-
Page 75: Limit Testing
Limit Testing 1-59 Limit Testing This example is intended to familiarize the user with limit testing. Limit Testing tests the measurement data against a set of defined Limit Segments. When measurement data exceeds a Limit Segment at any point, the test fails. Each display has its own set of Limit Segments. A Limit Segment is defined as the line between the pair of points (X0,Y0) and (X1,Y1). - Page 76 1-60 Limit Testing Press <Y0> Select Y0. Press [-] [1] [0] [Enter] Enter a value of -10 dBVpk. Press <X1> Select X1. Press [1] [2] [0] [0] [0] [Enter] Enter a value of 12000 Hz. Press <Y1> Select Y1. Press [-] [1] [0] [Enter] Enter a value of -10 dBVpk.
- Page 77 Limit Testing 1-61 Press [9] [0] [0] [0] [0] [Enter] Enter a value of 90000 Hz. Press <Y1> Select Y1. Press [-] [8] [0] [Enter] Enter a value of -80 dBVpk. The segment should be above the noise floor. The limit test should still pass.
- Page 78 This concludes this example. Limit testing is a powerful tool for repetitive tests. In an automated test environment, limit segments are usually downloaded from a host computer. The SR780 performs the limit testing in real-time and the results are queried by the host computer.
-
Page 79: Exceedance Statistics
Exceedance Statistics 1-63 Exceedance Statistics This example is intended to familiarize the user with calculating exceedance centile statistics (L ). L calculated from measurements stored in the waterfall buffer. is the amplitude at each bin which is exceeded by n% of the records in the waterfall. L is commonly used to characterize environmental noise levels. - Page 80 1-64 Exceedance Statistics Use the knob to select (L) and press [Enter]. Choose L (L ) as the sound level bin. L is a standard broad band sound measurement. The result is displayed as the last bin in the display and is labeled ‘L’.
- Page 81 Exceedance Statistics 1-65 Press [Pause/Cont] Pause the measurement. Exceedance calculation requires that the active display be paused. This ensures that the waterfall buffer is static and no new records will be added during the calculation. Press <Calculate Excd>, choose (Trace 1) with The exceedance results are stored in a data trace.
- Page 82 1-66 Exceedance Statistics This concludes this example. Exceedance is a common measurement for environmental noise levels, such as airports or highways. Change the octave integration time and waterfall storage interval to optimize the measurement rate. Use a larger waterfall buffer (up to 2000 measurements per display) for long monitoring times.
- Page 83 2-15 Waterfall Display 2-29 Cross Spectrum 2-15 Transfer Function 2-15 Capture Buffer 2-30 <F2/F1> 2-15 Input Sampling 2-30 <F2>/<F1> 2-16 Capture Fill 2-30 Force-Exponential 2-16 Capture Playback 2-31 Coherence 2-16 Capture as the Arbitrary Source 2-32 SR780 Network Signal Analyzer...
- Page 84 Resistive Coupling (Ground Loops) 2-63 Transfer Function 2-43 Microphonics 2-63 User Function 2-44 Thermocouple Effects 2-64 Averaging - Settling and Integration 2-44 Sweep Frequency and Auto Resolution 2-45 Input Auto Ranging 2-46 Source Auto Level and Ramping 2-46 SR780 Network Signal Analyzer...
-
Page 85: Measurement Groups
Measurement Groups Measurement Groups The SR780 is organized into three Measurement Groups - FFT, Octave Analysis and Swept Sine. Choose the Measurement Group in the [Display Setup] menu. The Measurement Group determines how the input data is processed. In FFT group, the input data is gathered into time records which are then transformed into spectra. -
Page 86: What Is An Fft
(in the frequency domain). In the SR780, sampling occurs at 262 kHz. To make sure that Nyquist's theorem is satisfied, the input signal passes through an analog anti-aliasing filter that removes all frequency components above 102.4 kHz. - Page 87 (which you haven't measured yet). This is not a practical solution. Instead, the way to measure the signal accurately is to lengthen the time record and change the span of the spectrum. SR780 Network Signal Analyzer...
-
Page 88: Fft Frequency Spans
Full span is the widest frequency span corresponding to the fastest available sampling rate. In the SR780, this is DC to 131 kHz using a sampling rate of 262 kHz. Because the signal passes through an anti-aliasing filter at the input, the entire frequency span is not useable. - Page 89 The sampling rate is the number of points in the time record divided by the duration of the time record. The SR780 allows FFT resolutions of 100, 200, 400 or 800 bins (not counting DC). Changing the resolution does not change the span, instead the time record length is changed.
-
Page 90: Fft Time Record
The new time record must have twice the original duration and thus, half of the original span. This results in a 51.2 kHz (±25.6 kHz) span centered at 51.2 kHz. The time record duration is twice the full span time record. The sample rate is 1/4 of the full span SR780 Network Signal Analyzer... - Page 91 Watch Out For Windowing! The SR780 can display both the time record and the windowed time record. Most window functions taper off to zero at the start and end of the time record. If a transient signal occurs at the start of the time record, the corresponding windowed time record and FFT may not show anything because the window function reduces the transient to zero.
-
Page 92: Fft Windowing
The different types of windows trade off selectivity, amplitude accuracy, and noise floor. The SR780 offers many types of window functions - Uniform (no windowing), Flattop, Hanning, Blackman-Harris (BMH), Kaiser, Force and Exponential, and User Defined windows. - Page 93 The BMH window function is − ⋅ π + ⋅ π − ⋅ π 1 0 1 36109 0 39381 0 032557 SR780 Network Signal Analyzer...
- Page 94 DisplayB and the FFT of Ch1 uses the window of DisplayA, regardless of which display is showing the function. Simply un-link the [Window]<Window> entry and assign the Force window to DisplayA and the Exponential window to DisplayB. SR780 Network Signal Analyzer...
- Page 95 To switch back and forth between a User window and another window, keep using <Trace to Window>. Remember, window functions have a great deal of impact on the resulting FFT spectrum. A poorly designed window can result in significant measurement errors. SR780 Network Signal Analyzer...
-
Page 96: Fft Measurements
4. A triggered time record will always jitter by 1 sample. This jitter is removed in the computation of the phase of the spectrum relative to the trigger. Averaged and calibrated time records can be obtained using a User Math function (using inverse FFT). SR780 Network Signal Analyzer... - Page 97 There are two types of transfer function which differ in their averaging. <F2/F1> <F2/F1> = Avg( FFT2 / FFT1 ) where Avg( ) is the averaging selected in the [Average] menu. Both channels use the window selected in the [Window] menu. SR780 Network Signal Analyzer...
- Page 98 Sine waves appear as sine waves in auto correlation and square waves appear as triangles. Signals which do not repeat or are τ completely random (such as noise) appear only at = 0. SR780 Network Signal Analyzer...
- Page 99 Cross Correlation = invFFT( VecAvg( FFTu2 ) • conj( VecAvg( FFT1 ) ) ) where FFT1 is the windowed FFT of Channel 1, FFTu2 is the un-windowed FFT (uniform window) of Channel 2 and invFFT is an inverse FFT. SR780 Network Signal Analyzer...
- Page 100 However, ALL of the spectral information (up to the sampling rate/2.56) is preserved by the Nyquist theorem as long as the value of each sample is accurate. Amplitude calibration is performed in the frequency domain. Hence, the captured time data amplitudes are not calibrated. SR780 Network Signal Analyzer...
- Page 101 A User Function may not be selected as the measurement if it uses a Trace which is empty or which contains data taken in a different Measurement Group. See ‘User Math’ later in this section for more. SR780 Network Signal Analyzer...
-
Page 102: Views
Single channel phase is relative to the center of the time record for Uniform, BMH, Hanning, Flattop and Kaiser windows. For Force and Exponential windows, phase is relative to the start of the time record. For User windows, the Window Form is user SR780 Network Signal Analyzer... - Page 103 FFT frequency bins, the filters cause phase errors. Because these filters are very steep and selective, they introduce very large phase shifts for signals not exactly on a frequency bin. Use the SR780 source to generate exact bin frequencies whenever possible.
- Page 104 The marker moves sequentially through the frequency (time) points and can be linked to the frequency of the other display. Real measurement data, such as baseband time record, have zero phase. This view is entirely along the Y axis. SR780 Network Signal Analyzer...
-
Page 105: Fft Averaging
For a two channel measurement, the phase is relative between Channel 2 and Channel 1. As long as the signals of interest have stable relative phases, triggering is not required for vector averaging. Triggering is still required to isolate time records which contain the signals of interest. SR780 Network Signal Analyzer... - Page 106 Make sure that the number of averages is not so large as to eliminate changes in the data which might be important. SR780 Network Signal Analyzer...
-
Page 107: Real Time Bandwidth And Overlap
500 averages. The SR780, on the other hand, can make real time measurements at full span (102.4 kHz). This results in 256 measurements per second (on each display!). In fact, this is so fast, that the display can not be updated for each new measurement. - Page 108 These first 3 measurements have time records which contain data from before AND after the measurement was unsettled. These unsettled measurements are displayed in half intensity indicating that the SR780 Network Signal Analyzer...
- Page 109 If the measurement is triggered, then Time Record Increment is ignored. Time records always start with the trigger (with the specified Trigger Delays). The analyzer must be in Free Run Trigger Mode to use overlap processing. SR780 Network Signal Analyzer...
-
Page 110: Waterfall Display
Waterfall records are stored in waterfall memory. This memory is not retained when the power is off. Use the [Waterfall] <Memory Allocation> menu to allocate memory between the capture buffer, waterfall storage and the arbitrary source waveform. Waterfall memory must be allocated before waterfall storage may be used. SR780 Network Signal Analyzer... - Page 111 (back). This is reversed from how the display is scrolled while the measurement is running. A single record can be saved to a trace. A time slice ( history of a single X from all stored records) can also be saved to a trace. SR780 Network Signal Analyzer...
-
Page 112: Capture Buffer
This speeds up the display update so that it keeps up with the real time capture data but allows visual aliasing to occur. Once capture is complete, the display is redrawn showing the envelope of all points, eliminating any visual aliasing effects. SR780 Network Signal Analyzer... - Page 113 For example, 1 second of capture contains 256 full span FFT time records. Normal Speed playback at full span takes 1 second and updates the display only about 8 times during playback. SR780 Network Signal Analyzer...
- Page 114 The amplitude of the arbitrary output depends upon the amplitude of the captured data relative to the Input Range during capture. If the captured data was 100% of the Input Range, then an output amplitude of 100% will be 1 Vpk. SR780 Network Signal Analyzer...
-
Page 115: The Source
The Source 2-33 The Source The SR780 source provides a variety of test signals which allow the SR780 to measure the response of electronic, mechanical and acoustic devices, without the need for an external generator. In many cases, the SR780 source is better than an external source since it is synchronous with the input sampling. - Page 116 For Chirp, Burst Chirp, Burst Noise and Arbitrary, the External trigger can trigger the source output. The source can trigger on only the first trigger or on every trigger after a measurement is started as selected in the [Trigger] menu. The measurements are triggered normally in either case. SR780 Network Signal Analyzer...
-
Page 117: Octave Analysis
(132 bands) may be measured at one time. The exact centers are given by × × Center Frequency 1000 2 for n = -160 .. 43 SR780 Network Signal Analyzer... - Page 118 1/(sample rate). High frequency signals will appear distorted in the time record. However, ALL of the spectral information is preserved by the Nyquist sampling theorem as long as the value of each sample is accurate. SR780 Network Signal Analyzer...
- Page 119 Once in steady state, further changes in the average are detected only if they last for a sufficient number of measurements. Make sure that the integration time is not so large as to eliminate changes in the data which might be important. SR780 Network Signal Analyzer...
- Page 120 The Impulse bandwidth is DC-100kHz for 1 octave channel and DC-50kHz for 2 channels. To measure I, set the Averaging Type to Exponential, Linear or Equal Confidence and the Power Bin to Impulse. SR780 Network Signal Analyzer...
- Page 121 The last bin in the measurement displays the Total Power. The last bin is labeled as follows. Label Frequency Weighting uniform weighting A-Wt (input filter) A-Wt (User Math) B-Wt (User Math) C-Wt (User Math) undefined ‘Tu’ is shown whenever more than one type of weighting exists in the measurement. SR780 Network Signal Analyzer...
- Page 122 Center Frequency where n = 1, 3 or 12 (octave) ‘Settle’ is shown below the graph while settling takes place. Bands which are un-settled are displayed at half intensity in the graph. SR780 Network Signal Analyzer...
-
Page 123: Swept Sine Measurements
10 seconds to complete. The swept sine also took 400 points. Each point was averaged for 16 ms or 10 cycles, whichever was longer. The entire sweep also takes about 12 seconds. SR780 Network Signal Analyzer... - Page 124 [Average] menu. The source amplitude is set in the [Source] menu. Simply press the [Auto Range Ch1] and [Auto Range Ch2] keys to turn on Auto Ranging. Auto Ranging always tracks the input signals during a swept sine measurement. SR780 Network Signal Analyzer...
- Page 125 Swept Sine Measurements 2-43 The signal connections are the same as for an FFT transfer function. The SR780 measures Channel 2 response divided by Channel 1 as the transfer function. The input to the device under test is measured by Channel 1 (typically this is the source output) and the device output is measured by Channel 2.
- Page 126 Q. The Settle Time is also specified in both time and cycles of the source. Times are converted to cycles and the larger of the two specified cycles is used. The Integration and Settle Times are set within the [Average] menu. SR780 Network Signal Analyzer...
- Page 127 The span of a swept sine sweep is determined by the Start and Stop frequencies. The entire 102.4 kHz frequency range of the SR780 is available for swept sine measurements. Note that starting a sweep at DC is not possible. In fact, beware of starting at any frequency much less than 1 Hz since the Settle and Integration times are always a minimum of 1 cycle.
- Page 128 +30 dB, the source level is -30 dBV and where the attenuation is -80 dB, the source level increases to the Maximum Source Level (1.0 V in this case). The actual signal output from the device under test varies from 0 dBV to -80 dBV instead of 0 dBV to -110 dBV SR780 Network Signal Analyzer...
- Page 129 The Maximum Source Level is the largest allowed source amplitude. This is limited by the SR780 source output or the device under test input range. The Reference Upper and Lower limits are the allowable tolerances for the Reference Channel.
-
Page 130: Trace Storage
Trace in its equation, then that Trace cannot be changed to data from a different Measurement Group. For example, if an FFT User Function using Trace1 is being displayed, you cannot recall octave data from disk to Trace1. SR780 Network Signal Analyzer... -
Page 131: User Math Functions
The conversion of units to dB is either 20log(units) or 10log(units) as selected by the dB Conversion assigned to each function. Input Transducer Units are used in the calculation of User Functions. Operands which use an input with Transducer Units On is scaled by the appropriate EU/V. SR780 Network Signal Analyzer... - Page 132 In general, the length of a User Function is determined by the length of the longest operand array. Operations between operand arrays are performed on a point by point basis, starting at the beginning of each array. Operands of different lengths (400 point SR780 Network Signal Analyzer...
- Page 133 A Trace operand uses the span of the measurement which is stored in the Trace. The DC (0 Hz) bin is filled with 1/16 of the value of the first point (to avoid divide by zero). SR780 Network Signal Analyzer...
- Page 134 Editing a function which is currently being displayed is allowed. In this case, Traces which do not contain compatible measurements are not allowed as operands. User Functions have a maximum length of 31 operators plus operands. User Functions cannot use another User Function as an operand. SR780 Network Signal Analyzer...
- Page 135 IFFT( FFTu(N) x Conj( FFT(N) ) ) Peak Hold or RMS averaging: IFFT( VecAvg( FFTu(N) x Conj( FFT(N) ) ) ) Vector averaging: IFFT( VecAvg( FFTu(N) ) x Conj( VecAvg( FFT(N) ) ) ) In all cases, the VecAvg is always performed. SR780 Network Signal Analyzer...
- Page 136 IFFT( VecAvg( FFTu(2) ) x Conj( VecAvg( FFT(1) ) ) ) In all cases, the VecAvg is always performed. Octave Group OctN = Oct(N) Swept Sine Group SpecN = Spec(N) Cross Spec = Conj( Spec(1) ) x Spec(2) Trans Func = Spec(2) / Spec(1) SR780 Network Signal Analyzer...
-
Page 137: Signal Inputs
Signal Inputs 2-55 Signal Inputs The Input Range on the SR780 varies from a maximum of 34 dBV full scale to a minimum of -50 dBV full scale. A signal which exceeds the current input range will cause the OverLoad indicator to appear at the top of the screen. A signal which exceeds the maximum safe range (35 dBVpk) will turn on the Hi V indicator and set the range to 34 dBV. - Page 138 Hz of noise! A signal source impedance of 6 k has a Johnson noise equal to the SR780’s input noise. To determine the overall noise of multiple noise sources, take the square root of the sum of the squares of the individual noise figures.
- Page 139 Transducer Units require a transducer which is linear over the frequency range of interest. Measurements of inputs which are assigned units of acceleration, velocity or displacement may be displayed with any of these three units using Transducer Convert in the [Display Options] menu. SR780 Network Signal Analyzer...
-
Page 140: Input Connections
1 part in 30,000. Even with a CMRR of 90 dB, a 1 V common mode signal behaves like a 3 µV differential signal! The CMRR decreases by about 6 dB/octave (20 dB/decade) starting at around 1 kHz. SR780 Network Signal Analyzer... - Page 141 AC signal of interest. In this case, the input range may be limited to accommodate the large DC offset while sacrificing signal to noise in the measurement of the AC signal. If the signal frequency exceeds 0.16 Hz, use AC coupling if possible. SR780 Network Signal Analyzer...
-
Page 142: 2-60 Intrinsic Noise Sources
All of these noise sources are incoherent. The total random noise is the square root of the sum of the squares of all the incoherent noise sources. Thus, the largest noise source easily dominates all others in determining the noise floor of the measurement. SR780 Network Signal Analyzer... -
Page 143: External Noise Sources
400 pA (at 60 Hz). This small noise current can be larger than the signal current. If the noise source is at a higher frequency, the coupled noise will be even greater. SR780 Network Signal Analyzer... - Page 144 2 coaxial cables used in differential connections. 3) Using magnetic shielding to prevent the magnetic field from crossing the area of the signal path. 4) Measuring currents, not voltages, from high impedance sources. SR780 Network Signal Analyzer...
- Page 145 Mechanical vibrations in the cable which cause a dC/dt will give rise to a current in the cable. This current affects the measured signal. Some ways to minimize microphonic signals are: 1) Eliminate mechanical vibrations near the signal path. SR780 Network Signal Analyzer...
- Page 146 2) Use a compensation junction, i.e. a second junction in reverse polarity which generates an emf to cancel the thermal potential of the first junction. This second junction should be held at the same temperature as the first junction. SR780 Network Signal Analyzer...
- Page 147 OverLoads 3-17 Ref to Trace ([Alt] [Active Display]) 3-30 Input Configurations 3-17 Trace to Ref ([Alt] [Link]) 3-31 3-17 Display to Trace ([Alt] [Print Screen]) 3-31 ArmWait/Trig-wait/Trig/Acquire 3-17 Trace to Display ([Alt] [Help/Local]) 3-31 Run/Pause/Done 3-18 SR780 Network Signal Analyzer...
- Page 148 3-33 [Span Up] 3-33 [Span Down] 3-33 [Marker Ref] 3-34 [Display Ref] 3-34 [Marker Center] 3-34 [Marker Max] 3-35 [Marker Min] 3-35 [Show Setup] 3-35 Macros 3-36 Keypad Macros 3-36 Choosing From Lists 3-36 Menus 3-36 SR780 Network Signal Analyzer...
-
Page 149: Overview
Figure Chapter 3 -1 Front Panel Power Switch The power switch is located on the rear panel. The SR780 is turned on by depressing the upper half of the power switch. The green power LED on the front panel indicates that the unit is powered. - Page 150 A complete description of the keys follows. Softkeys The SR780 has a menu driven user interface. The MENU keys each display a menu of softkeys. The softkeys are at the right of the video display and have different functions depending upon the displayed menu.
- Page 151 (DS/HD) have a capacity of 1.44M bytes and double sided, double density disks (DS/DD) have a capacity of 720k bytes. The disk format is DOS compatible. Use the [Disk] menu to format a disk or access disk files. SR780 Network Signal Analyzer...
-
Page 152: Front Panel Connectors
An IBM PC or XT compatible keyboard may be attached to the keyboard connector. Most keyboards have a switch on the back to select PC/XT or 8088 mode. The SR780 can be controlled from this keyboard according to the table below. - Page 153 Alt-5 through Alt-8 (bottom row) Number Keys 0 through 9 Knob (slow) Left and Right arrow Knob (fast) Up and Down arrow Escape Enter Enter or Return The keyboard should only be connected when the power is off. SR780 Network Signal Analyzer...
-
Page 154: Rear Panel Connectors
Do not attempt to service or adjust this instrument while it is plugged into a live outlet. Line Voltage Selection The SR780 operates from a 100V, 120V, 220V, or 240V nominal AC power source having a line frequency of 50 or 60 Hz. Before connecting the power cord to a power source, verify that the LINE VOLTAGE SELECTOR card, located in the rear panel fuse holder, is set so that the correct AC input voltage value is visible. - Page 155 B output from the preamp (preamp ground) may be connected to the B input on the SR780. In this case, use A-B as the Input Mode. Be sure to twist the A and B cables together to reduce noise pick-up.
- Page 156 The SR780 does not compensate for the gain of the preamp. Both preamps operate at their highest gain. Measurements made by the SR780 need to be divided by the gain of the preamp. The SR550 has a gain of 10 and the SR552 has a gain of 100.
-
Page 157: Screen Display
Many instrument parameters are set independently for each display. The display format is selected in the [Display Options] menu. The display shown above is the Dual display format. The [Active Display] key toggles between the two displays. DisplayA is always on top. SR780 Network Signal Analyzer... - Page 158 Octave measurements show unsettled octave bins in half intensity. Each octave bin is displayed in half intensity until it is settled. The settling time of each bin is related to the 1/center frequency and the lowest bins take the longest time to settle. SR780 Network Signal Analyzer...
- Page 159 The Limit Test Result, either ‘Pass’ or ‘Fail’ is displayed if limit testing is on for this display. The Waterfall Storage Count shows how many measurement records are currently stored in the waterfall buffer. This count is not displayed when Waterfall Storage is Off. SR780 Network Signal Analyzer...
- Page 160 When the display is expanded on the horizontal axis, the graph labels reflect the displayed data, not the actual measurement span or time. Expanded displays show the ‘Expand’ indicator. Marker Marker located at Max Marker Region defined by solid vertical lines. Figure Chapter 3 -7 Marker Region SR780 Network Signal Analyzer...
- Page 161 This arises in Swept Sine sweeps with Auto Resolution On when some frequency points are not measured. Active Display The active display is indicated by the highlighted Marker Position bar. Use [Active Display] to toggle the active display. SR780 Network Signal Analyzer...
- Page 162 A softkey menu box which is shown in gray is not available in the current measurement. Also, the measurement softkeys for an ‘Off-Line’ display are shown in gray indicating that they may not be changed. Each menu is described at length in Chapter 4. SR780 Network Signal Analyzer...
-
Page 163: Status Indicators
This indicator reads ‘Trig-wait’ while waiting for a trigger. Once triggered, the indicator flashes ‘Trig’ and then displays ‘Acquire’ while the time record is being acquired. If the Trigger Mode is Auto Arm, the indicator returns to ‘Trig-wait’ after the time record is SR780 Network Signal Analyzer... - Page 164 Factors which affect the processor’s ability to run real time include the measurement type, averaging and source type. See also Real Time Bandwidth and Overlap. This indicator is replaced by the Capture/Playback Progress indicator when capture (playback) is in progress. SR780 Network Signal Analyzer...
- Page 165 When selecting from a list of choices with the knob, [Enter] will enter the new selection. When entering a numeric value, [Enter] will enter the new value. Whenever the ‘Enter’ indicator at the top of the screen is on, [Enter] is required to enter the new choice or entry. SR780 Network Signal Analyzer...
- Page 166 ‘ERR’ flashes whenever a computer interface error occurs, such as illegal command or out of range parameter is received. This indicator is on whenever a GPIB Service Request is generated by the SR780. SRQ stays on until a serial poll is completed.
- Page 167 Status Indicators 3-21 SR780 Network Signal Analyzer...
- Page 168 ‘Record’ indicates that a keypad macro is being recorded. Use [Macro Rec] to start recording. ‘Play’ indicates that a macro is being played. Use [Play Macro] to playback a stored macro. See ‘Macros’ later in this chapter for more. SR780 Network Signal Analyzer...
-
Page 169: Keypad
Use the alternate keys to enter alphabetic characters and to access secondary functions. The [0]...[9], [.], [-], [<-], [Exp] and [Alt] keys have the same definition in both modes. Press [Alt] again to return to the normal keypad if necessary. SR780 Network Signal Analyzer... -
Page 170: Menu Keys
3-24 Keypad Menu Keys All operating parameters of the SR780 are grouped into sixteen function menus. The menu keys select a menu of parameters to display next to the ten softkeys. The softkeys either choose a submenu or select a parameter and place it in the entry field at the top of the screen (for numeric entry or knob adjustment). -
Page 171: Entry Keys
Window immediately and displays the selection in the highlighted menu box. This allows the effect of various choices to be compared while making the selection. Press [Enter], the same softkey, another softkey or a menu key to un-highlight the menu box when finished. SR780 Network Signal Analyzer... -
Page 172: Numeric Values
Changes are effective immediately while the value is being adjusted. Press [Enter], the same softkey, another softkey or a menu key to un-highlight the menu box when finished. Some entry fields allow only knob adjustment or only numeric entry. SR780 Network Signal Analyzer... -
Page 173: Control Keys
If the Capture Mode is Continuous, once capture is started, it continues indefinitely and fills the capture buffer in a circular fashion. In this case, press [Stop Capture] to halt capture with the most recently acquired data stored in the buffer. SR780 Network Signal Analyzer... - Page 174 Span and Start frequency may be linked while the Measurement is unlinked. This allows the two displays to have different measurements over the same frequency span. Since the Spans are linked, changing the Span does not require separate entries for each display. Command: ACTD (?) i SR780 Network Signal Analyzer...
- Page 175 Press [Help/Local] again for more information on the help system. When a host computer places the unit in the REMOTE state, no keypad or knob input is allowed. To return to front panel operation, press the [Help/Local] key. SR780 Network Signal Analyzer...
- Page 176 [Ref to Trace] saves the active display’s Reference Display (if it is on) to a Trace buffer. Select a Trace # (1..5) with the knob and press [Enter] to save the Reference Display to the Trace. SR780 Network Signal Analyzer...
- Page 177 When the Display is returned to Live, the measurement, frequency span, averaging and window all return to the settings in effect before the data was recalled and the live measurement returns to the display. Command: RCTR d, i SR780 Network Signal Analyzer...
-
Page 178: Function Keys
Auto Range responds to all frequencies present at the input (except those attenuated by AC coupling), not just those within the measurement span. [Link] [Auto Range Ch1] toggles the Input Ranging of both channels. Command: A1RG (?) {i} SR780 Network Signal Analyzer... - Page 179 In Octave group, [Span Down] moves the octave measurement span of both displays down by an octave. [Span Down] affects each display independently if their frequency parameters are unlinked. [Span Down] has no affect for Swept Sine measurements. SR780 Network Signal Analyzer...
- Page 180 0 to 102.4(100.0) kHz, then the Span is decreased to the largest span which allows the Marker frequency to be the center. [Link] [Marker Center] adjusts the span of the active display and sets the Span of the inactive display to match. Command: MKCN d SR780 Network Signal Analyzer...
- Page 181 [Link] [Marker Min] moves the marker to the location of the minimum within both displays. Command: MKMN d [Show Setup] [Show Setup] enters the Help system and displays the measurement setup and system settings. Press [0] to exit Help and return to the measurement displays. SR780 Network Signal Analyzer...
-
Page 182: Macros
Thus, do not start a macro with a softkey press since the menu which is displayed at playback may not be the one displayed when the macro was recorded. Always start a macro with a menu key press if you want to change parameters within a menu. SR780 Network Signal Analyzer... - Page 183 Chapter 4 Menus The SR780 has a menu driven user interface. All operating parameters of the SR780 are grouped into sixteen menus. The Menu keys each display a menu of softkeys. The softkeys at the right of the display change depending upon the displayed menu.
- Page 184 Modify Band 4-48 Input Source 4-71 Band Exclude 4-48 Analog Input Menu 4-71 Band Ratio Mode 4-49 Ch1 Input Mode 4-72 Band Power 4-49 Ch1 Grounding 4-72 Band Ratio 4-49 Ch1 Coupling 4-72 Ch1 Input Range 4-72 SR780 Network Signal Analyzer...
- Page 185 4-98 Paused Drawing 4-125 Record to Trace 4-126 Octave Average Menu 4-99 Slice to Trace 4-126 Averaging Type 4-99 Integration Time 4-100 Capture Menu 4-127 Confidence 4-101 Capture Channels 4-127 Power Bin 4-101 Capture Mode 4-127 SR780 Network Signal Analyzer...
- Page 186 Del Cur Dir 4-162 Std. Dev. (Display B) 4-141 Format Floppy 4-162 Exceedance Statistics Menu Output Menu 4-163 Start Index Hard Copy Button 4-163 Stop Index Bitmap/Printer 4-164 Exceedance Pct Bitmap Area 4-164 Calculate Excd Vector/Plotter 4-164 SR780 Network Signal Analyzer...
- Page 187 4-176 Done Volume 4-176 Audible Overload 4-177 Screen Saver 4-177 Screen Saver Delay 4-177 Frequency Format 4-177 Node Info Prompt 4-178 System Date/Time Menu 4-179 Time 4-179 Date 4-179 System Diagnostics Menu 4-180 Keypad Test 4-180 SR780 Network Signal Analyzer...
- Page 188 Menus SR780 Network Signal Analyzer...
-
Page 189: Frequency Menus
The two displays can have different FFT Spans. This entry field can be linked to both displays using the [Link] key. If either display is a two channel measurement (Transfer Function, Cross Spectrum, Cross Correlation Or Coherence), then the Spans are automatically linked. Command: FSPN (?) d {, i} SR780 Network Signal Analyzer... - Page 190 256 (250) Hz, 3.906 (4.00) ms, 0.0 Hz, and 51.2 (50.0) kHz respectively. FFT Lines Select the FFT Resolution of the active display [100, 200, 400, 800 lines]. Changing the FFT Resolution does not change the Span. Instead, the Acquisition Time is changed (FFT Resolution/Span). SR780 Network Signal Analyzer...
- Page 191 Enlarging the frequency Span may change the Start frequency if the new measurement would extend below 0 Hz or above 102.4 (100.0) kHz. If the Measurement is a Correlation, then the Start frequency is always 0 Hz (baseband). SR780 Network Signal Analyzer...
- Page 192 [Link] key. If either display is a two channel measurement (Transfer Function, Cross Spectrum Or Cross Correlation), then the End frequencies are automatically linked. If either measurement is Cross-Correlation, then the End frequency of both displays is set to the Span. SR780 Network Signal Analyzer...
- Page 193 FFT Frequency Menu 4-11 Command: FEND (?) d {, f} SR780 Network Signal Analyzer...
-
Page 194: Octave Frequency Menu
[Link] key. Linking is only allowed if both displays have the same Octave Resolution. Command: OHIB (?) d {, f} Lowest Band Set the Lowest Band for the active display. The limits for the Lowest Band are determined by the Octave Resolution. SR780 Network Signal Analyzer... - Page 195 Channels affects the Measurements of both displays. If 2 Octave Channels are selected, then both inputs may be analyzed. The Measurements of both displays are independent. The Highest Band for all Octave Resolutions is decreased by 2 in this case. SR780 Network Signal Analyzer...
- Page 196 Measurement or input of the other display if necessary. User Functions which use both inputs may not be measured. Choosing 1 Octave Channel may change the current Measurements so that both displays use the same input. Command: OCHN (?) d {i} SR780 Network Signal Analyzer...
-
Page 197: Swept Sine Frequency Menu
The Stop frequency is usually greater than the Start frequency. If the Stop frequency is less than the Start frequency, then the sweep is downward from the Start frequency. If the Stop frequency is changed during a sweep, the sweep will be reset. Command: SSTP (?) d {, f} SR780 Network Signal Analyzer... - Page 198 (with no skipping). The sweep continues from this point, speeding up if allowed and slowing down when required. This ‘fills’ in skips in the sweep which vary by more than the Slower Threshold. SR780 Network Signal Analyzer...
- Page 199 Size is reached. This speeds up the sweep in regions where the response is flat (varies less than the Faster Threshold). Measurements which differ by more than the Faster Threshold on EITHER channel, but less than the Slower Threshold on BOTH channels, maintain the present sweep speed. SR780 Network Signal Analyzer...
- Page 200 Generally, the Slower Threshold should be set to less than half of the smallest desired feature size (relative to the region before the feature). A good rule is to set the Slower Threshold at twice the Faster Threshold. Command: SSLO (?) d {, i} SR780 Network Signal Analyzer...
-
Page 201: Display Setup Menu
Change the Input Source to Analog to change the Measurement Group. The choice of Measurement Group changes the [Frequency], [Average] and [Source] menus. Command: MGRP(?) d {, i} Measurement (FFT) Select the Measurement of the active display when the Measurement Group is FFT. SR780 Network Signal Analyzer... - Page 202 A triggered time record will always jitter by 1 sample. This jitter is removed in the computation of the phase of the spectrum relative to the trigger. Averaging does not affect the time record. Averaging is performed on the FFT spectrum and not on the time data. SR780 Network Signal Analyzer...
- Page 203 Avg( ) is the averaging selected in the [Average] menu. The transfer function contains both magnitude and phase information. The phase is the relative phase (at each frequency) between the two channels. Vector averaging can be SR780 Network Signal Analyzer...
- Page 204 [Average] menu. Averaging Off Auto Correlation = invFFT( FFTu N • conj( FFT N ) ) Peak Hold or RMS Averaging On Auto Correlation = invFFT( VecAvg( FFTu N • conj( FFT N ) ) ) SR780 Network Signal Analyzer...
- Page 205 This is because the FFT models the time domain as a single time record repeating itself τ over and over. Computing the correlation over a greater than half of the time record length will result in ‘wrap around’ errors where data starts to repeat itself. To avoid this, SR780 Network Signal Analyzer...
- Page 206 A User Function may not be selected as the measurement if it uses a Trace which is empty or which contains data taken in a different Measurement Group. See ‘User Math Functions’ in Chapter 2 for more. SR780 Network Signal Analyzer...
- Page 207 Sample Rate) is preserved by the Nyquist theorem as long as the value of each sample is accurate. Amplitude calibration is performed in the frequency domain. Hence, the captured time data amplitudes are not calibrated. SR780 Network Signal Analyzer...
- Page 208 Transfer Function The swept sine transfer function (sometimes called frequency response) is a two channel measurement defined as Transfer Function = Spec2 / Spec1 SR780 Network Signal Analyzer...
- Page 209 ) where x is the real part and y is the imaginary part. The Y axis of the display is linear in scaling. Real Part Real Part view graphs the real part of the measurement data. The Y axis of the display is linear in scaling. SR780 Network Signal Analyzer...
- Page 210 Because these filters are very steep and selective, they introduce very large phase shifts for signals not exactly on a frequency bin. Use the SR780 source to generate exact bin frequencies whenever possible.
- Page 211 Select the Units of the active display View. The choice of units is limited to those which are appropriate for the Measurement and View. dBspl is only available if the EU Label for the measured input is Pascals. SR780 Network Signal Analyzer...
- Page 212 Midpoint (center reference) to the current Marker X Position. The Y Maximum and Y Minimum are adjusted to give the effect of vertical zooming. Entering a scale numerically leaves the Y Min (bottom reference) unchanged. The Y Max and Y Mid are adjusted. SR780 Network Signal Analyzer...
- Page 213 Set the Y/Division scale of the active display when the view is Nyquist or Nichols plot. This value is the vertical scale of the graph. The knob adjusts the scale in a 1-2-5-10 sequence. Changing the scale does not change the Y Center location. SR780 Network Signal Analyzer...
- Page 214 Zoom is not allowed when the X axis is logarithmic or when the View is polar (Nyquist or Nichols plot). The two displays can have different Zoom values when expanded. This entry field can be linked to both displays using the [Link] key. Command: XZOM (?) d {, i} SR780 Network Signal Analyzer...
-
Page 215: Display Options Menu
A single display may be taken Off-Line while the other display is still Live. This allows comparison of live results with a previous result. This is unlike the [Pause/Cont] key which pauses ALL measurements. Command: DISP (?) d {, i} Format Select the screen Display Format [Single or Dual]. SR780 Network Signal Analyzer... - Page 216 Changing the number of Grid Divisions changes the vertical scaling (Y/div) and leaves the display references unchanged. If the view is polar, the horizontal scaling (X/div) is also changed. Change the scaling in the [Display Setup] menu. SR780 Network Signal Analyzer...
- Page 217 ω to integrate over time. The two displays have their own Transducer Conversion. This entry field can be linked to both displays using the [Link] key. Command: TDRC (?) d {, i} SR780 Network Signal Analyzer...
- Page 218 The two displays have their own d/dx Window. The same function may viewed in the two displays with different d/dx windows. This entry field can be linked to both displays using the [Link] key. Command: DDXW (?) d {, x} SR780 Network Signal Analyzer...
-
Page 219: Marker Menu
Octave measurement group can use Normal and Band modes only. Swept Sine measurement group can only use Normal mode. Each display has its own Marker Mode. This entry field can be linked to both displays using the [Link] key. Command: MKMD (?) d {, i} SR780 Network Signal Analyzer... - Page 220 In addition to the Fundamental Marker, a number of sidebands (discrete frequencies) are identified by small triangular Sideband Markers. The Marker Position Display can show the position of the Fundamental or of a single Sideband. SR780 Network Signal Analyzer...
- Page 221 Choose the 2/(1+2) ratio mode to measure THD+N (power with fundamental notched out/total power including fundamental). Band Marker is only available for frequency domain FFT and Octave measurements. Band Marker is not available for Octave measurement groups. SR780 Network Signal Analyzer...
-
Page 222: Normal Marker Menu
Marker is the small square which Seeks the Max, Min or Mean of the data within the Marker Region. Each display has its own Normal Marker Width. This entry field can be linked to both displays using the [Link] key. Command: MWID (?) d {, i} SR780 Network Signal Analyzer... - Page 223 Ref] to reset the Marker Offset in the new units. Pressing [Marker Ref] changes from Off to Rel. and sets the Marker Offset to the current Marker Position. [Marker Ref] again changes from Rel. back to Off. SR780 Network Signal Analyzer...
- Page 224 X position in absolute units. Each display has its own X Rel Mode. This entry field can be linked to both displays using the [Link] key. Command: MXRL (?) d {, i} SR780 Network Signal Analyzer...
-
Page 225: Harmonic Marker Menu
Of Harmonics. The second harmonic (2xfundamental) is identified as #1, etc. For Sideband Marker, the value ranges from 0 (Fundamental) to plus and minus the Number Of Sidebands. The first lower sideband is identified as #-1, the first upper sideband is #1, etc. SR780 Network Signal Analyzer... - Page 226 This menu box displays the Total Harmonic Power of the active display. The harmonic power is the sum of the squared magnitudes of the harmonics identified with a Harmonic Marker. The result is shown in Vrms. To convert to power, square this result. Command: HPWR ? d SR780 Network Signal Analyzer...
-
Page 227: Sideband Marker Menu
Sideband Separation determines the location of these Sideband Markers relative to the fundamental. Only those sidebands within the measurement span which are identified by the Sideband Markers contribute to the Sideband Power calculations. The sideband identification SR780 Network Signal Analyzer... - Page 228 This menu box displays the Sideband Ratio of the active display. The sideband power is the sum of the squared magnitudes of the sidebands. Only those sidebands within the measurement span which are identified by Sideband Markers contribute to the calculation. SR780 Network Signal Analyzer...
- Page 229 Only those sidebands within the measurement span which are identified by Sideband Markers contribute to the calculation. The Sideband Power is displayed in Vrms. To convert to power, square this result. Command: SPWR ? d , i SR780 Network Signal Analyzer...
-
Page 230: Band Marker Menu
For example, to measure THD+N, use the Lower (1) band to define a small region around the fundamental and the Upper (2) band to define the total bandwidth of interest. Exclude ‘1from2’ so the Upper (2) band does not measure the fundamental. Choose the 2/(1+2) SR780 Network Signal Analyzer... - Page 231 Band Ratio This menu box displays the band ratio, either 2/1 or 2/(1+2) as selected by the Band Ratio Mode, for the active display. The result is shown in % and dB. Command: BRAT (?) d, i SR780 Network Signal Analyzer...
-
Page 233: Source Menus
The output is the sum of two tones (sine waves) plus the offset. To generate a single tone, set the amplitude of one of the tones to zero. The frequencies should be exact bin frequencies of the FFT. This eliminates windowing effects in the measured amplitude and phase. SR780 Network Signal Analyzer... - Page 234 Since the signal is random, windows are always required when making FFT measurements using the noise source. In Octave group, the burst period is not linked to a display but is specified in time. The bandwidth is always full bandwidth. SR780 Network Signal Analyzer...
- Page 235 If the Arbitrary source is selected, the triggered FFT measurement phase is stable only if the input signals are derived from the triggered source output. Turn the source off (or set it to Sine) when making triggered measurements of external signals (not the source). SR780 Network Signal Analyzer...
- Page 236 4-54 Source Menu Command: STYP (?) {i} SR780 Network Signal Analyzer...
-
Page 237: Sine Source Menu
Note that the sum of the amplitudes of Tone 1, Tone 2 and the absolute value of the offset cannot exceed 5 V. Command: S1AM (?) {x} SR780 Network Signal Analyzer... - Page 238 Note that the sum of the amplitudes of Tone 1, Tone 2 and the absolute value of the offset cannot exceed 5 V. Command: S2AM (?) {x} SR780 Network Signal Analyzer...
-
Page 239: Chirp Source Menu
Source Trigger will synchronize the FFT time record with the chirp waveform. With External Trigger, the chirp waveform is triggered along with the FFT time record. Set the Trigd Source Mode to Continuous to trigger the source with every time record. SR780 Network Signal Analyzer... - Page 240 Select which display sets the time record and frequency span of the chirp. If the other display has a different span, the chirp will not be appropriate for that span. Burst Chirp is a percentage of the Source Display FFT time record length. Command: CSRC (?) {i} SR780 Network Signal Analyzer...
-
Page 241: Noise Source Menu
102 kHz. The spectrum of pink noise appears flat in octave analysis. BandLimited White Bandlimiting restricts the noise bandwidth to the measurement span of the Source Display. Bandlimited noise is available only for the FFT Measurement Group. Command: NTYP (?) {i} SR780 Network Signal Analyzer... - Page 242 Select which display sets the bandwidth for bandlimited noise. Burst Noise is a percentage of the Source Display FFT time record length. The noise output is continuous for Octave Analysis. Command: CSRC (?) {i} Source Period Set the Burst Period for noise in Octave group [4 ms..1ks]. SR780 Network Signal Analyzer...
- Page 243 Source trigger outputs a noise burst every source period. Free Run Trigger Mode outputs a noise burst every source period. Do not use Ch1 or Ch2 input trigger since the output will not start until a trigger is received. Command: NPER (?) {x} SR780 Network Signal Analyzer...
-
Page 244: Arbitrary Source Menu
Select the Arbitrary Source Play Rate. The Play Rate can be 1, 1/2, 1/4, 1/8, ... times the maximum sampling rate. The maximum sampling rate is 262.1 kHz when the FFT Base Frequency is 102.4 kHz and 256 kHz when the FFT Base Frequency is 100.0 kHz OR the Measurement Group is Octave. SR780 Network Signal Analyzer... - Page 245 The Arbitrary waveform memory can be loaded from a stored trace, via the computer interfaces or from a disk file. The Capture buffer is filled by capturing an input signal. Command: ASRC (?) {i} More Display the Arbitrary Source Settings menu. Press <Return> for the main [Source] menu. SR780 Network Signal Analyzer...
- Page 246 The Source Length is always set to a 2 kPoint (2048 points) increment. If the marker position is to the left of the Source Start, then the Source Length is set to the minimum (2 kPts). SR780 Network Signal Analyzer...
- Page 247 2 kPoints is reached. This can cause discontinuities if the trace is not continuous from its end to its beginning. If this source is measured with an FFT time record equal to the trace length (in time), then windowing should solve this problem. SR780 Network Signal Analyzer...
- Page 248 The amplitude of the Arbitrary Waveform is normalized to the maximum value in the Trace. The largest trace value is considered full scale (100% amplitude = 1V). Be sure to set the Play Rate to the appropriate value to reproduce the frequencies in the trace correctly. Command: TARB i SR780 Network Signal Analyzer...
-
Page 249: Swept Sine Source Menu
Level Reference is Off. The swept sine source turns off whenever there are no measurements being made. This is before the sweep is started, at the end of a single sweep or while a sweep is paused. If SR780 Network Signal Analyzer... - Page 250 Set the Source Ramp Rate [0.001 V/s .. 500 V/s]. The Source Ramp Rate is the rate at which the source amplitude changes when Source Ramping is On. If Source Ramping is Off, source amplitude changes are made instantly. SR780 Network Signal Analyzer...
- Page 251 The Reference Lower Limit may be changed during a sweep. Command: SSLL (?) {x} Maximum Source Level Set the Maximum Source Level [0 mV .. 5000 mV]. This parameter is adjustable only if Auto Level Reference is set to Channel 1 or Channel 2. SR780 Network Signal Analyzer...
- Page 252 The Maximum Source Level is the largest allowed source amplitude. This is limited by the SR780 source output or the device under test input range. If the Reference Lower Limit requires a source amplitude greater than the Maximum Source Level, then the source amplitude is set to the Maximum Source Level.
-
Page 253: Input Menu
Both displays use the same Input Source for their measurements. The Analog/Playback indicator shows the input source at the top of the screen. Command: ISRC (?) {i} Analog Input Menu When the Input Source is Analog, this menu configures the two front panel inputs. SR780 Network Signal Analyzer... - Page 254 The Input Range varies by 2 dB steps. The Input Range indicator shows the current range at the top of the screen. Pressing this softkey turns off Ch1 Auto Range. SR780 Network Signal Analyzer...
- Page 255 ICP coupling connects a 5 mA current source (26 VDC open circuit) to the center conductor of the A input connector. This supply powers ICP accelerometers. The signal is AC coupled from the center conductor. Set the Input Mode to A (not A-B). Command: I2CP (?) {i} SR780 Network Signal Analyzer...
- Page 256 The Input Range varies by 2 dB steps. The Input Range indicator shows the current range at the top of the screen. Pressing this softkey turns off Ch2 Auto Range. Command: I2RG (?) {i} SR780 Network Signal Analyzer...
- Page 257 The A-Weighting filter simulates the hearing response of the human ear and is often used with Octave Analysis measurements. The input A-Weighting filter conforms to ANSI standard S1.4-1983. A-, B- and C- Weighting functions are also available as operators in User Math functions. Command: I1AW (?) {i} SR780 Network Signal Analyzer...
- Page 258 Select the AutoRange Mode for the Ch2 input [Normal, Tracking]. This mode only applies when Ch2 Auto Range is on. In Normal Mode, only overload causes the Input Range to change. The Input Range only moves up. SR780 Network Signal Analyzer...
- Page 259 To avoid disrupting a lengthy measurement, turn Auto Offset Off. A warning message is displayed 15 seconds before an Auto Offset calibration is performed. Pressing [<-] (backspace) will abort the scheduled calibration. Command: IAOM (?) {i} SR780 Network Signal Analyzer...
- Page 260 Units On or Off for one input channel automatically forces the other channel to follow. In this case, if Engineering Units are On, the EU/Volt scaling of both inputs is displayed along the vertical axis (Ch1 above Ch2). SR780 Network Signal Analyzer...
- Page 261 EUs at Marker Calculate the EU/Volt scale factor for either the Ch1 or Ch2 input based upon the marker reading in the active display. Enter the desired calibrated value for the marker reading (in the display units). SR780 Network Signal Analyzer...
- Page 262 Label when Engineering Units are On and USER is chosen for the EU Label. The two displays have their own User Label. This entry field can be linked to both displays using the [Link] key. Command: EU1U (?) {s} or EU2U (?) {s} SR780 Network Signal Analyzer...
-
Page 263: Playback Input Menu
The corresponding playback time is displayed as well. Both channels playback the same Playback Length. Command: ILEN (?) {i} Set Left Edge The active display must be a Capture Buffer measurement for this key to be active. SR780 Network Signal Analyzer... - Page 264 Normal playback is limited to the real time limitations of the equivalent real time analog input measurement. Not all time records are displayed during Normal playback though all time records contribute to averaged measurements. For example, 1 second of capture contains 256 full SR780 Network Signal Analyzer...
- Page 265 When the playback is in Octave Group, playback is always Normal Speed. The Capture Progress indicator at the top of the screen shows the playback progress through the buffer. Both channels playback with the same Playback Speed. Command: ISPD (?) {i} SR780 Network Signal Analyzer...
- Page 266 4-84 Playback Input Menu SR780 Network Signal Analyzer...
-
Page 267: Trigger Menu
For FFT measurements, each time record requires the trigger to be re-armed. Triggers are ignored unless measurements are started (with [Start/Reset]) and the trigger is armed. Triggers are ignored while paused. SR780 Network Signal Analyzer... - Page 268 The trigger detector requires a minimum signal amplitude of 4% of the Input Range (200 mV for External). For Ch1 or Ch2 internal trigger, the signal must exceed -28 dBfs in order to trigger. Internal trigger is detected after the anti-aliasing filter (if On). Command: TLVL (?) {i} SR780 Network Signal Analyzer...
- Page 269 When a large trigger delay is used, the display may update slower since the acquisition time for each record (time record length plus trigger delay) is noticeably long. Auto Arm Trigger Mode re-arms the trigger after both FFT displays have completed processing their time records. Command: TDLB (?) {i} SR780 Network Signal Analyzer...
- Page 270 For FFT measurements, each time record requires the trigger to be re-armed. For octave and swept sine measurements, the first trigger after arming starts the measurement and subsequent triggers are ignored. Command: TARM SR780 Network Signal Analyzer...
- Page 271 Use Auto Arm Trigger Mode with since unwanted triggers are not a problem. For FFT measurements, each time record requires a trigger. For octave and swept sine measurements, the first trigger after arming starts the measurement and subsequent triggers are ignored. Command: TMAN SR780 Network Signal Analyzer...
- Page 272 4-90 Trigger Menu SR780 Network Signal Analyzer...
-
Page 273: Average Menus
Time records are not averaged. The [Start/Reset] key resets the current average and starts a new average. The [Pause/Cont] key pauses the average in progress. Pressing [Pause/Cont] again will continue the average from where it was paused. SR780 Network Signal Analyzer... - Page 274 Log Magnitude View is normally used with rms averaged measurements. Since rms averaging involves squared values, the real and imaginary parts of the average are always positive. The phase of an rms averaged measurement is limited to the first quadrant (0-90 deg). SR780 Network Signal Analyzer...
- Page 275 Continuous if the Averaging Mode is Peak Hold. The [Start/Reset] key resets the current average and starts a new average. The [Pause/Cont] key pauses the average in progress. Pressing [Pause/Cont] again will continue the average from where it was paused. SR780 Network Signal Analyzer...
- Page 276 When N measurements have been completed, the measurement stops. When Fixed Length Peak Hold is in progress, the number of measurements completed is shown in the display. Continuous For Peak Hold averaging, the comparison of new data with the stored peaks continues indefinitely. SR780 Network Signal Analyzer...
- Page 277 Factors which affect the processor’s ability to run real time include the measurement type, averaging and source type. 100% Time Record Increment is used whenever the measurement is vector averaged. SR780 Network Signal Analyzer...
- Page 278 When Overload Reject is Off, all time records are part of the measurement average. Overloads can greatly disturb the average so be certain that the correct Input Range is used. Command: FREJ (?) d {, i} SR780 Network Signal Analyzer...
- Page 279 When Average Preview is Timed, the input time record is automatically accepted after the Preview Time (unless rejected first). Command: PAVT (?) d {, x} Accept Accept the displayed preview time record and add the measurement to the average. SR780 Network Signal Analyzer...
- Page 280 Average Preview allows each individual measurement to be accepted (added to the average) or rejected (not added to the average) based upon the input time records. This is useful for rejecting bad time records from corrupting an averaged measurement. Command: PAVR SR780 Network Signal Analyzer...
-
Page 281: Octave Average Menu
When the measurement is free running (Free Run Trigger Mode), each time the linear average is done, the result is stored in the waterfall buffer and the average is reset and started over (instead of stopping). Each completed average counts as a single waterfall record. SR780 Network Signal Analyzer... - Page 282 Decreasing the Lowest Band below 100 Hz increases the minimum value of the Integration Time. The [Start/Reset] key resets the current averages and starts the measurement over. The [Pause/Cont] key pauses the measurement. Pressing [Pause/Cont] again resets the averages and starts the measurement over. SR780 Network Signal Analyzer...
- Page 283 Continuous]. The Linear Avg Mode only applies for linear averaging when the Trigger Mode is Auto or Manual Arm. When the Trigger Mode is Auto or Manual Arm, the Linear Average Mode determines how the measurement restarts. SR780 Network Signal Analyzer...
- Page 284 [Start/Reset] is pressed again (or the measurement is changed). If waterfall storage is on, the next measurement starts immediately after the previous measurement finishes. Both displays must have the same Linear Average Mode. Command: OLAT (?) d {, i} SR780 Network Signal Analyzer...
-
Page 285: Swept Sine Average Menu
The estimated sweep time is displayed in the Horizontal Scale Bar. This time is simply the sum of the Settle and Integrate times for all points in the sweep. Auto functions (Source Auto Level, Auto Range, Auto Resolution) will change the actual sweep time. Command: SSCY (?) d {, i} SR780 Network Signal Analyzer... - Page 286 Remember, the detection bandwidth increases with frequency in this case (the cycles get shorter) which may result in increased detected noise at higher frequencies. Changes made to the number of Integration Cycles during a sweep take effect immediately. SR780 Network Signal Analyzer...
- Page 287 The estimated sweep time is displayed in the Horizontal Scale Bar. This time is simply the sum of the Settle and Integrate times for all points in the sweep. Auto functions (Source Auto Level, Auto Range, Auto Resolution) will change the actual sweep time. Command: SSCY (?) d {, i} SR780 Network Signal Analyzer...
- Page 288 4-106 Swept Sine Average Menu SR780 Network Signal Analyzer...
-
Page 289: User Math Menu
Display the Edit Function menu to edit the selected User Function. Press <Cancel> to exit back to the main [User Math] menu . To enter an equation, use <Operands> and <Operations> and the knob to select operands and operations. [<-] (Backspace) deletes the term before the cursor. SR780 Network Signal Analyzer... - Page 290 Use the knob to pick one of the displayed Operands and press [Enter] to place it in the equation at the cursor location. The display then automatically switches to the Operations display. To enter another operand instead, press <Operands> again. The available measurement operands depend upon the current Measurement Group. FFT Measurement Group SR780 Network Signal Analyzer...
- Page 291 Type (linear or expo) and the Number of Averages are set in the [Average] menu. All basic FFT measurements, Time, X_Spec and FFT2/FFT1 are NOT averaged results. Use the Avg() or VecAvg() operators to perform explicit averaging on these operands. SR780 Network Signal Analyzer...
- Page 292 Arithmetic operations (+, -, x, /) combine operand terms on a point by point basis. It is the user’s responsibility to ensure that the operand terms have the correct X axis type and lengths in order to produce meaningful results. SR780 Network Signal Analyzer...
- Page 293 Average Type and Number of Averages. d/dx( ) is the derivative operator. The derivative is performed with respect to the X-axis bin number, not the x-axis values. For example, to convert d/dx( ) to d/df( ) for a linear SR780 Network Signal Analyzer...
- Page 294 If a display is currently measuring this function, then it may not be cleared. In this case, change the measurement and then clear the equation. Cancel Discard any changes made in this menu and exit this menu. SR780 Network Signal Analyzer...
- Page 295 Command: USRC (?) i {, x, y} Imaginary Part Enter a new value for the imaginary part of the selected Constant. The real part is left unchanged and the magnitude and phase are updated. Command: USRC (?) i {, x, y} SR780 Network Signal Analyzer...
- Page 296 Copy the marker reading (exactly as shown in the Marker Position Bar) of the active display to the magnitude of the selected Constant. No unit translation takes place. Make sure that the units of the active display are correct before using this feature. SR780 Network Signal Analyzer...
-
Page 297: Window Menu
The Flattop window has the best amplitude accuracy of any window. Its off-bin amplitude variation is about 0.02 dB. However, the selectivity is worse. Unlike the other windows, the Flattop window has a very wide pass band and very steep rolloff on either SR780 Network Signal Analyzer... - Page 298 User window and another window, keep using <Trace to Window>. Remember, window functions have a great deal of impact on the resulting FFT spectrum. A poorly designed window can result in significant measurement errors. SR780 Network Signal Analyzer...
- Page 299 Copy a stored data trace (real part only) to the User window function of the active display. Use the knob to pick a trace which already contains data and press [Enter]. The window automatically switches to User window. SR780 Network Signal Analyzer...
- Page 300 Use Non-Symmetric if the User window is non-symmetric. Phase will be measured relative to the start of the time record. Force and Exponential windows are non- symmetric. Use <Trace to Window> to choose the User window. Command: WSYM (?) d {, i} SR780 Network Signal Analyzer...
-
Page 301: Waterfall Menu
Vertical Scale Bar when storage is A waterfall display may not be taken Off-Line. Moving the Marker The marker may be moved to a record other than 0 only if storage is on. SR780 Network Signal Analyzer... - Page 302 Each time the linear average is done, the result is stored in the waterfall buffer and the average is reset and started over (instead of stopping). Each completed average counts as a single waterfall record. SR780 Network Signal Analyzer...
- Page 303 In Octave group, the Storage Interval is set as a time. In this case, a snapshot is stored to memory every Storage Interval amount of time (4 ms minimum with 4 ms resolution). SR780 Network Signal Analyzer...
- Page 304 Each display has its own Waterfall Trace Height. This entry field can be linked to both displays by using the [Link] key. Command: WHIT (?) d {, i} Angle Set the requested Waterfall Scroll Angle for the active display. SR780 Network Signal Analyzer...
- Page 305 Clear Allocation Clears the existing memory allocations in this menu. Confirm Allocation Places the memory allocations in this menu into effect. Exiting this menu without pressing <Confirm Allocation> will cancel any adjustments made in this menu. SR780 Network Signal Analyzer...
- Page 306 Angles is On, the available Scroll Angles are limited to those which update faster (due to the graphics architecture). Each display has its own Fast Angles mode. This entry field can be linked to both displays by using the [Link] key. SR780 Network Signal Analyzer...
- Page 307 ‘hidden’ behind them, reverse the waterfall direction. Each display has its own Paused Drawing Mode. This entry field can be linked to both displays by using the [Link] key. Command: WREV (?) d {, i} SR780 Network Signal Analyzer...
- Page 308 A stored slice trace can be recalled to a Display or Reference Display, used in a User Math Function or saved to disk. A slice can not be copied to the Arbitrary Waveform buffer. Command: WSLC (?) d, i, j SR780 Network Signal Analyzer...
-
Page 309: Capture Menu
If the Capture Mode is Continuous, once capture is started, it continues indefinitely and fills the capture buffer in a circular fashion. In this case, press [Stop Capture] to halt capture with the most recent data in the buffer. Command: CMOD (?) {i} SR780 Network Signal Analyzer... - Page 310 The captured data represents a frequency span from 0 Hz to 1/2.56 times the Sampling Rate. Capturing at less than the maximum sampling rate restricts the playback measurement span to 1/2.56 times the sampling rate. Command: CRAT (?) {i} Allocate Memory Display the Memory Allocation menu. SR780 Network Signal Analyzer...
- Page 311 Clear Allocation clears the existing memory allocations in this menu. The new allocations do not take effect unless <Confirm Allocation> is pressed. View Header View information about the capture buffer data. Auto Pan Set Auto Pan On or Off. SR780 Network Signal Analyzer...
- Page 312 During playback, this keeps the capture display showing the points which are currently being measured. Off leaves the display Pan to that set in the [Display Setup] menu. Command: CPAN (?) {i} SR780 Network Signal Analyzer...
-
Page 313: Analysis Menu
Upper limit or less than a Lower limit cause the test to fail. Limit Segments are defined for the current View. Changing the View invalidates the Limit Segments and limit testing is not available in the new View. Either return to the SR780 Network Signal Analyzer... - Page 314 Press <Calculate Excd> to start the calculation. The result is stored in a data trace and has the same measurement type as the waterfall measurements. To view the result, recall the trace to a display or reference graph. SR780 Network Signal Analyzer...
-
Page 315: Data Table Analysis Menu
Data Table is turned On. To select an entry in the table, use the backspace key [<-] or press [Alt] and turn the knob. Press [Alt] again to return the keypad to normal mode. You can not delete all of the entries in the table. Command: DDLT d, i SR780 Network Signal Analyzer... - Page 316 4-134 Data Table Analysis Menu Clear Table Clear the Data Table for the active display. The table is left with a single entry for the first bin in the display. Command: DCLR d SR780 Network Signal Analyzer...
-
Page 317: Limit Testing Analysis Menu
Turn the audible Limit Alarm for the active display On or Off. Off turns off the alarm. On turns on the alarm. Limit tests which fail will sound an audible alarm. Command: LALM (?) d {, i} SR780 Network Signal Analyzer... - Page 318 These markers are above the segment and point downwards for Upper limits. They are below the segment and point upwards for Lower limits. Command: LSEG (?) d, i {, j, x0, y0, x1, y1} SR780 Network Signal Analyzer...
- Page 319 Command: LSEG (?) d, i {, j, x0, y0, x1, y1} Delete Segment Delete the Current Segment. The numbering of the remaining segments may change as a result. Use the Current Segment markers to identify the correct segment before editing. SR780 Network Signal Analyzer...
- Page 320 4-138 Limit Testing Analysis Menu Command: LDLT d, i Shift All Shift all of the Limit Segments up or down together. Enter a value or use the knob to shift by 1/10’s of a division. Command: LSFT d, x SR780 Network Signal Analyzer...
-
Page 321: Marker Statistics Analysis Menu
Reset and start the accumulation of marker statistics. The various quantities are reset to zero and the accumulation of marker statistics begins. Use this key whenever the marker position is changed to avoid mixing data from different marker positions. Command: MSRS SR780 Network Signal Analyzer... - Page 322 This menu box displays the maximum value of the marker Y value for display B since Marker Stats was turned On or Reset. This max value is updated whenever new data is available for Display B and does not update if Display B is not visible. Command: MSAB ? SR780 Network Signal Analyzer...
- Page 323 This menu box displays the standard deviation of the marker Y value for display B since Marker Stats was turned On or Reset. This standard deviation is updated whenever new data is available for Display B and does not update if Display B is not visible. Command: MSSB ? SR780 Network Signal Analyzer...
-
Page 324: Exceedance Statistics Analysis Menu
The total number of records currently stored and available in the waterfall buffer is displayed in the Vertical Scale Bar. The Stop Index should not exceed the total number of records in the buffer. Both displays use the same Stop Index. Command: ESTP (?) {i} SR780 Network Signal Analyzer... - Page 325 The result is stored in a data trace and has the same measurement type as the waterfall measurements. To view the result, recall the trace to a display or reference graph. Command: EXCE d, i SR780 Network Signal Analyzer...
- Page 326 Exceedance Statistics Menu SR780 Network Signal Analyzer...
-
Page 327: Disk Menu
Turn the knob to bring up the file catalog display listing all files in the Current Directory with the extension .78? (SR780 files). Press [Exp] to display all files in the directory (*.*). Choose a file name with the knob and press [Enter] to make it the Current File Name. - Page 328 Command: FRCL d Settings to Disk Save the instrument settings to the Current File in the Current Directory. If the Current File has no specified extension, the default extension .78S is used. SR780 Network Signal Analyzer...
- Page 329 Display the Disk Buffers menu. Press <Return> or [Disk] for the main Disk menu. The Disk Buffers menu loads traces from disk files. It also loads and saves Capture, Arbitrary Source and Waterfall data buffers to disk. SR780 Network Signal Analyzer...
- Page 330 Disk Upkeep Display the Disk Upkeep menu. Press <Return> or [Disk] for the main Disk menu. The Disk Upkeep menu allows files to be deleted, directories to be created and removed and disks to be formatted. SR780 Network Signal Analyzer...
- Page 331 Nodal DOF Menu 4-149 Nodal Degree-of-Freedom Menu The nodal DOF menu appears after <Display to Disk> or <Trace to Disk> is selected if the <Node Info?> softkey in the [System]<Preferences> menu is set to "on." The nodal DOF menu allows entry of descriptive paramters relating to the nodal DOFs which will be saved with the file and available to external programs which convert the files to formats usable by modal analysis programs.
-
Page 332: Reference Direction
4-150 Nodal DOF Menu Reference Direction Enter the direction associated with the reference node, i.e. the direction of the stimulus. Direction can be specified either along the ± X, Y, or Z axes for linear stimulus, or as ± θ θ... - Page 333 Nodal DOF Menu 4-151 Abort Save Press to abort the selected disk operation while in the nodal DOF information menu. Continue Save Press when finished entering nodal DOF information to continue the selected disk operation. SR785 Dynamic Signal Analyzer...
-
Page 334: Recall Settings Menu
Turn the knob to bring up the file catalog display listing all files in the Current Directory with the extension .78? (SR780 files). Press [Exp] to display all files in the directory (*.*). Choose a file name with the knob and press [Enter] to make it the Current File Name. - Page 335 Recall Settings Menu 4-153 Turning the knob will bring up the directory tree display which lists all of the sub- directories on the disk. Choose a directory with the knob and press [Enter] to make it the Current Directory. A directory may be entered using the [Alt] key and the letters associated with each key. Press [Alt] again to return to normal keypad operation.
- Page 336 4-154 Recall Settings Menu General System Include the [System] and [Output] menu settings in the recall. Command: SRCL i Macros Include stored macros in the recall. Command: SRCL i Recall from Disk Recall the selected instrument settings from the Current File in the Current Directory. The recalled settings become effective immediately.
-
Page 337: Disk Buffers Menu
Turn the knob to bring up the file catalog display listing all files in the Current Directory with the extension .78? (SR780 files). Press [Exp] to display all files in the directory (*.*). Choose a file name with the knob and press [Enter] to make it the Current File Name. - Page 338 4-156 Disk Buffers Menu A directory may be entered using the [Alt] key and the letters associated with each key. Press [Alt] again to return to normal keypad operation. An error results if the entered directory does not exist. New directories are created with <Make Directory>. Command: FDIR (?) {s} Load Trace Data (ASCII) Load ASCII data from the Current File in the Current Directory into an existing Trace.
- Page 339 Disk Buffers Menu 4-157 Octave number of displayed bins + 1 (the power bin is the last point) (all points are real, the imaginary parts should all be zero) Swept Sine Number of points in the sweep For example, the ASCII file for a 400 line FFT might be 0.000, 0.500 1.000, 1.500 2.000, 2.500...
- Page 340 4-158 Disk Buffers Menu where (X0, Y0) is the first complex data point and (XN-1, YN-1) is the Nth data point. Each value is 4-byte IEEE float. The value of N depends upon the type and length of the target trace. See <Load Trace Data (Ascii)>...
- Page 341 Disk Buffers Menu 4-159 of Ch1+Ch2 capture, loading one channel does not disturb the contents of the other channel’s buffer. If either the length or sampling rate is different from the current [Capture] menu, they are changed to the length and sampling rate of the disk data. In the case of Ch1+Ch2 capture, loading Ch1 (Ch2) capture will zero the Ch2 (Ch1) capture buffer if the capture length or sampling rate is changed by this operation.
- Page 342 4-160 Disk Buffers Menu playback portion if desired). To save a 100k capture buffer requires 100k data points or 400k bytes. Waterfall buffers are more complicated. The measurement parameters determine the number of points in a single record. See <Load Trace Data (Ascii)> for a table of lengths. Each record is complex (2 floating point values for each data point).
-
Page 343: Disk Upkeep Menu
Turn the knob to bring up the file catalog display listing all files in the Current Directory with the extension .78? (SR780 files). Press [Exp] to display all files in the directory (*.*). Choose a file name with the knob and press [Enter] to make it the Upkeep File Name. - Page 344 4-162 Disk Upkeep Menu New directories are created with <Make Directory>. Command: FDIR (?) {s} Make Directory Make a new directory on the disk. Enter a directory name with the [Alt] key. The new directory will be created in the Current Directory. Command: MDIR s Del File Delete the Disk Upkeep File from the Current Directory.
-
Page 345: Output Menu
Command: PRNT Vector/Plot Plot the screen using the selected Vector Plotter to the selected Destination (Interface or Disk). Other front panel operations are disabled until plotting is completed. Pressing backspace will abort the operation. Command: PLOT SR780 Network Signal Analyzer... - Page 346 All prints the entire screen image including the menu softkeys and status area. Command: PSCR (?) {i} Vector/Plotter Select the Vector/Plotter type for the Vector/Plot operation [HPGL, Postscript]. Vector/Plot only plots the displayed graphs. HPGL is used for HPGL compatible plotters. SR780 Network Signal Analyzer...
- Page 347 SR780 and the plotter are controlled by a host computer. The host is responsible for issuing the PLOT command to the SR780, and then making the plotter a listener and the SR780 a talker. The plotter commands will then be transferred from the SR780 to the plotter.
-
Page 348: Gpib Address
Adjust the vertical position of the Note with the knob. Command: NOTE i, j {, k, l, m, s} Display Select which display the Note appears in [0=DisplayA, 1=DisplayB]. Command: NOTE i, j {, k, l, m, s} SR780 Network Signal Analyzer... - Page 349 Display the Hardcopy Colors menu. Press <Return> or [Output] for the main [Output] menu . Print Color Selections Printing is a bit mapped operation. Different areas of the screen can be printed with different print densities giving a range of gray between black and white (white paper). SR780 Network Signal Analyzer...
- Page 350 Assign a plotter pen number to the text labels on the graphs [1 to 8]. Command: PLTX (?) {i} Plotter Grid Pen Assign a plotter pen number to the graph grid [1 to 8]. Command: PLGD (?) {i} SR780 Network Signal Analyzer...
- Page 351 Assign a plotter pen number to the graph data trace [1 to 8]. Command: PLTR (?) {i} Plotter Marker Pen Assign a plotter pen number to the graph marker [1 to 8]. Turn the marker off to avoid plotting it. Command: PLMK (?) {i} SR780 Network Signal Analyzer...
- Page 352 4-170 Output Menu SR780 Network Signal Analyzer...
-
Page 353: System Menu
Display the [System] <Remote> interface menu. Remote interface parameters should not be altered while the computer interface is active. Press <Return> or [System] for the [System] menu. Preferences Display the [System] <Preferences> menu. Press <Return> or [System] for the [System] menu. SR780 Network Signal Analyzer... - Page 354 Show Settings Show the instrument setup. This key enters the Help system and displays the measurement setup and system settings. Press [0] to exit Help. SR780 Network Signal Analyzer...
- Page 355 Show the power on screen. This screen shows the version number as well as the results of the power on tests. The size of the installed data memory is also displayed (2 Ms, 4 Ms or 8Ms). SR780 Network Signal Analyzer...
-
Page 356: System Remote Menu
To return to from REMOTE to LOCAL (front panel enabled), press [Help/Local]. Command: OVRM (?) {i} Baud Rate Select the RS232 (Serial) interface Baud Rate [300, 1200, 2400, 4800, 9600, 19.2k]. Most PC’s use 9600 as a default. SR780 Network Signal Analyzer... - Page 357 The upper half of the screen is the Receive Queue. These are the most recent characters which have been received by the SR780. Commands which have already been executed are shown in normal text. Commands which have not yet been executed are shown with a bright background.
-
Page 358: System Preferences Menu
Done Volume If Done Volume is set to Noisy, an audible alarm is sounded when a measurement is done or completed. For example, when linear averaging is complete, an alarm is sounded. Command: ADON (?) {i} SR780 Network Signal Analyzer... - Page 359 244.140625 mHz (Exact Bin) or 244.1 mHz (Rounded). The second bin is 488.28125 mHz (Exact Bin) and 488.3 mHz (Rounded). Command: FFMT (?) {i} Node Info Prompt Turns the node information prompt when saving files on or off. SR780 Network Signal Analyzer...
- Page 360 (transfer function) be associated with information regarding the nodal degrees of freedom (DOF). When Node Info Prompt is set on, the SR780 allows entry of DOF parameters when saving data using Trace to Disk or Display to Disk. When the “Trace to Disk”...
-
Page 361: System Date/Time Menu
Set the System Date [mm:dd:yy]. The System Date is entered as month:day:year and all entries are 6 digits. [Enter] sets the new date or press this softkey again to abort the entry. Command: DATE (?) {i} SR780 Network Signal Analyzer... -
Page 362: System Diagnostics Menu
[Snail, Human Baby, Adult, Lunatic]. Turning the knob will move the marker around the circle, verifying knob action and direction. Press <Return> for the <Diagnostics> menu. RS232/Printer Test Display the RS232/Printer Test screen. SR780 Network Signal Analyzer... - Page 363 The entire test takes about 2 minutes. Press <Begin> to start the test. When the test reaches the Disk Changed Sensor Out phase, remove the disk and then insert it again. Press <Return> for the <Diagnostics> menu. SR780 Network Signal Analyzer...
-
Page 364: Serial Number
Do not use this function unless you are making input offset or CMR adjustments to an analog input board. See the Service Manual for more information. The unit must be turned off and back on after using this function to restore the input calibrations! SR780 Network Signal Analyzer... -
Page 365: Edit Macro Menu
[<-] (Backspace) deletes the term before the cursor. Insert/Replace Toggle between insert and replace mode while editing a macro string. If editing in insert mode, ‘Ins’ appears in the upper right corner of the edit window. If editing in replace mode, ‘Rep’ appears. SR780 Network Signal Analyzer... - Page 366 Clear the entire macro string. Cancel Discard any changes made in this menu and exit this menu. Enter Macro Enter the displayed string as the new macro and exit this menu. Use [Play Macro] to playback the macro string. SR780 Network Signal Analyzer...
- Page 367 Noise Source Commands 5-47 Arbitrary Source Commands 5-48 Swept Sine Source Commands 5-49 Input Commands 5-51 Input Playback Commands 5-54 Trigger Commands 5-55 Average Commands (FFT) 5-56 Average Commands (Octave) 5-58 Average Commands (Swept Sine) 5-60 SR780 Network Signal Analyzer...
-
Page 368: Index Of Commands
5-34 X/Division (Polar) YCEN (?) d {, x} 5-34 Y Center (Polar) Y2DV (?) d {, x} 5-34 Y/Division (Polar) XPAN (?) d {, i} 5-34 X Pan XZOM (?) d {, i} 5-34 X Zoom SR780 Network Signal Analyzer... - Page 369 BMKL (?) d, i {, j} 5-43 Band i Left Bin j BMKR (?) d, i {, j} 5-43 Band i Right Bin j BEXC ? d {, i} 5-43 Band Exclude BRAM ? d {, i} 5-43 Band Ratio Mode SR780 Network Signal Analyzer...
- Page 370 Input Source I1MD (?) {i} 5-51 Ch1 Input Mode I1GD (?) {i} 5-51 Ch1 Input Grounding I1CP (?) {i} 5-51 Ch1 Input Coupling I1RG (?) {i} 5-51 Ch1 Input Range A1RG (?) {i} 5-51 Ch1 AutoRange Off/On SR780 Network Signal Analyzer...
- Page 371 FFT Time Record Increment FREJ (?) d {, i} 5-57 FFT Overload Reject PAVO (?) d {, i} 5-57 Average Preview PAVT (?) d {, x} 5-57 Preview Time PAVA 5-57 Accept Preview PAVR 5-57 Reject Preview SR780 Network Signal Analyzer...
- Page 372 Capture CCHN (?) {i} 5-68 Capture Channels CMOD (?) {i} 5-68 Capture Mode CLEN (?) {i} 5-68 Capture Length CRAT (?) {i} 5-68 Capture Rate CPAN (?) {i} 5-68 Capture Auto Pan CSTR 5-68 Capture Start SR780 Network Signal Analyzer...
- Page 373 Save/Recall Directory MDIR s 5-76 Make Directory FXST ? s 5-76 File Exist? FREE ? 5-76 Disk Free Space? FRST ? 5-77 Reset Disk Catalog FNXT ? 5-77 Read Disk Catalog FSAV d 5-76 Display to Disk SR780 Network Signal Analyzer...
- Page 374 ACTD (?) i 5-84 Active Display STRT 5-84 Start/Reset PAUS 5-84 Pause CONT 5-84 Continue UNST d 5-84 Unsettle Measurement CSTR 5-68 Capture Start CSTP 5-68 Capture Stop SVTR d, i 5-84 Display d to Trace i SR780 Network Signal Analyzer...
- Page 375 Upload Arbitrary Buffer APUT ? i 5-96 Download Arbitrary Buffer CGET ? i, j 5-97 Upload Capture Buffer CPUT ? i, j 5-29 Download Capture Buffer WGET ? 5-98 Upload Waterfall Buffer WPUT ? 5-99 Download Waterfall Buffer SR780 Network Signal Analyzer...
- Page 376 DSPE (?) {i} {, j} 5-106 Display Status Enable DSPS ? {i} 5-106 Display Status Read INPE (?) {i} {, j} 5-106 Input Status Enable INPS ? {i} 5-106 Input Status Read INPC ? i 5-106 Input Ovld Read SR780 Network Signal Analyzer...
-
Page 377: Alphabetical List Of Commands
Continue CPAN (?) {i} 5-68 Capture Auto Pan CPUT ? i, j 5-29 Download Capture Buffer CRAT (?) {i} 5-68 Capture Rate CSRC (?) {i} 5-46 Source Display CSTP 5-68 Capture Stop CSTR 5-68 Capture Start SR780 Network Signal Analyzer... - Page 378 FCTR (?) d {, f} 5-25 FFT Center Frequency FDIR (?) {s} 5-76 Save/Recall Directory FEND (?) d {, f} 5-26 FFT End Frequency FFMT (?) {i} 5-82 Frequency Format FLIN (?) d {, i} 5-25 FFT Resolution SR780 Network Signal Analyzer...
- Page 379 INSE (?) {i} {, j} 5-105 Instrument Status Enable INST ? {i} 5-106 Instrument Status Read ISPD (?) {i} 5-54 Capture Playback Speed ISRC (?) {i} 5-51 Input Source ISTR (?) {i} 5-54 Capture Playback Start SR780 Network Signal Analyzer...
- Page 380 5-74 Marker Std Dev B Read MWFL d, i 5-37 Marker Move Waterfall to record i MWID (?) d {, i} 5-39 Normal Marker Width MXRL (?) d {, i} 5-39 Normal Marker X Rel Mode SR780 Network Signal Analyzer...
- Page 381 PSDU (?) d {, i} 5-35 PSD Units On/Off RCRF d, i 5-85 Trace to Reference RCTR d, i 5-84 Trace i to Display d REFY ? d, j 5-89 Read Ref Display d bin j SR780 Network Signal Analyzer...
- Page 382 Start/Reset STYP (?) {i} 5-44 Source Type SVNI (?) {i} 5-102 Save Nodal Information SVRF d, i 5-85 Reference to Trace SVTR d, i 5-84 Display d to Trace i TARB i 5-48 Trace to Arb SR780 Network Signal Analyzer...
- Page 383 WTRC d, i, j 5-66 Waterfall Record to Trace WVCT (?) d {, i} 5-65 Waterfall View Count XAXS (?) d {, i} 5-35 X Axis Scale Type XCEN (?) d {, x} 5-34 X Center (Polar) SR780 Network Signal Analyzer...
- Page 384 YCEN (?) d {, x} 5-34 Y Center (Polar) YDIV (?) d {, x} 5-34 Y/Division YMAX (?) d {, x} 5-33 Y Maximum YMID (?) d {, x} 5-33 Y Midpoint YMIN (?) d {, x} 5-33 Y Minimum SR780 Network Signal Analyzer...
-
Page 385: Introduction
CTS/DTR hardware handshaking. The CTS signal (pin 5) is an output indicating that the SR780 is ready, while the DTR signal (pin 20) is an input that is used to control the SR780's data transmission. If desired, the handshake pins may be ignored and a simple 3 wire interface (pins 2,3 and 7) may be used. - Page 386 Start the measurement (same as [Start/Reset] key) Command Synchronization IFC (Interface Ready, bit 7) in the Serial Poll status signals that the SR780 is ready to receive and execute a command. When a command is received, this bit is cleared, indicating that command execution is in progress.
- Page 387 IFC bit set (since *STB is itself a command). Since the SR780 processes one command at a time, status queries will not be processed until the previous operation is finished. Thus a response to a status query in itself signals that the previous command is finished.
- Page 388 These set commands are not allowed unless the measurement group is Swept Sine (just like the menu interface). Example Program An example program is included at the end of this chapter. This program is a good reference for writing your own programs to control the SR780. SR780 Network Signal Analyzer...
-
Page 389: Command Syntax
The rest of the sequence consists of parameters. Parameters shown in { } are not always required. Generally, parameters in { } are required to set a value in the SR780. Multiple parameters are separated by commas. Multiple commands may be sent on one command line by separating them with semicolons (;). - Page 390 Be careful to send commands in the correct order to avoid context errors. A good practice is to send the commands in the same order as programming the instrument using the softkeys. SR780 Network Signal Analyzer...
-
Page 391: Frequency Commands
(real number of Hz). Values of f which would cause the span to exceed the 0 to 102.4 (100.0) kHz range cause an error. This command is valid only when the Measurement Group is FFT. The set command requires display d to be Live. SR780 Network Signal Analyzer... - Page 392 UNST command and wait for settling to finish. This command is valid only when the Measurement Group is FFT or Octave. SR780 Network Signal Analyzer...
- Page 393 If the signal comes from an external source and is changed in such a way as to require the measurement to settle, it is convenient to use the UNST command and wait for settling to finish. SR780 Network Signal Analyzer...
- Page 394 5-28 Frequency Commands This command is valid only when the Measurement Group is FFT or Octave. SR780 Network Signal Analyzer...
- Page 395 Live. SARS (?) d {, i} The SARS command sets (queries) the swept sine Auto Resolution Mode of display d. The parameter i selects Off (0) or On (1). The set command requires d=2 (both displays). SR780 Network Signal Analyzer...
- Page 396 The parameter x is a level from 0.05 to 6.0 (dB). The set command requires d=2 (both displays). This command is valid only when the Measurement Group is Swept Sine. The set command requires a display to be Live. SR780 Network Signal Analyzer...
-
Page 397: Display Setup Commands
<F2>/<F1> Transfer Function of Averaged FFT’s Auto Correlation 1 Auto Correlation 2 Cross Correlation Capture Buffer 1 Capture Buffer 2 FFT User Function 1 FFT User Function 2 FFT User Function 3 FFT User Function 4 FFT User Function 5 SR780 Network Signal Analyzer... - Page 398 Imaginary Part Phase Unwrapped Phase Nyquist Nichols A measurement should be setup by first choosing the Measurement Group, then the Measurement, then the View, then the Units. Finally, the display scale and references should be set. SR780 Network Signal Analyzer...
- Page 399 The YMIN command sets (queries) the Y Minimum (bottom reference) of display d. The parameter x is a real number in the display units. This command is not valid when the View is Nichols or Nyquist. SR780 Network Signal Analyzer...
- Page 400 The XZOM command sets (queries) the Zoom factor (X axis expand) of display d. The parameter i is the zoom factor (1-5). This command is not valid when the X axis is logarithmic or when the View is Nyquist or Nichols. SR780 Network Signal Analyzer...
-
Page 401: Display Options Commands
Changing the Grid Divisions changes the vertical scaling (Y/div) and horizontal scaling (X/div) (Nyquist and Nichols views). PSDU (?) d {, i} The PSDU command sets (queries) the PSD Units Mode of display d. The parameter i selects Off (0) or On (1). SR780 Network Signal Analyzer... - Page 402 The DDXW command sets (queries) the d/dx Window of display d. The parameter x is a percentage of the display width. This affects the calculation of d/dx and group delay for user math functions in display d. SR780 Network Signal Analyzer...
-
Page 403: Marker Commands
The MRKB ? command queries the marker bin number of display d. The value returned is the bin number of the marker. Bin 0 is the left most bin in the display. This command is not valid if the Marker of display d is Off. SR780 Network Signal Analyzer... - Page 404 (d=2 is not allowed). This command is only valid when the Measurement Group is FFT and display d is Live. This command is not valid if the Marker of display d is Off. SR780 Network Signal Analyzer...
- Page 405 If Marker Rel is Off, MRON d sets the Normal Marker offsets (X and Y) to the current marker position and sets the Marker to Relative to Offset (relative marker readings). If Marker Rel is Relative to Offset, MRON d sets the Marker Rel to Off (absolute marker readings). SR780 Network Signal Analyzer...
- Page 406 5-40 Marker Commands MRON? d returns 0 if Marker Rel is Off and 1 if Marker is Rel to Offset. This command is only valid if the Marker Mode for display d is Normal. SR780 Network Signal Analyzer...
- Page 407 HPWR ? d The HPWR ? command queries the Harmonic Power for display d. The returned value is a real value of Vrms. This command is only valid if the Marker Mode for display d is Harmonic. SR780 Network Signal Analyzer...
- Page 408 The SPWR ? command queries the Sideband Power for display d. The parameter i selects dB Relative to Fundamental (0) or Vrms (1) and is required. This command is only valid if the Marker Mode for display d is Sideband. SR780 Network Signal Analyzer...
- Page 409 BRAT ? d, i The BPWR command queries the Band Ratio for display d. The parameter i selects percent (0) or dB (1) band ratio. This command is only valid if the Marker Mode for display d is Band. SR780 Network Signal Analyzer...
-
Page 410: Source Commands
The STYP command sets (queries) the Source Type. The parameter i selects Sine (0), Chirp (1), Noise (2) or Arbitrary (3). When the Measurement Group is Swept Sine, the Source Type may not be changed and this command is not valid. SR780 Network Signal Analyzer... - Page 411 This command is valid only when the Source Type is Sine. S2AM (?) {x} The S2AM command sets (queries) the Amplitude of Sine Tone 2. The parameter x is a real number of V. This command is valid only when the Source Type is Sine. SR780 Network Signal Analyzer...
- Page 412 The CSRC command sets (queries) the Source Display. The parameter i selects DisplayA (0) or DisplayB (1) This command is valid only when the Source Type is Chirp or Noise and the Measurement Group is FFT. SR780 Network Signal Analyzer...
- Page 413 The CSRC command sets (queries) the Source Display. The parameter i selects DisplayA (0) or DisplayB (1) This command is valid only when the Source Type is Chirp or Noise and the Measurement Group is FFT. SR780 Network Signal Analyzer...
- Page 414 Arbitrary Length is changed to 2 kPoints and the Arbitrary Source is change to Arb. Buffer. Trace i must contain FFT measurement data (usually a time record). This command is valid only when the Source Type is Arbitrary. SR780 Network Signal Analyzer...
- Page 415 The SSLL command sets (queries) the Swept Sine Reference Lower Limit. The parameter x is a ratio in dB from -0.1 to -30.0 dB. This command is valid only when the Measurement Group is Swept Sine and Auto Level Reference is Ch1 or Ch2. SR780 Network Signal Analyzer...
- Page 416 The SMAX command sets (queries) the Swept Sine Maximum Level. The parameter x is a real number of mV. This command is valid only when the Measurement Group is Swept Sine and Auto Level Reference is Ch1 or Ch2. SR780 Network Signal Analyzer...
-
Page 417: Input Commands
The I2MD command sets (queries) the Ch2 Input Mode. The parameter i selects A (single-ended) (0) or A-B (differential) (1). I2GD (?) {i} The I2GD command sets (queries) the Ch2 Input Grounding. The parameter i selects Float (0) or Ground (1). SR780 Network Signal Analyzer... - Page 418 The EU1M command sets (queries) the Ch1 Engineering Units Mode. The parameter i selects Off (0) or On (1). EU1L (?) {i} The EU1L command sets (queries) the Ch1 Engineering Units Label. The parameter i selects the unit label. Label Label in/s dyne in/s USER SR780 Network Signal Analyzer...
- Page 419 The EU2V command sets (queries) the Ch2 Engineering Units per Volt scale. The parameter x is real number of EU/Volt (EU’s per Volt). EU2U (?) {s} The EU2U command sets (queries) the Ch2 User Label. The string s is the user label. SR780 Network Signal Analyzer...
- Page 420 This command is valid only when the Input Source is Playback. ISPD (?) {i} The ISPD command sets (queries) the Capture Playback Speed. The parameter i selects Normal (0) or Every Frame (1). This command is valid only when the Input Source is Playback. SR780 Network Signal Analyzer...
-
Page 421: Trigger Commands
STMD (?) {i} The STMD command sets (queries) the Triggered Source Mode. The parameter i selects 1-Shot (0) or Continuous (1). TMAN The TMAN command Manually Triggers if armed. This command may not be queried. SR780 Network Signal Analyzer... -
Page 422: Average Commands
The FOVL command sets (queries) the FFT Time Record Increment for display d. The parameter x is a percentage up to 300. This command is valid only when the Measurement Group is FFT. The set command requires display d to be Live. SR780 Network Signal Analyzer... - Page 423 NEWA or NEWB but occurs upon receipt of the accept or reject command (or after a Preview Time). This command is valid only when the Measurement Group is FFT. This command has no effect unless the previewed time records are displayed. SR780 Network Signal Analyzer...
- Page 424 Total (0), Impulse (1), L (2) or Peak (3). Peak power is not allowed if the Averaging Type is not Peak Hold. Peak power is automatically selected if the Averaging Type is Peak Hold. Use the OTYP command to set Peak Hold averaging. SR780 Network Signal Analyzer...
- Page 425 The parameter i selects Triggered (0) or Continuous (1). The set command requires d=2 (both displays have the same mode). This command is valid only when the Measurement Group is Octave. The set command requires a display to be Live. SR780 Network Signal Analyzer...
- Page 426 The parameter i is a number of cycles from 1 to 32767 seconds. The set command requires d=2 (both displays). This command is valid only when the Measurement Group is Swept Sine. The set command requires a display to be Live. SR780 Network Signal Analyzer...
-
Page 427: User Math Commands
Sqrt( -110 F,O,S Avg( -111 VecAvg( -112 jOmega( -113 Phase( -114 F,O,S -115 F,O,S AWt( -116 F,O,S BWt( -117 F,O,S CWt( -118 F,O,S d/dx( -119 GrpDly( -120 [X/(1-X)]( -121 F,O,S F,O,S F,O,S F,O,S F,O,S F,O,S F,O,S SR780 Network Signal Analyzer... - Page 428 The USRC command sets (queries) the real and imaginary parts of User Constant i. The parameter i selects a User Constant from 1 to 5. The parameters x and y are floating point values for the real and imaginary parts. SR780 Network Signal Analyzer...
-
Page 429: Window Commands
The TRWI command copies the real part of stored Trace i to the User window of display d. Trace i must contain stored data. This command is valid only when the Measurement Group is FFT. This command requires display d to be Live. SR780 Network Signal Analyzer... - Page 430 The WSYM sets (queries) User Window Form for display d. The parameter i selects Non-Symmetric (0) or Symmetric (1). This command is valid only when the Measurement Group is FFT and the window of display d is User. SR780 Network Signal Analyzer...
-
Page 431: Waterfall Commands
WVCT (?) d {, i} The WVCT command sets (queries) the Waterfall View Count for display d. The parameter i is a number of records. This command is valid only when the Measurement Group is FFT or Octave. SR780 Network Signal Analyzer... - Page 432 If there is no record j, then an error occurs. WSLC d, i, j The WSLC command saves the waterfall time slice of bin j [0 is left most on x axis] from display d to Trace i [1..5]. SR780 Network Signal Analyzer...
- Page 433 Waterfall Commands 5-67 This command is valid only when the Measurement Group is FFT or Octave and the measurement is paused with waterfall storage on. If there is no bin j, then an error occurs. SR780 Network Signal Analyzer...
-
Page 434: Capture Commands
Same as [Start Capture] key. Capture memory must already be allocated. The Input Source cannot be Playback and the Source cannot be Arbitrary playback from Capture. CSTP Same as [Stop Capture] key. This command has no effect if Capture is not in progress. SR780 Network Signal Analyzer... -
Page 435: Memory Allocation Commands
The MALC command sets the Memory Allocation to i blocks for Capture, j blocks for Waterfall and k blocks for Arbitrary Waveform. The sum of i+j+k cannot exceed the Total Available Memory. The MALC command automatically confirms the allocation. SR780 Network Signal Analyzer... -
Page 436: Data Table Commands
Data Table of the active display may be edited or queried. DCLR d The DCLR command clears the Data Table for display d. The Data Table can not be erased completely. The last remaining line may not be deleted. SR780 Network Signal Analyzer... - Page 437 This command is valid only if the Data Table for display d is On and display d is the active display. Use the ACTD command to select the active display. Only the Data Table of the active display may be edited or queried. SR780 Network Signal Analyzer...
-
Page 438: Limit Test Commands
The parameter i selects the limit segment number from 0 to the last segment. If i exceeds the last segment number (as set by LMAX), an error is reported. The segments are defined separately for each display. The set command is not valid for d=2 (both displays). SR780 Network Signal Analyzer... - Page 439 The LSFT command shifts all Limit Segments for display d. The parameter x is real number. The Y coordinates of all segments are shifted by x (in display units). This command is not valid for d=2 (both displays). This command also sets Limit Segments to Show. SR780 Network Signal Analyzer...
-
Page 440: Marker Statistics Commands
The MSIB ? command queries Min for the Display B Marker. MSEB ? The MSEB ? command queries Mean for the Display B Marker. MSSB ? The MSSB ? command queries Standard Deviation for the Display B Marker. SR780 Network Signal Analyzer... -
Page 441: Exceedance Statistics Commands
Waterfall display is not required to be on. The result is stored in a data trace and has the same measurement type as the waterfall measurements. This command is valid only when the Measurement Group is FFT or Octave. SR780 Network Signal Analyzer... -
Page 442: Disk Commands
MYDATA.DAT. DOS file name conventions must be followed, i.e. file names are 8 characters or less with an optional extension of up to 3 characters. If the extension is omitted, the SR780 uses default extensions. File access is to the current directory. - Page 443 IS recalled. To determine the value of i, start with i=0. For each bit which is 1, add 2 raised to the bit number. For example, SRCL 127 recalls all groups. SRCL 17 recalls only the Measurements (2 =1) and DRAM Settings (2 =16). SR780 Network Signal Analyzer...
- Page 444 The DELD command deletes the current directory. The directory must be empty otherwise no action is taken. If the directory is deleted, the current directory is changed to the directory one level closer to the root. The current directory is specified by FDIR. SR780 Network Signal Analyzer...
-
Page 445: Output Commands
This only affects printing. Plotting only plots the display graphs. PBRI (?) {i} The PBRI command sets (queries) the print density of highlighted areas. The parameter i selects White (0), 6% (1), 12% (2), 25% (3), 50% (4) or Black (5). SR780 Network Signal Analyzer... - Page 446 0 to 30 and should agree with the address of the plotter in use. PCIC (?) {i} The PCIC command sets (queries) the GPIB Control mode. The parameter i selects Host (0) or SR780 (1). PLTX (?) {i} The PLTX command sets (queries) the Plotter Text Pen Number. The parameter i is a pen number from 1 to 8.
- Page 447 The parameter k puts the note in Display A (0) or Display B (1). The parameters l and m are the Text X and Text Y position from 0 to 100. The string s is the note text. The parameters k, l, m and s must always be sent together. SR780 Network Signal Analyzer...
-
Page 448: System Commands
1 to 59. FFMT (?) {i} The FFMT command sets (queries) the Frequency Format. The parameter i selects Exact Bin (0) or Rounded (1). TIME (?) {i, j, k} The TIME command sets (queries) the System Time. SR780 Network Signal Analyzer... - Page 449 The DATE ? command queries the date. A string of the form “MM/DD/YY” is returned. The DATE i, j, k command sets the date to i [1..12] month, j [1..31] day and k [0..99] year. The parameters i, j and k must all be sent. SR780 Network Signal Analyzer...
-
Page 450: Front Panel Commands
This command is valid only when the Measurement Group is FFT or Octave. SVTR d, i The SVTR command saves display d to Trace i. RCTR d, i The RCTR command recalls Trace i to display d. If Trace i does not have data, then an error occurs. SR780 Network Signal Analyzer... - Page 451 This command is only valid if the Marker Mode for display d is Normal. MKMX d The MKMX command performs Marker to Max on display d. (Same as [Marker Max] key). This command is not valid if the Marker of display d is Off. SR780 Network Signal Analyzer...
- Page 452 The SBRI command sets (queries) the Screen Brightness. The parameter i is a brightness level from 150 (dimmest) to 255 (brightest). SCON (?) {i} The SCON command sets (queries) the Screen Contrast. The parameter i is a contrast level from 0 (no contrast) to 90 (most contrast). SR780 Network Signal Analyzer...
- Page 453 [System] [AutoScale A] [AutoScale B] [Span Up] [Span Down] [AutoRange Ch1] [AutoRange Ch2] [Marker Max] [Marker Min] [Marker Ref] [Display Ref] [Marker Center] [Show Setup] [Start/Reset] [Pause/Cont] [Start Capture] [Stop Capture] [Active Display] [Link] [Print Screen] SR780 Network Signal Analyzer...
- Page 454 Sequential TONE commands need to be separated by a pause which is at least as long as the preceding tone. PLAY i The PLAY command plays one of the SR780’s pre-programmed sounds. The parameter i selects a sound from 0 to 6 (most recent TONE). For example, PLAY 2 sounds an alert.
-
Page 455: Data Transfer Commands
Send the command and then make the host computer a listener and the SR780 a talker. Data is returned continuously starting with bin 0 and ending with bin #(length-1). The data points are ASCII real numbers, separated by commas, and the last data point is followed by a terminator. - Page 456 Send the command and then make the host computer a listener and the SR780 a talker. Data is returned continuously starting with bin 0 and ending with bin #(length-1). The data points are ASCII real numbers, separated by commas, and the last data point is followed by a terminator.
- Page 457 IFC will NOT be set until the transfer is complete. Send the command and then make the host computer a listener and the SR780 a talker. The DSWB? d, i returns 4 bytes per bin starting with bin 0 and continuing to bin #(length-1).
- Page 458 (all points are complex) Octave number of displayed bins + 1 (the power bin is the last point) (all points are real, the imaginary parts should all be zero) Swept Sine Number of points in the sweep SR780 Network Signal Analyzer...
- Page 459 OK to begin data transfer. A return of 0 indicates that n is too large for Trace i. Host On receipt of 1 (4-byte binary long int), executes a binary transfer to the SR780 of 2n 4-byte IEEE floats. The order is real part of point 0, imag part of point 0, real part of point 1, imag part of point 1, etc.
- Page 460 OK to begin data transfer. A return of 0 indicates that n is too large for Trace i. Host On receipt of 1 (4-byte binary long int), executes a transfer to the SR780 of 2n ASCII floats. The order is real part of point 0, imag part of point 0, real part of point 1, imag part of point 1, etc.
- Page 461 The uploaded data should be saved in its entirety by the host computer. The saved data can be downloaded back to the SR780 at a later time using TPUT. The TGET and TPUT commands allow a host computer to save and reload a trace buffer without using disks.
- Page 462 Returns 1 (4-byte binary long int) when OK to begin binary transfer to the SR780. Host On receipt of 1 (4-byte binary long int), executes a binary transfer to the SR780 of n bytes (as uploaded using TGET). Asserts EOI with the final byte of the transfer.
- Page 463 SR780. A return of 0 indicates that there is no Arbitrary Waveform memory allocated. Host On receipt of 1 (4-byte binary long int), executes a binary transfer to the SR780 of n bytes (as uploaded using AGET). Asserts EOI with the final byte of the transfer.
- Page 464 SR780. A return of 0 indicates that there is no Capture memory allocated. Host On receipt of 1 (4-byte binary long int), executes a binary transfer to the SR780 of n bytes (as uploaded using CGET). Asserts EOI with the final byte of the transfer.
- Page 465 SR780. A return of 0 indicates that there is no Waterfall memory allocated. Host On receipt of 1 (4-byte binary long int), executes a binary transfer to the SR780 of n bytes (as uploaded using WGET). Asserts EOI with the final byte of the transfer.
-
Page 466: Interface Commands
In the REMOTE state command execution is allowed but the keyboard and knob are locked out except for the [Help/Local] key which returns the SR780 to the LOCAL state. In the LOCAL LOCKOUT state all front panel operation is locked out, including the [Help/Local] key. -
Page 467: Nodal Degree-Of-Freedom Commands
RFNU (?) {i} The RFNU command sets (queries) the number of the reference node. RSDR (?) {i} The RSDR command sets (queries) the response node direction. The parameter i specifies the direction according to the following table: SR780 Network Signal Analyzer... - Page 468 RSNA (?) {s} The RSNA command sets (queries) the name of the reference node. The name may be up to 6 characters long. RSNU (?) {i} The RSNU command sets (queries) the name of the reference node. SR780 Network Signal Analyzer...
-
Page 469: Status Reporting Commands
Serial Poll status, the condition which causes it to be set must be cleared. For the INST, DISP, INPT, IERR or ESB bits, this is accomplished by clearing the enabled status bits in the Instrument, Display, Input, Error or Standard Event status words (by reading them). SR780 Network Signal Analyzer... - Page 470 Instrument status enable register, bit 0 (INST) of the Serial Poll status word is set. This causes an SRQ if bit 0 in the Serial Poll enable register is set. To clear a bit in the Instrument status word, use INST?. SR780 Network Signal Analyzer...
- Page 471 INPS? clears the entire word while INPS? i clears just bit i. INPC ? i The INPC? command queries the current overload condition of input i. The parameter i selects Ch1 (0) or Ch2 (1). INPC? returns a value from 0 to 3. SR780 Network Signal Analyzer...
- Page 472 HighV INPC? always returns the current condition. If an overload occurs and goes away, INPC? will not detect it. Use the status words to detect momentary changes in the overload state. SR780 Network Signal Analyzer...
-
Page 473: Status Word Definitions
A bit stays set as long as the status condition exists. When reading the status using a serial poll, the SRQ bit signals that the SR780 is requesting service. The SRQ bit will be set (1) the first time the SR780 is polled following a service request. - Page 474 Standard Event Status Word Name Set when unused unused Too many responses are pending Too many commands received at once Command cannot execute successfully Command syntax error A key is pressed or the knob rotated Power is turned on SR780 Network Signal Analyzer...
- Page 475 Display B 1-shot Waterfall has finished 14-15 unused The Display status bits stay set until read by DSPS?. They are also cleared by the *CLS command. Use DSPE to set bits in the Display status enable register. SR780 Network Signal Analyzer...
- Page 476 RAM memory test fails ROME ROM memory test fails VIDE Video memory test fails HELPE Help memory test fails DSDE DSP data memory test fails DSPE DSP program memory test fails DSRE DSP DRAM memory test fails SR780 Network Signal Analyzer...
- Page 477 The Error status bits stay set until read by ERRS?. They are also cleared by the *CLS command. Use ERRE to set bits in the Error status enable register. Bits 7-12 are set by the power on tests. Bits 3-5 are set in the [System]<Diagnostics>. SR780 Network Signal Analyzer...
-
Page 479: Example Program
Terminate Read on EOS: Once all the hardware and GPIB drivers are configured, use “IBIC”. Use “IBWRT” and IBRD” to send to and receive from the SR780. If you cannot talk to the SR780 via “IBIC”, then your programs will not run. - Page 480 (void); /* ***************************************************** */ void main (void) // **************************************************** // You can see the commands received and responses generated by the SR780 // by using [System]<Remote><View Qs> to display the interface buffers // on the screen. // **************************************************** int i, mode, type, number, nlen;...
- Page 481 // ****** initialize your GPIB card here ****** initialize (21,0); //controller settimeout (7500); //GPIB timeout to 7.5 seconds // ****** Set the SR780 output interface to GPIB!! ****** TxSr780 ("*CLS"); //clear all status words TxSr780 ("OUTX0"); //direct SR780 responses to GPIB interface...
- Page 482 ("Loading Arb buffer..."); TxGpib (sr780,"ALOD? 2048"); //use TxGpib so we don't wait for IFC //SR780 will return a binary 1 to acknowledge transmit("mla talk 10",&status); //make SR780 a talker, pc a listener rarray (&ack, 4, &length, &status); //binary read 4 bytes (long int) //return value should be 1 printf ("%d bytes recvd [val=%ld]...",length,ack);...
- Page 483 // First 33 bins are the spectrum, last bin is the Total Power bin. // All points are complex. // For an octave measurement, the imaginary parts are all zero. transmit("mta listen 10",&status); //make SR780 a listener, pc a talker for (i=0; i<33; i++) { //download 33 octave bins sprintf (cmd,"DATA '%lf, '", octreal);...
- Page 484 /* ********************************************************************* */ void TxSr780 (char *command) // Send command to the SR780 and wait until IFC (bit7) is set in // the Serial Poll status (indicating that the command is finished). TxGpib (sr780,command); // send command to sr780 address WaitIFC ();...
- Page 485 (stb&32) { // If ESB bit set, // there must be a command error in the Standard Event status word. // Handle command errors here. TxGpib (sr780, "*ESR?"); //clear the Standard Event status word GetGpib (sr780); printf ("\nEXE error\n"); GetSpace ();...
- Page 486 // clear the keyboard buffer printf ("\n<Space> to continue, <Q> to quit "); do { ch = (char) getch (); if ((ch == 'q')||(ch =='Q')) exit(0); // exit while (ch!=' '); // continue printf ("\n"); /* ******************************************************************* */ SR780 Network Signal Analyzer...
- Page 487 Using SRTRANS to Convert Files to .78C to ASCII Using SRTRANS to Convert Files to .78D to MAT-file Using SRTRANS to Convert Files to .78D to Universal File Format Using SRBUF to Convert ASCII to .78C Using SDFTOSR to Convert SDF to .78D SR780 Network Signal Analyzer...
-
Page 488: Why File Conversion
SR780 for display and comparison. In order to meet both these needs the SR780 is shipped with a file conversion program designed to import and export data as flexibly as possible Stanford Research Systems is committed to supporting as many file formats as possible- as a result we are constantly adding new formats. -
Page 489: Supported External File Types
Four different file types are currently supported by the SR780 file conversion utilities. ASCII Files ASCII files consist of plain ASCII text. ASCII files written by the SR780 file conversion utilities consist of an alphanumeric header with instrument setup information followed by a number of columns of data values. -
Page 490: Sr780 File Types
Buffers: .78C and .78W Files The SR780 uses 4 user-allocable buffers to store large amounts of data. These are the Channel 1 capture buffer, the Channel 2 capture buffer, the waterfall buffer, and the arbitrary waveform buffer. -
Page 491: Using The File Conversion Utility
Using the File Conversion Utilities Using the File Conversion Utility The disk supplied with the SR780 contains the conversion utilities. SRTRANS.EXE converts .78D files to ASCII, MAT-File and UFF formats as well as converting .78W and .78C files to ASCII only. - Page 492 An example of a piece of a converted .78C file follows: Time: 14:17:26 Date 7/23/96 Length: 2 kPts Base Freq: 102.4 kHz Sampling Freq: 262.1 kHz Input Range Ch1: 0 dBv Input Range Ch2: 0 dBv -0.4461670 -0.4826355 -0.4906464 -0.4691315 -0.4194641 -0.3446960 -0.2493286 -0.1390076 SR780 Network Signal Analyzer...
- Page 493 Using the File Conversion Utilities Using SRTRANS to Convert .78D to MAT-File SRTRANS infile [outfile] /M inflie specifies the name of the .78D filename. Both the filename and extension must be explicitly specified. outfile optionally specifies the name of the output .MAT output file. If outfile is omitted an output file with the same name as the input file and an extension of ‘MAT’...
- Page 494 I to floppy format with the SRMERG utility. The remainder of the switches allow the user to set information in the capture header corresponding to the file. /Bn specifies the Base Frequency. 0=100 kHz, 1-102.4 kHz SR780 Network Signal Analyzer...
- Page 495 SDF file to be converted. outfile specifies the name of the converted .78D file. /Vn specifies the version of your SR780 instrument. You can find the version number of the instrument by pressing the [system]<Show Version> softkey on the SR780. For example use /V109 for SR780 version 109.
- Page 496 USB drive must be formatted by the SR780/SR785 for the instrument to recognize the drive. The USB drive installed in the SR780/SR785 has the capacity to create multiple drives. There are two buttons on the far left of the drive. The right button increments the drive number by one. The left button increments the drive number by 10.
- Page 497 The next photo shows the drive being formatted to 31. The SR780/SR785 can now retrieve data and settings from drive 000 (if the drive is set to 000) and it can retrieve data from drive 031 (if the drive is set to 031).
Need help?
Do you have a question about the SR780 and is the answer not in the manual?
Questions and answers