Table of Contents
Advertisement
Quick Links
Texas Instruments Calculator Basics
Tips, Techniques, and Graphing
TI-83-Plus Calculator Basics
Tips and Techniques
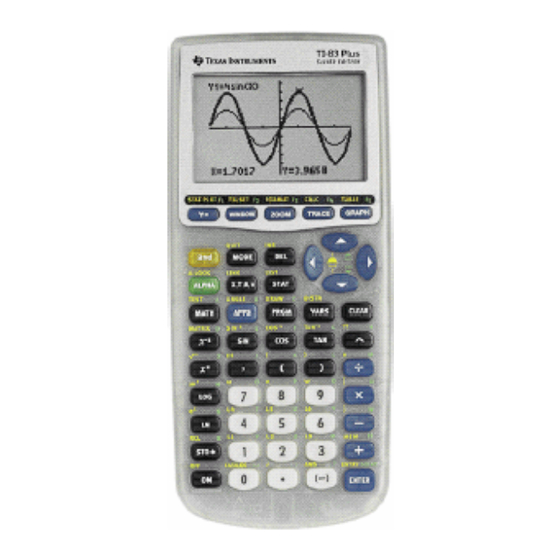
TI-83 Plus Keyboard
Generally, the keyboard is divided into these zones: graphing keys, editing keys,
advanced function keys, and scientific calculator keys.
Graphing — Graphing keys access the interactive graphing features.
Editing — Editing keys allow you to edit expressions and values.
Advanced — Advanced function keys display menus that access the
advanced functions.
Scientific — Scientific calculator keys access the capabilities of a
standard scientific calculator.
Using the y and ƒ Keys
The secondary function of each key is printed in yellow above the key. When you press
the yellow y key, the character, abbreviation, or word printed in yellow above the
other keys becomes active for the next keystroke. For example, when you press y
and then , the
menu is displayed. This guidebook describes this keystroke
TEST
combination as y [
.
TEST]
The alpha function of each key is printed in green above the key. When you press the
green ƒ key, the alpha character printed in green above the other keys becomes
active for the next keystroke. For example, when you press ƒ and then , the
letter
is entered. This guidebook describes this keystroke combination as ƒ [
].
A
A
©Billings Adult Education Center, 2004
Page 1
Advertisement
Table of Contents

Related Manuals for Texas Instruments TI-83-Plus


Summary of Contents for Texas Instruments TI-83-Plus
- Page 1 Texas Instruments Calculator Basics Tips, Techniques, and Graphing TI-83-Plus Calculator Basics Tips and Techniques TI-83 Plus Keyboard Generally, the keyboard is divided into these zones: graphing keys, editing keys, advanced function keys, and scientific calculator keys. Graphing — Graphing keys access the interactive graphing features.
-
Page 2: Setting The Display Contrast
Texas Instruments Calculator Basics Tips, Techniques, and Graphing Setting the Display Contrast You can adjust the display contrast to suit your viewing angle and lighting conditions. The TI-83 Plus retains the contrast setting in memory when it is turned off. To adjust the contrast, follow these steps: 1. -
Page 3: Storing Values In A Variable
Texas Instruments Calculator Basics Tips, Techniques, and Graphing TI-83 Plus Edit Keys | or ~ Moves the cursor within an expression; these keys repeat. } or † Moves the cursor from line to line within an expression that occupies more than one line; these keys repeat. -
Page 4: Displaying A Menu
Texas Instruments Calculator Basics Tips, Techniques, and Graphing To store a value to a variable from the home screen or a program using the ¿ key, begin on a blank line and follow these steps. 1. Enter the value you want to store. -
Page 5: Defining A Graph
Texas Instruments Calculator Basics Tips, Techniques, and Graphing The following shows the menus: The following shows the y [ ] menus: TEST Graphing Defining a Graph To define a graph in any graphing mode, follow these steps. Some steps are not always necessary. - Page 6 Texas Instruments Calculator Basics Tips, Techniques, and Graphing • The TI-83 Plus has four graphing modes: Func (function graphing), Par (parametric), Pol (polar), and Seq (sequence). • Float or 0123456789 (fixed) decimal mode affects displayed graph coordinates. • Radian or Degree angle mode affects interpretation of some functions.
- Page 7 Texas Instruments Calculator Basics Tips, Techniques, and Graphing Turning On or Turning Off a Stat Plot in the Y= Editor To view and change the on/off status of a stat plot in the editor, use Plot1 Plot2 Plot3 (the top line of the editor).
-
Page 8: Exploring Graphs With Trace
Texas Instruments Calculator Basics Tips, Techniques, and Graphing 4. PressÍ repeatedly to rotate through the graph styles. The seven styles rotate in the same order in which they are listed in the table above. 5. Press ~, † or }. when you have selected a style. - Page 9 Texas Instruments Calculator Basics Tips, Techniques, and Graphing screen. The cursor coordinates are displayed at the bottom of the screen if CoordOn format is selected. The Y= expression is displayed in the top-left corner of the screen, if ExprOn format is selected. To move the trace cursor, press | or ~. To move the trace cursor from function to function, press } or †.
Need help?
Do you have a question about the TI-83-Plus and is the answer not in the manual?
Questions and answers