Sharp EL-9650 Operation Manual
Graphing scientific calculator
Hide thumbs
Also See for EL-9650:
- Operation manual (28 pages) ,
- User manual (37 pages) ,
- Handbook (60 pages)

Related Manuals for Sharp EL-9650


Summary of Contents for Sharp EL-9650
- Page 1 MODEL EL-9650 GRAPHING CALCULATOR OPERATION MANUAL SHARP CORPORATION 00BUP (TINSE0397THZZ) PRINTED IN CHINA / IMPRIMÉ EN CHINE...
- Page 2 This equipment complies with the requirements of Directive 89/ 336/EEC as amended by 93/68/EEC. Dieses Gerät entspricht den Anforderungen der EG-Richtlinie 89/336/EWG mit Änderung 93/68/EWG. Ce matériel répond aux exigences contenues dans la directive 89/336/CEE modifiée par la directive 93/68/CEE. Dit apparaat voldoet aan de eisen van de richtlijn 89/336/EEG, gewijzigd door 93/68/EEG.
- Page 3 NOTICE • The material in this manual is supplied without representation or warranty of any kind. SHARP assumes no responsibility and shall have no liability of any kind, consequential or otherwise, from the use of this material. • SHARP strongly recommends that separate permanent written records be kept of all important data.
-
Page 4: Table Of Contents
CONTENTS GETTING STARTED ....................... 1 1. Names of Parts ......................1 2. Function of Each Part ....................2 3. Explanation of Keys ....................3 4. Using the Protective Cover ..................4 5. When Using for the First Time ................... 5 (1) Inserting batteries .................... - Page 5 14. Resetting the Calculator ..................34 (1) Reset ........................34 (2) Using the reset switch ..................34 (3) Select RESET from the menu ................35 CHAPTER 2 UNIQUE FUNCTIONS ................37 1. Pen-touch Operations ..................... 37 (1) Using the touch-pen on the menu screen ............37 (2) Using the touch-pen on the normal function calculation screen ......
- Page 6 CHAPTER 4 GRAPHING FUNCTIONS ................ 79 1. Function Graphing Procedures ................79 2. Graph Modes ......................79 3. Rectangular Coordinate Graphing ................80 (1) Setting the rectangular coordinate graph mode ..........80 (2) Checking the format (See page 97 for details.) ..........80 (3) Entering a function (See page 98 for details.) ............
- Page 7 3. Calculations Using Special Matrix Functions ............139 (1) OPE ......................... 139 (2) MATH ....................... 143 (3) Calculation using [ ] ..................144 CHAPTER 6 LIST FUNCTIONS ................145 1. List Calculations Using List Number ..............146 2. Drawing a Function Graph Using a List ..............148 3.
- Page 8 CHAPTER 9 SOLVER FUNCTION ................211 1. Inputting an Equation and Finding Its Solution ............211 2. Selecting the Solution Analysis Method ..............213 (1) Newton’s method ..................... 214 (2) Graph method ....................215 3. Registering an Equation ..................217 4.
- Page 9 7. Error Messages ..................... 254 8. Sample Program ....................254 (1) Conversion of temperatures from Celsius to Fahrenheit ......... 254 (2) Random substitution of numbers ..............256 CHAPTER 13 OPTION FUNCTIONS ................. 259 1. Adjusting Screen Contrast ..................259 2. Checking Memory Usage ..................259 3.
- Page 10 viii...
-
Page 11: Getting Started
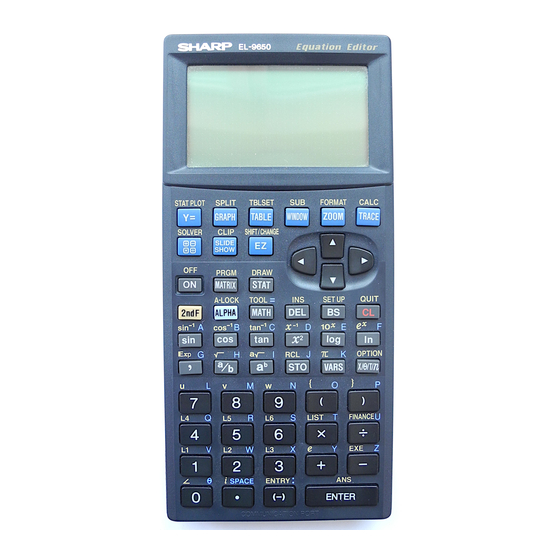
GENERAL INFORMATION GETTING STARTED 1. Names of Parts Graphing keys Display screen Normal function calculation screen Power supply ON/OFF selection key ST STAT PLOT SPL I T TBLSET FORMAT CALC Alphabet specification SOLVER CL IP SHIFT CHANGE Cursor movement keys Secondary function PRGM DRAW... -
Page 12: Function Of Each Part
GETTING STARTED 2. Function of Each Part ˚ Ï Display screen Power supply ON/OFF key: Press to turn on the power supply. Press to turn off the power supply. Cursor movement keys: Specifies location to input/correct characters and num- bers. The cursor is indicated using “_” when there is no number or character. The cursor is indicated using a flashing “... -
Page 13: Explanation Of Keys
GETTING STARTED Graph related keys: Various settings for graphing can be made using the group of keys indicated in the box. • : Used to open the formula input screen for drawing graphs. • : This function is used for studying graphs and to aid understanding. (For details, see page 221.) •... -
Page 14: Using The Protective Cover
GETTING STARTED 4. Using the Protective Cover To open the cover: When in use: When not in use: CAUTION Be careful not to drop the touch-pen when removing the unit from its protective cover. -
Page 15: When Using For The First Time
GETTING STARTED 5. When Using for the First Time (1) Inserting batteries 1. Open the battery cover located on the back of the unit. To remove the battery cover, pull down on the tab then lift up. 2. Insert batteries as shown in the diagram to the right. -
Page 16: Resetting The Calculator
GETTING STARTED (2) Resetting the calculator 1. Press the RESET switch located on the back of the unit to clear all data within the calculator’s memory. • A “WAIT” display will appear momentarily when ¬ pressing the RESET switch. When the display disappears, the screen shown to the right will appear. -
Page 17: Turning The Power Off
GETTING STARTED Ï ˙ (4) Turning the power off Press to turn the power off. Regarding the automatic power-off function: The power supply is automatically turned off when there is no operation for a period of approximately 10 minutes to save battery consumption (the time varies by a few minutes according to use). -
Page 18: Caring For Your Calculator
Raindrops, water spray, juice, coffee, steam, perspiration, etc. will also cause malfunction. Clean with a soft, dry cloth using no solvents. Do not use a sharp pointed object or exert too much force when pressing keys. Avoid excessive physical stress. -
Page 19: Chapter 1 General Information
GETTING STARTED CHAPTER 1 GENERAL INFORMATION This chapter describes the basic key operations (input rules) of the calculator. The procedures described here show how to perform calculations with common math functions. This chapter also explains the main set-up functions (mode settings). —... -
Page 20: Common Math Operations
CHAPTER 1 2. Common Math Operations The calculator can be used in the same way as a standard calculator for calculations using common math operations. ¬ ( <Example> To obtain the answer of “(100+256)×2÷85–9” ® Press Press to execute the calculation. The result of the calculation appears on the right side of the display below the expression. -
Page 21: Changing Entered Characters And Expressions
GENERAL INFORMATION 3. Changing Entered Characters and Expres- sions To change a character or expression before executing the calculation, follow the procedure below. Move the cursor to the location for correction. The new content will be inserted to the left of the cursor when entered (during Equation edit mode). Move the cursor to the character or expression to be changed, and enter a new character or expression. -
Page 22: Correcting Errors
CHAPTER 1 4. Correcting Errors When an error is generated, the calculator displays an error message (examples shown below), and stops operating. The method of correcting an error varies depending on the error code. Example A: This display indicates that a syntax error has occurred. -
Page 23: Using Functions
GENERAL INFORMATION 5. Using Functions The following shows an example of a calculation using functions that are directly accessible from the keys (functions indicated on keys and secondary functions). ;Ï <Example> × 3 To obtain the answer of “ ” 275 >>... -
Page 24: Using Secondary Functions (2Ndf) And Alphabet Letters (Alpha)
CHAPTER 1 6. Using Secondary Functions (2ndF) and Ï Å Alphabet Letters (ALPHA) Ï Å • The functions and characters printed to the left and right sides above the keys become active for the next keystroke when is pressed. Ï Å... -
Page 25: Using Menus
GENERAL INFORMATION 7. Using Menus This calculator is equipped with function menus that allow many functions other than those printed on the keys and main unit to be used. These additional functions are grouped by function type and item type. Calculations and mode settings can be executed by selecting appropriate functions. - Page 26 CHAPTER 1 • “ ” and “ ” symbols indicate that there are more items before and after those currently shown on the display. • Press ≥≥≥ (3 times). The display should look like the one shown on the right. When the screen no longer shows the “...
- Page 27 GENERAL INFORMATION <Example> ≥ To use the “int” function to obtain a whole number (The “int” function is in the [B NUM] sub-menu of the MATH menu.) 1. Press to open the MATH menu. (or select [B NUM] using ≥ or the 2.
-
Page 28: Operating Modes
CHAPTER 1 8. Operating Modes • The EL-9650 has many modes and commands that are related to the display method of equations, graphs, lists, calculation results and key input • Expected results cannot be obtained when errors are made in the default settings. •... -
Page 29: Precedence Of Calculations
GENERAL INFORMATION 9. Precedence of Calculations • This unit is equipped with a function that detects calculation precedence. • The calculation precedence is as follows: Fraction calculations (a/b) Complex angles (∠) –1 Single calculation functions immediately before a numerical value (X , !, °, ◊... -
Page 30: Set Up Menu
CHAPTER 1 10. SET UP Menu • SET UP is a function that sets input and display methods. • Please select each method according to use. • Be sure to set the SET UP mode according to desired calculations and graph plotting since there may be differences in the results depending on the set conditions of SET UP. - Page 31 GENERAL INFORMATION The units of angle are according to the ones chosen in the SET UP. Be careful since the calculation results may differ unless the angle units are set properly. ¬ <Example> Calculate “sin π/4” using the Rad mode. Ï...
- Page 32 CHAPTER 1 [C FSE]: Used to set the display method of calculation results (default setting: FloatPt) [1 FloatPt]: Floating point method [2 Fix]: Fixed decimal point method ✳✳ [3 Sci]: Exponential method (✳✳✳E [4 Eng]: Engineer’s exponential method (exponentials are in multiples of 3: ✳✳✳E ✳✳...
- Page 33 GENERAL INFORMATION ¬ <Example> This example shows the difference of the formula input screen for polar coordinates and rectangular coordinates. 1. Press Ï 2. Press . (Keys to be used when inserting functions or writing subsequent details.) 3. Press Formula input screen of rectangular coordinates 4.
- Page 34 CHAPTER 1 <Example> This example shows the differences in the display method of results for decimals and improper fractions using “1 / 3”. Ï NOTE The SET UP condition for B to E is Rad, FloatPt, 9, and Rect respectively. (Check that [F ANSWER] is set to decimal (real).) ¬...
-
Page 35: Edit Modes
GENERAL INFORMATION 11. Edit Modes Expressions can be entered either by the one-line input method or the equation input method. In the one-line edit mode, the EL-9650 is used in the same way as a standard scientific calculator. The equation edit mode allows entries of fractions and functions such as powers, roots and constants in a straightforward sequence. - Page 36 CHAPTER 1 Of these, the sizes of the parentheses ( ) and brackets [ ] will be changed depending on the equation. The sizes of other function indications are the same as those displayed in the one-line edit mode. <Example> Ï...
- Page 37 GENERAL INFORMATION <Example> ¬ To enter the expression “ ”, and move the cursor. (SET UP F and G setting: Mixed (Real) and Equation) ® 3 > Press → When the key is pressed, the calculation result is displayed.
- Page 38 CHAPTER 1 ¬ <Example> ”, and move the cursor. Here, we will input “ ” first and then “ 1. Press 2. Press <<<<. 3. Press 1 “1+” is inserted. ¬ +Ï 4. Press 7 > 5. Press <<<<<. 6. Press 2 “2×”...
- Page 39 GENERAL INFORMATION • Parentheses are automatically placed when inputting structured functions such as x , etc. (with the exception of abs). The following eight types of functions are enclosed within parentheses: a/b, , ∫dx (integral functions) ¬ <Example> 6 >. Press Input →...
- Page 40 CHAPTER 1 Examples for inputting structured functions are shown below. For all other functions, the operation will be the same as the one line input method. Ï 2 > a / b: 5 Ï 1 2 1> 2 6 > Ï...
-
Page 41: One-Line Edit Mode
GENERAL INFORMATION (2) One-line edit mode Expressions are entered with number keys, common math function keys and other function keys in the same manner as with a standard calculator. The screen displays a maximum of eight lines for an expression and a calculation result. -
Page 42: Display Format Of The Cursor Pointer
CHAPTER 1 12. Display Format of the Cursor Pointer • The display format for the cursor pointer depends on the mode settings and screens, even when performing the same operations. • The conditions and display formats are as follows: Whole character Half-character Normal input Edit... -
Page 43: Moving The Cursor
GENERAL INFORMATION 13. Moving the Cursor (1) Moving the cursor horizontally (<>) The cursor can be moved along the input line. It is also possible to switch from the main menu to the sub-menu and vice versa in the menu screen. The cursor moves one digit at a time for numbers and characters. -
Page 44: Resetting The Calculator
The reset switch is located on the back of the unit. 1. Press the reset switch on the set screen. * Use the enclosed touch pen to press the reset switch. Do not use sharp points such as mechanical pencils, as this may damage the switch. -
Page 45: Select Reset From The Menu
GENERAL INFORMATION (3) Select RESET from the menu This reset function is used when deleting all memory data at one time or when initializ- ing settings with memory undeleted (SET UP setting contents, etc.). There are two types of resetting: default set: This reset function initializes only the settings, but does not delete the memory. - Page 46 CHAPTER 1...
-
Page 47: Chapter 2 Unique Functions
UNIQUE FUNCTIONS CHAPTER 2 UNIQUE FUNCTIONS This section explains the unique functions of the EL-9650. • Pen-touch Operations • Solver Function (For details, see CHAPTER 9 on page 211.) • SLIDE SHOW Functions (For details, see CHAPTER 10 on page 221.) •... - Page 48 CHAPTER 2 3. Touch [D CONV] of the main menu using the attached pen. Check to see that the screen changes to that shown on the right ([D CONV] is highlighted, and sub-menu items of [D CONV] are shown on the right). 4.
- Page 49 • Always use the attached touch-pen when using the touch-pen operation. Using metal or sharp objects will scratch the screen and may result in malfunctions. • Because there will be a minor difference in the actual display area and the touch...
-
Page 50: Using The Touch-Pen On The Normal Function Calculation Screen
CHAPTER 2 (2) Using the touch-pen on the normal function calculation screen <Example> The touch-pen operation for changing the “3” of entered “56 × 32” to “4” is explained ¬ here. 1. Initialize the screen. Press 2. Input using manual key entry. 3. - Page 51 UNIQUE FUNCTIONS 2. This will display the previous formula one line below the answer (the cursor is positioned in a location before the calculation). ® 3. Select “5” using the touch-pen as above. Change the number to “3” then press to execute calculation.
-
Page 52: Using The Touch-Pen On The Graph Screen
CHAPTER 2 (3) Using the touch-pen on the graph screen • In the graph screen, it is possible to easily set the direction and amount of graph shifting using the SHIFT/CHANGE function, etc. as described later, specify tracing locations, and enlarge and reduce screens using the touch-pen operation. •... - Page 53 UNIQUE FUNCTIONS When the graph is in the normal mode (non-trace mode): • : Press anywhere and “ ” will appear with the first pen-touch. • The cursor pointer will appear in a point (fixed)* within “ ” with the second pen- touch to the same area.
-
Page 54: Using The Touch-Pen On Other Screens
CHAPTER 2 (4) Using the touch-pen on other screens • Pen-touch input is valid for most screens not mentioned previously, such as the menu screen, normal function calculation screen and graph screen. • On screens similar to that of the menu screen (screens that require selection of set window modes such as Rapid zoom, etc.), list correction, etc., pen-touching will highlight the selected item as with main screen selection method. -
Page 55: Solver Function
UNIQUE FUNCTIONS 2. Solver Function • The EL-9650 is equipped with a solver function that allows a known variable to be input to solve an unknown variable. Hence it is possible to solve an equation using various variables. • Only real numbers may be used in the solver function. <Example>... -
Page 56: Slide Show Function
CHAPTER 2 3. SLIDE SHOW Function The EL-9650 is equipped with commonly used formulas and graph screens to help understand the relationship between functions and graphs. (1) Viewing the installed demonstration screen • Let’s view the installed equation “Y= ”. ®... -
Page 57: Shift/Change Functions
UNIQUE FUNCTIONS For details on the slide show function, see CHAPTER 10 on page 221. 4. SHIFT/CHANGE Function As with the slide show function, the EL-9650 is installed with a shift function. The shift function allows the installed equations and graph data to be displayed in order to view changes in graphs and formulas when shifting. -
Page 58: Change Function
CHAPTER 2 The dotted lines (..) on the screen indicates the graph “Y=X ”. (Previous graph). ® * Graphs of registered equations are indicated using dotted lines (the first formula is automatically registered at the point when selecting “Y=X ”). 5. -
Page 59: Chapter 3 Manual Calculations
MANUAL CALCULATIONS CHAPTER 3 MANUAL CALCULATIONS Calculations using common math functions (addition, subtraction, multiplication and division) ¬ Follow the steps described below before performing a calculation. Press to set to the normal function calculation mode. Press to clear the display. Ï... - Page 60 CHAPTER 3 • If an answer is smaller than 1 (0.XXX...), the zero (0) indication in the first digit left of the decimal point is omitted on the display. • All calculations inside parentheses ( ) are completed first. — In example 3 above, if the parentheses were omitted, the calculation result would be the same as that of example 2.
-
Page 61: Function Calculations
MANUAL CALCULATIONS ¬ 2. Function Calculations • Press to set to the common function calculation mode. Press to clear display. • Check to make sure that the SET UP settings are as shown on CHAPTER 1 “10.SET UP Menu” on page 20. •... -
Page 62: Input Examples Of Functions Accessible Directly From Keys
CHAPTER 3 (1) Input examples of functions accessible directly from keys Example Key operations Answer [B DRG] in SET UP must be sin 56 = .829037572 changed to Deg [B DRG] in SET UP must cos ( .707106781 be changed to Rad [B DRG] in SET UP must tan 150 = be changed to Grad... -
Page 63: Functions Selected From Menus (Math Menu)
MANUAL CALCULATIONS ≥ (2) Functions selected from menus (MATH menu) 1. Press 2. Functions are grouped in the main menu, as shown below. ® In each group, functions are further divided into sub-menus. ® To select a function from a menu, move the cursor to the selected function, and press or touch the function name with the touch-pen. - Page 64 CHAPTER 3 • The following table shows an input example for each function. (The examples show only typical key operations. ≤, ≥, < and >, but the touch-pen may also be used.) (See the list in APPENDIX “6. Explanation of EL-9650 menus” for the explanation of functions on page 284.) ≥...
- Page 65 MANUAL CALCULATIONS ≥ A 0 9 ® Example Key operations Answer Trigonometric function: 1.103377919 ≥ A 1 0 ® sec25 (Equation secx = ) (Angle mode:Deg) Trigonometric function: 1.154700538 ≥ A 1 1 ® csc60 (Equation cecx = ) (Angle mode:Deg) Trigonometric function: 3.732050808 ≥...
- Page 66 CHAPTER 3 ≥ B Common function menu (B) [B NUM]: • Check the menu. Press to display the screen shown on the right. • There are a total of nine options in the NUM menu. (See the list in APPENDIX “6. Explanation of EL- 9650 menus”...
- Page 67 MANUAL CALCULATIONS In the NUM menu, it is possible to input expressions, lists and variables, in addition to numeric values. However, numeric values must be entered for the variables. For example, if list L1 contains {1, 2}, and list L2 contains {2, 3}, the following solution ) →...
- Page 68 CHAPTER 3 ≥ C Common function menu (C) [C PROB]: • Check the menu. Press to display the screen shown on the right. • There are a total of four options in the PROB menu. (See the list in APPENDIX “6. Explanation of EL-9650 menus”...
- Page 69 MANUAL CALCULATIONS Decimal/sexagesimal degree conversion [D CONV]: It is possible to convert numerical values between decimals (degrees) and sexagesimal (degrees, minutes, seconds). →deg: Converts sexagesimal (degrees, minutes, seconds) to decimals (degrees). →dms: Converts a numerical values as decimals to sexagesimal (degrees, minutes, seconds) (Seconds can be entered up to Sexagesimal display: OO°...
- Page 70 CHAPTER 3 ≥E1 ≥2 ≥ 3≥D1® Example Key operations Answer (Sexagesimal →decimal 25.755 ≥ conversion): ≥ Convert 25°45’18” to • You may omit selecting for min. and decimals (degrees). sec., since equivalent screen of will appear after opening the ≥D2® [E ANGLE] for the first time to enter degrees, minutes and seconds.
- Page 71 MANUAL CALCULATIONS Using angle conversion and others: The calculator has 3 angle modes: Deg (degree), Rad (radian) and Grad (gradient). ≥ Correct calculation results cannot be achieved unless using the correct input method for each of the modes. ≥ This calculator is equipped with a calculation function ( [E ANGLE]) that allows the use of these mode without changing settings.
- Page 72 CHAPTER 3 1. Rectangular coordinates → Polar coordinates xy→r (:finds polar coordinate r from rectangular coordinates (x,y) xy→θ (:finds polar coordinate θ from rectangular coordinates (x,y) Conversion formulas: The following scopes are used to find θ Deg mode: 0 |θ| π...
-
Page 73: Binary, Octal, And Hexadecimal Calculations
MANUAL CALCULATIONS 3. Binary, Octal, and Hexadecimal Calculations In addition to the normally used numerical expression of decimals, binary, octal, and hexadecimal numerical expressions may be used. This calculator allows conversions and calculations using the four rules of arithmetic and boolean operations of numerical values expressed in decimals, binary, octals, and hexadecimals (1) Binary, octal, decimal and hexadecimal numbers Decimal (DEC):... -
Page 74: Binary, Octal, Decimal And Hexadecimal Conversion
CHAPTER 3 (3) Binary, octal, decimal and hexadecimal conversion Ï A® 1. Press to set to the standard function calculation Initial cursor position mode. 2. Press to display listing of numerical expressions. Conversions can be made while in this screen by inputting numerical values at the location of the flashing cursor. -
Page 75: Binary, Octal, And Hexadecimal Calculations (Arithmetic Calculations)
MANUAL CALCULATIONS • Decimals are not used for modes other than the DEC mode ( is inoperable). • When converting numerical values with decimals to binary, octal, or hexadecimal, decimals are discarded and only the integers are converted. • When numerical values of binary, octal, and hexadecimal modes are negative, the display is switched to complements of 2. - Page 76 CHAPTER 3 Octal calculation: Ï A® <Example> ® Calculate “42 ÷ 6” in base 8. ≥≥ 42 Press Ï A® ® Calculate “35 ÷ 6” in base 8. ≥≥ 35 Press Hexadecimal calculation: Ï A® ® <Example> Calculate “2FF–25”. Press Ï...
-
Page 77: Test Functions
MANUAL CALCULATIONS 4. Test Functions Using the inequality expressions, (=, ≠, >, ≥, <, ≤), value A and value B are compared, “1” is returned for true and “0” is returned for false. Real numbers, equations or lists can be used for value A and value B. For matrices, only “=”... - Page 78 CHAPTER 3 Ï A® ≥1 Example Key operations Display ® Binary: using “and” ≥≥≥ 1011 for 1011 and 101 Ï A® ® ≥2 Hexadecimal: using “or” for 5A and E2 Ï A® ≥ 3 ® ≥ Binary: using “not” ≥≥ for 101110 101110 Ï...
-
Page 79: Calculations Using Complex Numbers
MANUAL CALCULATIONS 6. Calculations Using Complex Numbers • To execute calculations using complex numbers, select Ï F 4 sub-menu item [4 x ± yi] or [5 r θ] within [F ANSWER] in the SET UP menu screen. • The initial screen for the complex number calculation mode is the same as for the real number mode. -
Page 80: Usable Functions (Menus) For Complex Numbers
CHAPTER 3 (2) Usable functions (menus) for complex numbers Some of the functions within menu screens can be used for complex numbers, including abs, ipart, fpart, etc. (For details, see table on page 282, APPENDIX “6. Explanation of EL-9650 menus”, describing usable functions in the complex number mode according to menus of this calculator.) ≥B1... - Page 81 MANUAL CALCULATIONS Calculations can also be performed. ≥H1( Ï <Example> Ï ))® Find the complex conjugate of “(5+2i) × (3–4i)”. Press [real(]: finds real part of a complex number in polar form <Example> ≥H2 ϯ Find real part of polar coordinates “15 30” (angle )®...
-
Page 82: Convenient And Useful Functions
CHAPTER 3 7. Convenient and Useful Functions (1) Last entry function • The EL-9650 is equipped with a temporary memory area that stores expressions entered for calculation. • Expressions that have been executed are stored in an executing order until the temporary memory becomes full. -
Page 83: Continuing Calculations Using Last Answer
MANUAL CALCULATIONS Ï 2. The expression “15 ÷ 3” evaluated before the previous one is displayed at the bottom of the display. Press 3. The expression “6 × 3 + 2” evaluated before the Ï expression “15 ÷ 3” is recalled and displayed at the location of “15 ÷... -
Page 84: Memory Calculations
CHAPTER 3 ® <Example 3> Pressing after executing a calculation replaces the contents in Ans with the ® latest results and continues calculation. After executing “3+1”, proceed with “2 × Ans”. j Ï ® 1. Press “Ans=4” is stored in memory. ®... - Page 85 MANUAL CALCULATIONS * To clear memory contents, store “0” to the memory space. Î Å ® <Example 2> Clear contents of memory C. Press 0 Å To recall memory, may be used. <Example 3> Ï Å ® Recall memory A and B with stored data from example 1 (A = 36 and B = 4.330127019) using different approaches.
-
Page 86: Tool Menu
CHAPTER 3 (4) TOOL menu • The TOOL menu is equipped with functions to convert and execute binary, octal, Ï decimal, and hexadecimal expressions as well solve simultaneous linear equations and polynomial equations. • Press to enter the TOOL menu (the display to the right will appear). - Page 87 MANUAL CALCULATIONS Ï • Enter the mode to solve simultaneous linear equations with three unknown values by pressing The input screen shown on the right will appear. Equation types are displayed on the top of the screen. The list of coefficients (a, b, c, d) allowed for input (the cursor pointer is located on the first line of a) is displayed below.
- Page 88 CHAPTER 3 • This function is explained using an example. <Example> Ï C 2 The quadratic equation “ax + bx + c = 0” is solved using parameters “a=2”, “b=-5” and “c=-3”. 1. Press (Select quadratic equation) The screen shown on the right will appear asking for ®...
-
Page 89: Chapter 4 Graphing Functions
GRAPHING FUNCTIONS CHAPTER 4 GRAPHING FUNCTIONS This chapter describes the method of displaying a graph by specifying functions and parameters. 1. Function Graphing Procedures In the EL-9650, there are two input methods for displaying a graph. Input expression Manual input Select from expressions stored in memory See the Rapid graph on page 124,... -
Page 90: Rectangular Coordinate Graphing
CHAPTER 4 3. Rectangular Coordinate Graphing • In the rectangular coordinate graph mode, ten functions can be stored in Y1 to Y9 and Y0 for graph drawing. • The rectangular coordinate graph mode is the default setting of the EL-9650. The following section describes the procedures to draw a graph of equations “Y1=–(X+2) +5”... -
Page 91: Entering A Function (See Page 98 For Details.)
GRAPHING FUNCTIONS • The following briefly explains the items on the FORMAT menu. A ------ : To display the list of the settings of the mode B CURSOR : To set the graph coordinate system C EXPRES : To set whether or not to display the graph equation on the screen D Y’... -
Page 92: Displaying Graphs
CHAPTER 4 6. Enter “X–2”. - 2 ® Key operations: 7. The cursor moves to [Y3]. This completes the input of the functions. (4) Displaying graphs • To display a graph, press • A graph will be created according to the Y1 and Y2 functions, as shown on the right. -
Page 93: Displaying Equations
GRAPHING FUNCTIONS Procedures: The following steps enlarge the section of the graph marked by in the diagram shown on the right. , and press ®. ( ≤ 1. Move the cursor to corner ≤...< <...®) . (≥ ≥...> >...) 2. Move the cursor to corner A rectangular box appears on the display to show the section selected for zooming. -
Page 94: Trace Function For Moving The Cursor Pointer On The Graph
CHAPTER 4 (7) Trace function for moving the cursor pointer on the graph The trace function allows the cursor pointer to be moved on the graph and displays the coordinates. • Set to the TRACE mode. Press As shown on the right, a flashing cursor pointer appears on the equation curve. - Page 95 GRAPHING FUNCTIONS * If the “ ” mark is not positioned over a graph, touching the same position with the touch-pen does not move the cursor. After leaving and returning to the TRACE screen, the cursor will be located at the same position as it was in the previous TRACE screen (not at the initial position).
- Page 96 CHAPTER 4 When the graph with the cursor pointer indication is changed in either of the previous two methods, the equation displayed at the upper left corner of the display also changes to the one for the newly selected graph. (The previous example shows the screen after the cursor pointer is moved from the equation “Y1 = –(x+2) +5”...
-
Page 97: Displaying Numerical Derivative Y' Of Graphs
GRAPHING FUNCTIONS (8) Displaying numerical derivative Y’ of graphs A numerical derivative of a graph is expressed by dy/dx. This calculator features a function that displays a numerical derivative Y’ (dy/dx). • To display Y’, set [D Y’] of FORMAT menu to [1 ON]. •... -
Page 98: Shading
CHAPTER 4 (10) Shading The calculator is equipped with a function to shade a specified range (SHADE func- tion). This function is valid only for rectangular coordinates. The following steps explain how to shade the area designated by this function. The SHADE menu is located in the DRAW menu. - Page 99 GRAPHING FUNCTIONS • A maximum of 5 settings can be made on the SHADE screen. Settings and their meanings (There are 3 shading patterns as shown below.) Y1 <Y < Y2 (Shading of area larger than Y1 and smaller than Y2) <Y <...
-
Page 100: Displaying Tables (See Page 121 For Details.)
CHAPTER 4 (11) Displaying tables (See page 121 for details.) • A table is a chart of values yielded by a function (Yn) for values of X. • There are two methods to create tables. In one method, the entry of a function automatically produces a table. -
Page 101: Split Screen
GRAPHING FUNCTIONS (12) Split screen • The split screen displays both a graph and a table at the same time. In the table set display (see above), press Ï • The screen changes to the display shown on the right. The cursor pointer is located on the graph, and the coordinates of the cursor pointer location are high- lighted in the table. -
Page 102: Parametric Graphing
CHAPTER 4 4. Parametric Graphing The parameter graph mode can display graphs of defined equations (X = X(t), Y = Y(t)) using three parameters (variables). To display the calculated points, the calculator increases the T interval of Tstep and executes calculation. When the parameter coordinates are set, press to input T. -
Page 103: Polar Coordinate Graphs
GRAPHING FUNCTIONS 5. Polar Coordinate Graphs A polar coordinate graph shows coordinates with distance r from the origin point and positive-value angle θ from the X axis. enters the value of θ. When the polar coordinate graph mode is selected, pressing <Example>... - Page 104 CHAPTER 4 4. Setting suitable ranges The calculator features a function that allows easy range setting for graphing various equations. The following shows how this function is used to set the most suitable range for the above graph. • Press •...
-
Page 105: Sequence Graphing
GRAPHING FUNCTIONS 6. Sequence Graphing • The calculator is equipped with a sequence graph mode that can display regulated sequences (arithmetic and geometric) which can be expressed using function equations as graphs. • The sequence graph mode can register or simultaneously draw three graph equations u( n ), v( n ) and w( n ). - Page 106 CHAPTER 4 3. Set graph display screen size prior to graphing • Press the key to display the screen shown to WINDOW the right. • Since the cursor pointer is positioned at “ n Min”, input n Min = 0 and n Max = 10 by pressing 0 ® 10 ®.
-
Page 107: Format Setting
GRAPHING FUNCTIONS 7. FORMAT Setting These are various settings for operating the GRAPH screen. The following describes the sub-menus in detail. Pressing Ï displays the screen shown on the right. [G TYPE] appears only when the sequence coordinate graph mode is selected. [A –... -
Page 108: Entering Functions
CHAPTER 4 [F STYLE2] [1 Sequen] — To set to the sequential graphing mode. (Graphs are drawn one at a time, in order.) [2 Simul] — To set to the simultaneous graphing mode. (Two or more graphs are drawn at the same time.) [G TYPE] (Valid only when the sequence coordinate graph mode is selected in SET UP. - Page 109 GRAPHING FUNCTIONS Sequential Memory capacity: 3 equations (u( n ), v( n ), w( n )) and 3 lists (u( n Min), v( n Min), w( n Min)) • In each function input screen, the cursor pointer indicates the equation number where an input can be made.
-
Page 110: Zoom Functions
CHAPTER 4 9. Zoom Functions • The ZOOM menu contains instructions that enable the changing of the display range of the graph screen. • To use the zoom function, press [A ZOOM] – To change the display range without numeric input such as range designa- tion. - Page 111 GRAPHING FUNCTIONS [5 Default] — To set the graphing function When [Default] is selected in the graph to the standard display display mode, a graph is re-drawn according settings (default settings). to the default window data. • The default settings vary in the four modes.
- Page 112 CHAPTER 4 [C POWER] [D EXP] [E TRIG] [F HYP] • These menus change the display variables to settings suitable for drawing graphs of powers [C POWER], [D EXP], trigonometric functions [E TRIG] and hyperbolic functions [F HYP]. • To use these functions in the graph display mode, select an appropriate item from the ZOOM menu and press ®.
-
Page 113: Selecting A Line Type For A Graph
GRAPHING FUNCTIONS 10. Selecting a Line Type for a Graph • The calculator has five kinds of lines (Solid line (–), Dotted line (…), Bold line ( ), Locus ( ), Dot ( )) for drawing graphs. • The type of line can be selected on the DRAW menu. It is possible to set a desired line type for equations in the different graph coordinate systems (four kinds in total). -
Page 114: Setting A Window
CHAPTER 4 Assume that the screen marked *1 on the previous page is already displayed. 1. Sets [Y1] to bold line. Press > > ® ≥. 2. Sets [Y2] to dotted line. Press < ® ≥. 3. Sets [Y3] to locus line. Press >... - Page 115 GRAPHING FUNCTIONS • Input a numeric value while the cursor is displayed and press ® to set it. Rectangular coordinate system: Xmin/Xmax: X-axis minimum and maximum values Xscl: X-axis scale (Same contents apply to the Y-axis.) Parametric coordinate system: The values below are applied to this coordinate system in addition to those in the rectangular coordinate system.
-
Page 116: Draw Operations
CHAPTER 4 12. Draw Operations • The DRAW menu allows you to draw points or lines, and to save or call up the graph or pixel data. • There are two kinds of drawing methods; one allows you to draw a point or line by directly touching a desired point on the screen and the other allows you to specify it by manually inputting data. - Page 117 GRAPHING FUNCTIONS The following key operations show those after Ï A have been pressed. [A DRAW] Function Key operations and display [1 ClrDraw] Deletes all points, lines, or (Graph display screen) Press 1 to delete the draw data and to pictures drawn using the DRAW menu.
- Page 118 CHAPTER 4 [3 H_line] Draws a horizontal line at a (Graph display screen) Press 3 to return to the graph display specified location. screen where the cursor pointer is displayed. Using <>≤≥, move the cursor pointer to a desired location and press ® to fix it.
- Page 119 GRAPHING FUNCTIONS The following syntax is used to draw a tangential line. [T_line (Y1, 3)] Equation on which X-axis coordi- nate tangential line is drawn. value (Tangential line is drawn at (X=3) on the graph Y1.) [6 Draw ] Draws an additional graph of (All screens) Press 6 to display the message “Draw_”.
- Page 120 CHAPTER 4 [9 Circle(] Draws a circle on the graph (Graph screen) Press 9 to display the cursor pointer on the screen. screen. Using ≤≥<>, move the cursor pointer to the center of the circle which you wish to draw and press ® to set the center.
- Page 121 GRAPHING FUNCTIONS * Lines, points, and curves drawn by the Draw menu are handled as pictures. Therefore, they cannot be traced. * Graphs drawn by the Draw menu are automatically cleared if any screen settings are changed. To save the graph, use the Sto Pict menu. A ®...
- Page 122 CHAPTER 4 [1 Pnt ON] Draws a point on the specified graph screen. [2 Pnt OFF] Deletes a point on the specified graph screen. (Points (dots) making up the graph or coordinate axis can also be deleted.) [3 Pnt CHG] Changes the display status of a point on the specified graph screen.
- Page 123 GRAPHING FUNCTIONS [C ON/OFF] Makes the graph equation valid or invalid in units of equation. (For the rectangular coordinate system, this equals “Y1 ” (Valid) and “Y1=” (Invalid).) [1 Draw ON] Makes the graph equation valid. (An “=” mark in the specified equation will be highlighted.) <Example>...
- Page 124 CHAPTER 4 [E G_DATA] [1 Sto GD] Saves the graph data. The graph data can be saved to any of ten memory spaces G_Data 1 to G_Data 9, and G_Data 0. Graph data which can be saved are the equation data (in all rectangular, polar, parametric, and sequential coordinate systems) and window settings.
- Page 125 GRAPHING FUNCTIONS Operation: 1. Press Ï E 2. The screen shown to the right will appear, allowing you to call up the graph data. 2. Press 1 ®. G_Data 1 is called up. The screen shown on the right will appear, showing that G_Data 1 has overwritten the current screen contents.
- Page 126 CHAPTER 4 * The data to be saved as Pict data is like a hard copy of the screen and is completely different from the graph data. Even though the Pict data is called up, the data is handled as pictures, and therefore no function equations exist. (Tracing is also not possible.) [2 Rcl Pict] Calls up the saved Pict data by specifying it.
-
Page 127: Calc Functions
GRAPHING FUNCTIONS 13. CALC Functions • This function allows you to automatically calculate the position specified by the menu and move the cursor to that point. • Press Ï ˘ to enter the CALC menu. WhenÏ ˘ are pressed, the screen shown to the right will appear. - Page 128 CHAPTER 4 [1 Value]: Press 1. 2 ® ≥ or ≤ The cursor pointer moves The cursor pointer moves to the graph for “Y = to the point “X=2” on the graph for “Y = X –5”. X+4”. * As shown above, press ≥ or ≤ to move the cursor pointer between graphs. (Press <...
- Page 129 GRAPHING FUNCTIONS [3 Minimum]: • Press 3. The cursor pointer moves to the minimum point of the graph for “Y1 = X – 5”. • At this time, the coordinates will appear on the bottom of the screen. • To move to another graph, press ≥ or ≤. If the minimum point cannot be calculated, the error message, “No Solution”, will appear and show that the cursor pointer cannot be moved.
- Page 130 CHAPTER 4 [6 Y_Incpt]: • Press 6. [7 Inflec]: • Press 7. In this example, assume that the cubic equation of “Y1 = X – 3X + 2” has been input. * When calculating using the CALC function: When solving in a screen with the ZOOM function in use, results may differ in value from that shown in the example (coordinate values).
-
Page 131: Tables
GRAPHING FUNCTIONS 14. Tables • The calculator allows you to illustrate the changes using the function equation and graph you have input. In addition to this function, it also has tables for showing a list of X and Y values. •... - Page 132 CHAPTER 4 Polar coordinate system • The variable θ is always displayed in the left end column. • For table values (R), R1 to R3 are displayed on the first screen. • To show values R4 to R6, press > to horizontally scroll the screen. •...
-
Page 133: Table Setting
GRAPHING FUNCTIONS (1) Table Setting • To display the table, press . (Note that it is essential to input an equation and set the table before using this function.) • Table setting allows you to input data necessary for creating a table. •... -
Page 134: Useful Functions
CHAPTER 4 <Example> To create a table in the User mode under the above conditions. ® User > ® — 3 ® * An automatically created table on the user creation screen cannot be scrolled vertically. 15. Useful Functions The calculator provides a rapid function which allows you to easily input a graph equation, window settings, and zoom settings while observing the graph screen. - Page 135 GRAPHING FUNCTIONS 1) Y=AX 2) Y=X A) Y=AX 3) Y=3X 4) Y=1/2 X 5) Y=-2X 1) Y=AX 2) Y=X B) Y=AX 3) Y=2X –1 4) Y=-X 5) Y=-2X –1 1) Y=A(X–H) 2) Y=2(X–1) C) Y=A(X–H) 3) Y=-2(X–1) 4) Y=(X+2) –1 5) Y=-(X+2) –1 D) Y=AX...
- Page 136 CHAPTER 4 <Example> Input “Y1 = 2sin(-2X + π) + 2” using the rapid graph function. 1. Press to open the equation input screen and place the cursor at [Y1]. 2. Press to display the large classification screen for the equation. 3.
-
Page 137: Rapid Window
GRAPHING FUNCTIONS (2) Rapid window • This function is used to set the window settings by selecting any of the typical window settings built into the calculator. • Regardless of the coordinate system, this function only sets the X and Y values. •... -
Page 138: Rapid Zoom
CHAPTER 4 4. The X-Window selection screen will appear. The settings displayed on the top line (after C: ) are the current settings. mark at the upper right corner of the screen shows that the setting selection range exists after line , press Å... - Page 139 GRAPHING FUNCTIONS 1. To move the displacement point of the graph which cannot be seen currently to the screen and move the whole graph down, follow the next steps. Initial position of the cursor pointer 2. Press A reduced graph of the above graph will appear at the center of the screen.
-
Page 140: Split Screen
CHAPTER 4 (4) Split screen • The calculator provides a split screen function which allows you to view the graph and table or the graph and graph equation at the same time. • The screen is split vertically as shown below. This function is valid in all coordinate system modes. -
Page 141: Substitution Graph
GRAPHING FUNCTIONS • The split screen is always in the trace mode. Therefore, the cursor pointer appears on the graph. Accordingly, the coordinate values are reversely displayed in the table and the equation at which the cursor pointer is located is also reversely displayed. •... - Page 142 CHAPTER 4 • 22 kinds of variables (characters), A to Z except for R, T, X, and Y can be used for the substitution graph. • Up to seven variables (characters) can be used for one equation. (If the equation contains more than seven variables (characters), up to seven characters from the top of the equation are determined as variables and subsequent characters are ignored.)
- Page 143 GRAPHING FUNCTIONS 1. Press Ï The substitution graph screen will appear. The equation on which the cursor pointer is located and its variables are displayed on the right of the screen. If variables (characters) contain no values, the graph is not drawn.
- Page 144 1. Press ≤ ≤ 5 ®. (The cursor is moved from C to A and 5 is input.) The slope of the graph becomes sharp. * Accordingly, move the cursor and substitute other numeric values for variables to view how the graph changes.
-
Page 145: Chapter 5 Matrix Functions
MATRIX FUNCTIONS CHAPTER 5 MATRIX FUNCTIONS 1. Inputting a Matrix • Up to ten files can be defined as matrices (each matrix can contain up to 99 rows and columns). • The size may be defined in the range of 1 through 99. However, the overall size is limited according to the memory capacity. - Page 146 CHAPTER 5 Description of screen: Matrix file name The screen to the right shows the matrix Initial cursor position column 1, row 1 being set. Row × column (Only “×” is displayed initially.) Data screen based on the column, ® row settings (no display initially).
- Page 147 MATRIX FUNCTIONS 5. Input data sequentially. First, press • “4” is displayed on the bottom of the screen. The contents displayed on the bottom line show the data to be input in the cell where the cursor pointer is located. •...
-
Page 148: Matrix Calculations
CHAPTER 5 2. Matrix Calculations Functions except for complex numbers can be used. Additionally, [C OPE] and [D MATH] of the menu include the special matrix functions. <Example> Assume that mat A is and mat B is Calculate the addition of mat A and mat B, and the square of mat A. ¬... -
Page 149: Calculations Using Special Matrix Functions
MATRIX FUNCTIONS 3. Calculations Using Special Matrix Functions • The matrix menu includes the OPE, MATH, and [ ] calculation on the function menus. • Pressing allows you to check the options Å included in the OPE menu. > ≥ (1) OPE The following explains commands of the OPE menu, assuming that mat A is mat B... - Page 150 CHAPTER 5 [02 fill(] Used to fill elements of the matrix with a specified value. <Example> To fill all elements of mat D with 5: (It is necessary to define the dimension before executing this function.) Entry: fill (5, mat D) Answer: * The message, “Done”, will appear on the screen after calculation.
- Page 151 MATRIX FUNCTIONS [06 rnd_mat(] Used to make a matrix by generating random numbers. <Example> To make a random matrix containing 2 rows by 3 columns (TAB setting: 2, FSE: set to FIX): Entry: rnd_mat (2, 3) .23 .38 .79 Answer: .19 .64 .14 * Since this function generates random numbers, the actual answer you obtain may not match the above display.
- Page 152 CHAPTER 5 [10 row_m.p.( ] Used to perform scalar multiplication of elements in a specified row and add the result to another specified row. <Example> To multiple elements in the 3rd row of mat E by 2 and add the result to the 1st row: Entry: row_m.p.
-
Page 153: Math
MATRIX FUNCTIONS (2) MATH • Next, the special matrix function menu is ex- plained below. • Press to open the matrix MATH menu. This menu contains options 1 to 4. [1 det] Used to calculate the determinant from the matrix to obtain the solution. This command can be used only when the number of rows and columns are the same. -
Page 154: Calculation Using [ ]
CHAPTER 5 [4 rrow EF] Used to calculate the reduced row-echelon form of the matrix. <Example> To calculate the reduced row-echelon form of mat A: Entry: rrowEF mat A Answer: The use of rrow EF makes it possible to solve simulta- neous equations. -
Page 155: Chapter 6 List Functions
LIST FUNCTIONS CHAPTER 6 LIST FUNCTIONS • A list is handled as numeric data containing multiple numeric values in parentheses. • A list is normally used in equations and calculations. The calculator has six registration areas, L1 to L6, as memory areas. Additionally, all lists L1 to L6 are registered as one set of list data. -
Page 156: List Calculations Using List Number
CHAPTER 6 1. List Calculations Using List Number • Calculations between lists and calculations using functions can be performed. • It is also possible to store complex numbers in the list. <Example> jÏ ÎÏ Calculation examples using lists L1 and L2 created previously. ®... - Page 157 ÎÏ ( LIST FUNCTIONS Å:Ï ® To add new data 7 to * To add new data, it is put in the 5th term since data is already input until the 4th term. ® * If a number of 6 or more is input instead of 5 in the above operation and is pressed, an...
-
Page 158: Drawing A Function Graph Using A List
CHAPTER 6 2. Drawing a Function Graph Using a List <Example> To draw the graph for “Y = {1, 2, 3} x ” in the rectangular coordinate system using the list containing {1, 2, 3}, follow these steps. 1. First, input the equation. opens the equation input screen. - Page 159 LIST FUNCTIONS [1 sort A(] Used to sort the data in the list in ascending order. <Example> To sort list L1 in ascending order: Entry: sort A (L1) Answer: {4 5 6} * It is also possible to sort more than one list at the same time. To do so, separate lists with a comma (,).
- Page 160 CHAPTER 6 [4 fill( ] Used to substitute a specified value for all terms in the specified list for which numeric values are input. <Example> To substitute 5 for list L3: Entry: fill (5, L3) Ï ® Numeric value for substitution List name for substitution Answer: {5 5 5 5} “Done”...
- Page 161 LIST FUNCTIONS [7 df_list] Used to calculate the difference between adjacent terms in the list to make a new list. <Example> To calculate the difference between adjacent terms in list L1 and make a list : Entry: df_list L1 Answer: {-2 1} 4–6 5–4 [8 augment(] Used to make an augmented list of two lists.
-
Page 162: Math
CHAPTER 6 Ï B (2) MATH Å In this section, assume that L1 = {6, 4, 5} and L2 = {3, 9, 8} are already input. 1. Press to display the MATH sub-menu. 2. Press > ≥ to open the next page. There are eight options available in the MATH menu. - Page 163 LIST FUNCTIONS [5 sum ( ] Used to sum terms in the list. <Example> To find the sum of list L1: Entry: sum (L1 ) Answer: 15 * It is also possible to sum values at specified locations. In this case, the entry is sum (L1, 2, 5) to sum up 2nd trough 5th elements of L1. [6 prod(] Used to multiply all terms in the list.
-
Page 164: L_Data
CHAPTER 6 (3) L_DATA As previously described, up to six lists, L1 to L6, can be registered. It is also possible to store all of the six lists and call them up as one list data. List data is stored in up to 10 memory spaces, L_Data 1 to L_Data 9, and L_Data 0. -
Page 165: Editing And Easy Input Of List Data
LIST FUNCTIONS 4. Editing and Easy Input of List Data • The procedures previously described are used to edit and input list data. However, complex key operations are required to input and edit a great amount of data. • This problem obviously occurs when inputting a lot of data, such as statistics data. In this case, the list function is commonly used because statistical data is handled as a list. - Page 166 ® CHAPTER 6 6. Press to scroll the data input screen. Item number 7 will appear on the screen. Edit : Change data from “4” to “10” in the above example. 1. On the final input screen in the above example, press ≤...
-
Page 167: Chapter 7 Statistics/ Regression Calculations
STATISTICS/ REGRESSION CALCULATIONS CHAPTER 7 STATISTICS/ REGRESSION CALCULATIONS • It is possible to find standard deviations and means for statistical data in 1-variable or 2-variable form. • Other functions such as statistical data graphing, regression curve plotting, statistical tests and estimation calculation are also available. •... -
Page 168: Statistics
CHAPTER 7 (2) Statistics • It is possible to input statistical data directly into the list. • The amount of data allowed for input varies according to the used memory space, however, up to 999 elements can be entered (per list). •... -
Page 169: Entering Statistical Data
STATISTICS/ REGRESSION CALCULATIONS (3) Entering statistical data • The calculator has six lists (L1 to L6) for entry. • It is possible to combine the six lists into one list and save up to ten lists (L_Data1 to L_Data9 and L_Data0) separately (see CHAPTER 6 on page 145 for details). •... -
Page 170: Calculating Statistics (Calc Menu)
CHAPTER 7 ® ® ® ® ® 6. Enter the test results of the physics exam to L2 following the same procedure ® ® ® ® ® previously described. Now data entry is complete. Alternative entry procedure - Frequency table (using a weight list) In the previous example, scores of the mathematics and physics tests are sequentially input into the lists L1 and L2, respectively. - Page 171 Ï dÏ ® STATISTICS/ REGRESSION CALCULATIONS < 6. Press to display results of the statistics for L2. 7. Press ≥≥≥≥… to display all statistics. • Input “1_Stats list name” when obtaining statistics for only one variable. ( • When obtaining statistics for two variables and the data list used for calculating statistics are L1 and L2, separate the list names by using “,”...
-
Page 172: Editing Statistical Data
¬ C 3 CHAPTER 7 Ï ,Ï ) • Press to transfer the function to the standard function calculation screen . ® • Press to input the data list. • Press and the answer shown to the right will appear. •... -
Page 173: Graphing Statistical Data
STATISTICS/ REGRESSION CALCULATIONS ÏqC1 To delete one list: ® • Use the OPTION menu (See CHAPTER 13 on page 260.) 1. Move the cursor pointer to the list name to delete using 2. Press to delete all data within the list selected. •... - Page 174 CHAPTER 7 The following is a list of statistical graph types available on the calculator. Histogram Broken line plot PLOT1 POINT: ° Normal probability plot Normal distribution plot PLOT2 POINT: Box plot PLOT3 POINT: Modified box plot Scatter diagram XYline •...
- Page 175 STATISTICS/ REGRESSION CALCULATIONS 3. Press [A ZOOM] [9 Stat]. The graph shown on the right will appear. Ï B ® Next, we will set the graph for the physics scores (L2). 4. Press STATPLOT ® 5. Press to display the same type setting screen as above. The only difference is that PLOT2 will be displayed on the top left corner of the screen.
-
Page 176: Explanation Of Graph Types
CHAPTER 7 (7) Explanation of graph types Ï • As mentioned earlier, the calculator is capable of drawing 8 types of graphs using statistical data. • Graphs are selected by pressing again in the STAT PLOT mode. STATPLOT • Overviews of each graph are given below. Histogram (A HIST): •... - Page 177 STATISTICS/ REGRESSION CALCULATIONS • Data for the Normal Probability Plot: It is not possible to set the frequency in the Normal Probability Plot (NP.P.) of the statistical graphs. The statistical data should be created using only one list instead of splitting the statistical data into the data and frequency.
-
Page 178: Specifying Statistical Graph And Graph Functions
CHAPTER 7 Scatter diagram (G S.D.): • When statistical data (X) and (Y) are entered, the (Y) value with respect to the (X) value is drawn. • 2-variable statistical data is required for drawing a scatter diagram. • There are three types of points: “•”, “+” and “ ” . •... -
Page 179: Trace Function Of Statistical Graphs
STATISTICS/ REGRESSION CALCULATIONS (9) Trace function of statistical graphs • As with function graphs, statistical graphs are also equipped with a trace function to move the cursor pointer on graph curves. then use <> to move the cursor pointer • To operate this function, press once it appears on-screen. -
Page 180: Data List Operation Function (B Ope)
CHAPTER 7 (10) Data list operation function (B OPE) • Press to display the screen shown on the right. • Within the OPE menu are four functions to process data lists. Ï A 1 [1 sortA( ]: organizes list contents in ascending order. •... - Page 181 STATISTICS/ REGRESSION CALCULATIONS [3 SetList] : organizes the lists in the specified order. • Entry: SetList list name, list name,… • Up to 6 list names can be specified. List names must be separated using • Entered list names are arranged in order from the left. •...
-
Page 182: Regression
CHAPTER 7 2. Regression • Regression curves are selected from the [D REG] menu in the statistic mode. • Check the menu contents. Å Press to display the primary screen of the REG menu. There are two Å other screens that can be accessed by moving the cursor pointer to the submenu side (the right half of the screen displaying “01 Med_Med”, etc.) and pressing ≥... - Page 183 STATISTICS/ REGRESSION CALCULATIONS Function name Description Regression formula Parameter y=a+bInx a, b, r, r 07 Rg_In Finds the regression curve using the natural logarithm formula (natural logarithm regression). y=a+blogx a, b, r, r 08 Rg_log Finds the regression curve using the common logarithm formula (common logarithm regression).
- Page 184 CHAPTER 7 Function name Description Regression formula Parameter 15 X’ Find the estimated value of X when a value Y was given by comply- ing to the function found using the regression formula. Entry: AX’ (numerical values or list are entered in A. Multiple solutions can be obtained at the same time of inputting list.) <Example 8>...
- Page 185 STATISTICS/ REGRESSION CALCULATIONS • X’, Y’ will be valid after regression calculations, excluding 2nd, 3rd and 4th degree polynomial regressions, logistic regression and sin regression, have been done. <Example10> The following relationship was found when heating a beaker filled with water. Find the regression equation using the data and estimate the water temperature before heating.
- Page 186 CHAPTER 7 8. Press to draw the scatter diagram of this statistical data. * Selecting in the ZOOM mode allows for quick graphing in an optimum range since window setting values of the graph plotting screen are automatically set using the Window set list data.
- Page 187 ® STATISTICS/ REGRESSION CALCULATIONS 11. Press to display the regression formula and parameters as shown on the right. 12. Press to draw a regression curve using the found parameter values and the scatter diagram. • A regression curve close to the estimated point was found.
-
Page 188: Statistic Testing
CHAPTER 7 3. Statistic Testing • The calculator is equipped with a test function for statistical data. • To use the statistic test function, press then select “E TEST”. • There are 17 options within the “E TEST” menu (check by pressing > Å ≥). - Page 189 STATISTICS/ REGRESSION CALCULATIONS For example, to set to the numerical value input mode: E 1 7 ® Press The screen shown to the right appears, indicating that the numerical value input mode has been set. • When setting to the statistics input method, all statistic test functions are valid.
- Page 190 CHAPTER 7 [02 Ftest2samp] Two sample data collected from two different populations are tested for population standard deviation <Example 2> To test population standard deviation < for the two sample data, n = 20, standard deviation sx = 5.6 and n = 50, standard deviation sx = 6.2, follow the next steps.
- Page 191 STATISTICS/ REGRESSION CALCULATIONS <Example 3> We will test the validity of the sample mean µ , 64.52, obtained from statistical data {65.6, 62.8, 66.0, 64.5, 65.1, 65.3, 63.8, 64.2, 63.5, 64.4} of n=10 from a given popula- tion (solve by hypothesizing µ < µ 1.
- Page 192 CHAPTER 7 The test will be conducted using the previous data. 1. Set to the list input (InputList) mode A ® to input data 1 to list 2 (L2) and Press data 2 to list 3 (L3). E 0 4 to open the 2.
- Page 193 STATISTICS/ REGRESSION CALCULATIONS 1. Since we will be using lists to input statistics, A ® to display the list screen. press 2. Input statistical data x to list 4 and y to list 5 (as shown to the right). (If other data exists in list 4 or 5, delete data or register under a different list name.) E 0 5 to open the parameter input 3.
- Page 194 CHAPTER 7 E 0 6 to input each parameter (as 2. Press shown to the right). 3. Press Ï to solve (as shown to the right). The numerical value within ( ) shows the confidence bound with level of confidence at 0.99. * sx indicates sample standard deviation.
- Page 195 STATISTICS/ REGRESSION CALCULATIONS [08 Ztest1samp] Tests the hypothesis of population mean when the value of the population stan- dard deviation, from sample data collected from a population, is known. <Example 8> The average weight and standard deviation ( ) for a product being manufactured are known to be 52.4g and 4.5, respectively.
- Page 196 CHAPTER 7 [09 Ztest2samp] Tests the identity of two sample means, , when the population standard deviation, , from two sample data sets collected from two different populations, are known. <Example 9> > is the test for two sets of sample data: = 77.3, = 3.4, n = 30 and...
- Page 197 STATISTICS/ REGRESSION CALCULATIONS 2. Press Ï to obtain the answer as shown to the right. indicates the success probability obtained from the sample data. [11 Ztest2prop] Executes comparative test for the success probability, (P1, P2), obtained from two sets of sample data collected from two different populations. <Example11>...
- Page 198 CHAPTER 7 [12 Zint1samp] Finds the confidence bound of the population mean, , when the value of the popula- tion standard deviation, , from sample data collected from a population, is known. <Example 12> Here, we will find the confidence bound of the sample data from example 8 ( ) when the level of confidence (C-level) is 0.95.
- Page 199 STATISTICS/ REGRESSION CALCULATIONS 3. Press Ï to solve (as shown to the right). The numerical value within () indicates the confi- dence bound of when the confidence level is 90%. * “n1” and “n2” are positive integers. [14 Zint1prop] Finds the confidence bound of the success probability of a population from the success probability obtained from sample data collected from a population.
-
Page 200: Distribution Function
CHAPTER 7 2. Press Ï to solve (as shown to the right). The numerical value within () indicates the confi- dence bound of success probability P1 - P2 with the confidence level at 90%. * “n1” and “n2” are positive integers. 4. - Page 201 STATISTICS/ REGRESSION CALCULATIONS [01 pdfnorm(]: Finds the probability density of a specified value x for the normal distribution N( , )(cannot be input using lists). Format: pdfnorm (value of x, mean, standard deviation) However, mean ( ) and standard deviation ( ) may be omitted. (When omitted, =0 and =1 <Example 1>...
- Page 202 CHAPTER 7 <Example 3> Find the value of x when the probability of example 1 is 0.8. Key operation: F 0 3 0.8 , 60 , 6 ) ® Thus, all of the probabilities for data with x up to 65 are 0.8.
- Page 203 STATISTICS/ REGRESSION CALCULATIONS [06 pdf (]: Finds the probability density of specified value x for distribution with n degrees of freedom (cannot be entered using lists). Format: pdf (value of x, degrees of freedom) * Degrees of freedom is a positive integer. <Example 6>...
- Page 204 CHAPTER 7 [09 cdfF (]: Finds the F distribution probability of specified range x for F distribution with two independent degrees of freedom, m and n (cannot be entered using lists). Format: cdfF (lower limit, upper limit, degrees of freedom of the numerator, degrees of freedom of denominator) However, the degrees of freedom of the numerator and the degrees of freedom of the denominator may be omitted.
- Page 205 STATISTICS/ REGRESSION CALCULATIONS [11 cdfbin (]: Finds the probability of a specified range x of a binomial distribution (cannot be entered using lists, with the exception of success numbers). Format: cdfbin (trial number, success probability, success number) However, the success number may be omitted (when the success number is not specified, values from 0 to the trial number are entered and displayed as list).
- Page 206 CHAPTER 7 [14 pdfgeo (]: Finds the probability density of specified value x for a geometric distribu- tion. Format: pdfgeo (success probability, value of x) * The success probability is 0 p 1. <Example 14> Find the probability density of a geometric distribution with success probability of 5.6% that it will be successful the 26th time.
-
Page 207: Chapter 8 Financial Functions
FINANCIAL FUNCTIONS CHAPTER 8 FINANCIAL FUNCTIONS Ï • The financial calculation commands of the calculator are located in the Financial menu. • Press to execute financial calculations ( is the second function FINANCE FINANCE Ï • Numerical value input format and display format in the FINANCE mode comply to that of SET UP. - Page 208 CHAPTER 8 Simple interest: • Annual interest rate of 3% means that 3% interest of $10,000 will be received for the first year or $300. • Since the principal sum remains the same, the interest for the second year would also be: $10,000 ×...
-
Page 209: Cash Flow Diagrams
FINANCIAL FUNCTIONS (2) Cash flow diagrams Cash flow diagrams show cash flow by time in a form of a diagram. Cash flow diagrams are created with the following items in mind. • Time flow is indicated using a horizontal line. Time flow moves from left to right. Time is divided into even sections (day, month, quarter periods, half year, year, etc.). -
Page 210: The Financial Function
CHAPTER 8 2. The Financial Function (1) Setting of payment due (at the beginning/end of a period) • With the calculator, it is possible to set whether payments are due at the beginning of a period or at the end of a period. •... - Page 211 FINANCIAL FUNCTIONS • The following screen will appear when entering the TVM SOLVER mode. The payment due is set to the end of period. Payment due setting Number of payment periods Interest Present value (principal sum) Payment or received amount Future value (principal interest total) Number of payments per year Cumulative interest per year...
- Page 212 ® CHAPTER 8 6. Press 12 ® Since P/Y (number of payments per year) is monthly, there will be 12 payments annually. 7. Press C/Y (cumulative interest per year) is given the same numerical value as the entered P/Y. Since there are 12 monthly payments, annual interest is naturally calculated in the same manner.
- Page 213 — ® FINANCIAL FUNCTIONS ® 3. Press ≥≥≥ to input “-800” for “PMT”. Ï 4. Press ≥ 12 ≤≤≤≤ to move the cursor pointer to the location of PV. 5. Press to solve. • Result: PV = 149025.29 • This shows the limit of payable amount for monthly payments of $800. •...
-
Page 214: Calculation Using The Calc Mode
Ï CHAPTER 8 3. Press ≥≥≥≥ to calculate FV by using the numerical value entered in the above example. (3) Calculation using the CALC mode Ï • In the CALC menu of the FINANCE menu are functions designated for finance calculations. - Page 215 FINANCIAL FUNCTIONS [02 slv_I%] : Calculates annual interest Input method: slv_I%(N, PV, PMT, FV, P/Y, C/Y) ¬ Ï Here, we will calculate the interest to establish a monthly , — payment of $1000 (TAB is set to 2). ) ® FINANCE 200000 1000...
- Page 216 CHAPTER 8 * Annual sales (collected investment) are input in a list format. ¬ • This is explained using the following key procedure. 1. Press to recall standard function Ï Ï Î calculation screen and clear screen. Ï ® 2. Input collected investment data to list L1. 7000 9000 5000...
- Page 217 FINANCIAL FUNCTIONS [07 Irr] : Calculates the investment revenue rate. Input method: Irr (initial investment, list of following collected investment) <Example 7> The investment revenue rate is calculated using example 5 by assuming an investment ¬ of $28,000 for the sales plan. (The sales plan is considered entered in list L1 and TAB Ï...
- Page 218 ¬ CHAPTER 8 Ï B 0 9 ) ® Ï B 0 9 ® As it can be seen, the payments dominating the principal sum are greater for years 6 to10 when compared to the first through the fifth years (negative indicates payment).
- Page 219 FINANCIAL FUNCTIONS [12 →Eff (]: Converts nominal interest rate to effective interest rate. Input method: →Eff (nominal interest rate, number of settlements) <Example 12> What would the effective interest rate for monthly compound interest be with 8% as the ¬ annual interest rate? How much would it be for half a year? Ï...
-
Page 220: Vars Menu
CHAPTER 8 (4) VARS menu Ï • The VARS menu is installed with all functions used in the TVM SOLVER. • Press to display all sub-menu FINANCE items within the VARS menu. • The functions of these menus are the same as that of the previously described SOLVER. -
Page 221: Chapter 9 Solver Function
SOLVER FUNCTION CHAPTER 9 SOLVER FUNCTION • The calculator allows you to find the solution of equations. This chapter describes Ï how to input an equation and find the solution. • The basic flow is as follows. 1. Enter the solver mode ( 2. - Page 222 CHAPTER 9 ® 3. To find the solution: When is pressed after the equation has been input, the calculator enters the Ï variable input screen. Input numeric values for the known variables, then move the cursor pointer to a variable for which you wish to obtain the solution. Press to find the solution.
-
Page 223: Selecting The Solution Analysis Method
SOLVER FUNCTION 4. To find the solution: Press ≤ to move the cursor to “C=” (after Ï inputting numerical values, the cursor pointer is at “D”). ¬ Press to display the answer screen shown to the right. After the solution has been found, press to return to the variable input screen. -
Page 224: Newton's Method
CHAPTER 9 (1) Newton’s method • This method is used to find the solution of a complex equation. For example, this method can obtain the real value of a square root by repeating calculations. • To find the solution using this method, it is necessary to specify the initial value (START) and step value (STEP). -
Page 225: Graph Method
Ï SOLVER FUNCTION 8. Press to find the solution. As a result, I = 0.084471771 ( 8.45%) is obtained. Approximate values of the right (RIGHT=) and left (LEFT=) sides and the difference (L–R =) will appear on the screen, allowing you to check the error range. •... - Page 226 CHAPTER 9 • Additionally, this method can be used to plot the graph and find approximate values if the initial value is unknown when finding the solution by the Newton method. • The start point (BEGIN) and end point (END) are input in this method, instead of START and STEP in the Newton method.
-
Page 227: Registering An Equation
SOLVER FUNCTION If multiple solutions exist: • When the first solution is obtained, the process is stopped. If other solutions exist, change the param- eters to perform the process in a different range. • It is possible to change the initial value (START) for the Newton method and the range (BEGIN and END) for the graph method, respec- tively. -
Page 228: Calling Up The Solver Equation
® CHAPTER 9 4. Press to register the equation. • A maximum of 99 equations can be registered. • The number of equations which may be registered varies depending on how much memory is currently free. Ï 4. Calling Up the Solver Equation Ï... -
Page 229: Renaming The Solver Equation
SOLVER FUNCTION 5. Renaming the Solver Equation • To rename an equation which is already registered, select [D RENAME] in the solver menu. The equation number and name will appear on the right portion of 01 ® the screen. Select the equation number for which you wish to change the name. - Page 230 CHAPTER 9...
-
Page 231: Chapter 10 Slide Show Functions
SLIDE SHOW FUNCTIONS CHAPTER 10 SLIDE SHOW FUNCTIONS The calculator is equipped with two types of slide show functions: • Built-in Slide Show. You can redisplay stored function equations and graphs and coordinate relationship screens. Sub-menu Main menu • Creating an Original Slide Show. You can create your own slide show screens and register them. - Page 232 CHAPTER 10 Y value X value <Example> View the slide show screen for “Y = AX + B”: 1. Press . Enters the slide show mode. 2. Press ® ≥ ®. Selects [A B-IN] and “2 Y = AX + B”. Equation of The first screen appears as shown on graph currently...
-
Page 233: Creating An Original Slide Show
SLIDE SHOW FUNCTIONS • When ≥ is pressed sequentially, the slide show screen for “Y = AX + B” is stopped on the screen shown to the right. • That is, the built-in graph for “Y = AX + B” is completed on the 8th screen. (At this time, use of ≥... - Page 234 CHAPTER 10 Create an original slide show according to the example. <Example> Input “Y1 = 2X–5” and “Y2 = X ”, and then store the equations, graph screen, table screen, and graph and table screen in sequential order. (Set to the X-Y coordinate system.) ¬.
- Page 235 SLIDE SHOW FUNCTIONS 9. Press . Displays the table. 10. Press Ï . Registers the screen. 11. Press Ï . Displays both the graph and table. 12. Press Ï . Registers the screen. After the above steps have been performed, creation of the necessary screens is now completed.
-
Page 236: Viewing The Original Slide Show
CHAPTER 10 3. Viewing the Original Slide Show To view the original slide show which was created previously, follow these steps. 1. Press . Sets the slide show to the view mode. 2. Press ®. Displays the first screen. (The symbol, “01” is highlighted in the upper right corner of the screen.) 3. -
Page 237: Deleting The Registered Screen (Del)
SLIDE SHOW FUNCTIONS 2. Press ®. Displays the first screen of the original slide show. A message prompting you to select a screen to be moved will appear. 3. Press ≥ ®. Calls up the second screen. Press ® to set it. The message on the bottom of the screen will be changed. -
Page 238: Renaming The Registered Title (Rename)
CHAPTER 10 3. Press ≥ ≥ ≥. Selects a screen which you wish to delete. 4. Press ®. Deletes the selected screen. The final screen (screen number 03) will appear at the same time when screen number 04 is deleted. * Exit this mode by pressing Ï... -
Page 239: Chapter 11 Shift/Change Functions
SHIFT/CHANGE FUNCTIONS CHAPTER 11 SHIFT/CHANGE FUNCTIONS The calculator provides SHIFT and CHANGE functions: • SHIFT Function. It automatically move the graph equation corresponding to the amout of movement. • CHANGE Function. It automatically move the graph equation by changing the shape (slope) of the built-in graph. - Page 240 CHAPTER 11 Number Equation Movement step Movable range X : 1 X=–5 to 5 Y : 1 Y=–3 to 3 X : 1 X=–6 to 4 Y : 1 Y= –3 to 3 Y=1/X X : 1 X=–4 to 6 Y : 1 Y=–4 to 2 X : 1...
- Page 241 SHIFT/CHANGE FUNCTIONS Shows the graph equation before movement. (Solid line graph shown to the left) Arrows showing the movable directions. (In this example, the Shows the registered equation. arrows showing that (The first equation, “Y = X ”, is the cursor can be automatically registered.) moved in both the vertical and horizontal...
- Page 242 CHAPTER 11 5. Press > >. (When using the touch-pen, press a point slightly away from the right arrow “ ”.) Moves the graph two scales to the right (in the + X direction). At this time, the equation “Y = X + 1”...
- Page 243 SHIFT/CHANGE FUNCTIONS Next, to draw graphs from the saved equations, follow these steps. • There are the following two methods to enter the graph regeneration screen. Touch the right portion of the screen with the pen where the equations are displayed. Press Å...
- Page 244 CHAPTER 11 • To return to the graph movement mode, follow one of these two methods. On the screen shown to the right, Touch any part on the left portion of the screen where the graph is displayed with the pen. Press Å...
- Page 245 SHIFT/CHANGE FUNCTIONS Movement range using the touch-pen: • A cursor having four arrow marks shows that it can be used in both the horizontal and vertical direc- tions. • As shown in the above figure, an area where the ↓ pen can be touched is not in units of dots, but in units of grids containing of 6 ×...
-
Page 246: Change Function
CHAPTER 11 2. CHANGE Function The SHIFT function previously described allows you to move the graph and view the relationship between the moved graph and its equation. The CHANGE function shows the relationship between the graph and equation by changing the shape of the graph. For example, using this function, you may view changes such as “Y = 2X ”... - Page 247 SHIFT/CHANGE FUNCTIONS <Example> The CHANGE function is explained using the graph for “Y = X ”, also used in the SHIFT function. 1. Press Ï B >. (Touch [B CHANGE] and [Y= X ] with the pen.) Sets the CHANGE mode of “Y = X ”.
- Page 248 CHAPTER 11 6. Press ≤. (Touch the upper arrow of “ ” with the pen.) The graph for “Y = 2X ” is further changed, as shown to the right. 7. Press ® . Sets the moved graph. In the same manner as described in the SHIFT function, the previous graph is displayed by the dotted line and the currently selected graph is displayed by the solid line.
-
Page 249: Chapter 12 Programming Function
PROGRAMMING FUNCTION CHAPTER 12 PROGRAMMING FUNCTION • The calculator is equipped with a PROGRAM function. • Programming makes the automatic processing of both simple and complex calculations possible any number of times. • In addition to special functions, almost all ordinary functions can be used in programming. •... -
Page 250: Programming
CHAPTER 12 2. Programming • This instruction manual contains no explanations of necessary knowledge and concepts required for programming. • Program input methods, commands and rules are explained assuming that the programmer has a certain degree of programming experience (BASIC, FORTRAN, etc.). -
Page 251: Variables
PROGRAMMING FUNCTION Ï • Except for special cases, only one command (functions that can be input from the menu using ) can be input on each line. • A maximum of 160 characters can be entered per line in a program. All commands are treated as a single character, regardless of the character length. - Page 252 CHAPTER 12 Î Å X Typical uses of variables in a program: Ï MXÅ+ÅB ÎÅY 5 ⇒ X (5 ): This program line substitutes the value 5 for the variable X. (“5” is stored in the X memory space.) MX + B ⇒ Y ( This program line substitutes the value “(M ×...
-
Page 253: Programming Commands
PROGRAMMING FUNCTION ® 3. First, the value of the variable M is opened. 4. Press 5 next to open the value of B. ® 5. Press 7 to perform the calculation using the value of X stored to the X memory space and determine the value of Y. - Page 254 CHAPTER 12 2. Specified character strings following a quotation mark (”) will be displayed on the screen. The number of characters that can be input on one line is 160 (the actual number of characters that can be input, excluding commands, is 158). Entry 2: Print ”...
-
Page 255: B Brnch Menu
PROGRAMMING FUNCTION • The symbol will blink in the upper right corner of the screen while program execution is interrupted. Entry: Wait numerical value <Example> Wait 10 [5 Rem] Inserts comments into a program. • This line has no affect on program execution. Such comments are not displayed on the screen, even during program execution. - Page 256 CHAPTER 12 [2 Goto] To shift program execution to a label (character string). Entry: Goto character string <Example> Goto LOOP [3 If ] Specifies conditional branches. • Conditional branches start with the If command and are followed by the condition statement and the branch destination when the condition is satisfied.
-
Page 257: C Scrn Menu
PROGRAMMING FUNCTION Ï C (3) C SCRN menu Press to display the menu selected with [C SCRN] on the screen, as shown to the right. [1 ClrT] Clears the program text screen without influencing the plotted graph. The program text screen is displayed. -
Page 258: E Coord Menu
CHAPTER 12 [2 Send] Sends data to externally connected devices. Entry: Send variable <Example> Send C Send L2 Send mat D Ï E (5) E COORD menu Press to display the screen selected with [E COORD], as shown to the right. [1 Rect] Sets the graph coordinates as X and Y coordinates. -
Page 259: F Form Memu
PROGRAMMING FUNCTION [6 uv] Sets the graph coordinates as the axes of numerical string graphs. - u( n ) is set as the X axis - u(v) is set as the Y axis Entry : uv [7 uw] Sets the graph coordinates as the axes of numerical string graphs. - Sets u( n ) as the X axis. -
Page 260: G S_Plot Menu
CHAPTER 12 [4 Expr OFF] Sets the mode in which the graph equation is not displayed on the graph screen. Entry: Expr OFF [5 Y’ ON] Sets the mode in which the derived function (Y’) is displayed on the graph screen. -
Page 261: H Copy Menu
PROGRAMMING FUNCTION [3 Plt 3(] (Specifies that a statistical graph be drawn in plot 3.) Entry: Plt1 (Type, Xlist, Ylist, Freq) <Example> Plt1 (Hist, L1, L2) Plt2 (Scattr , L3, L4) Plt3 (xyLine+, L5, L6, L7) Ï H (8) H COPY menu Press to display the menu selected with [H COPY], as shown to the right. -
Page 262: Graphing Functions
≥ F 2 CHAPTER 12 ≥ F 3 ≥ F 4 “ ≠ ” Not equal to ≥ F 5 “ > ” Greater than ≥ F 6 “ ≥ ” Equal to or greater than “ < ” Less than “... - Page 263 PROGRAMMING FUNCTION <Example> Î Set Xmin = –3, Xmax = 10, Xscl = 1, Ymin=–5, Ymax = 5, Yscl = 1 in the WINDOW screen. — Î B®A 1® to input the settings. Î B®A 2® Expression Operational sequence Î B®A 3® -3 ⇒...
-
Page 264: Error Messages
CHAPTER 12 7. Error Messages • When a program is input, it is necessary to check the program for errors (debug the program). • If a problem is found in a program, error messages will be displayed to facilitate debugging. •... - Page 265 PROGRAMMING FUNCTION Ï C® Input: CONVERT ® Program Key operation Ï B1Ï STAR CONVERT ÅÏ A1Ï A2 Ï Label START C TO FÅ ≥ Ï A1Ï A2 Ï Print “ 1.C TO F F TO CÅ ≥ Ï A3Ï SÅ Print “...
-
Page 266: Random Substitution Of Numbers
CHAPTER 12 Ï Ï ® Execution: Execute the program. After pressing , select the program (CONVERT) and press When the program starts executing, a request will be made for the method of calcula- tion, followed by a request for input of the temperature. When the temperature has been input, the program will display the results. - Page 267 PROGRAMMING FUNCTION Ï Ï ® Execution: Execute the program. After pressing , select the program (MATFILL) and then press ® When the program starts executing, the line will be defined and then the random numbers will be stored in Mat A. To view the contents of Mat A on the screen, select and then press...
- Page 268 CHAPTER 12...
-
Page 269: Chapter 13 Option Functions
OPTION FUNCTIONS CHAPTER 13 OPTION FUNCTIONS Ï q • The calculator is equipped with option functions for features such as adjusting display contrast, checking memory, deleting, link menu, etc. • Press to open the option menu. A: Display contrast adjustment B: Memory usage check C: Delete files D: Link between another EL-9650 or Personal computer... -
Page 270: Deleting Files
CHAPTER 13 • The displayed items are defined as follows: List: shows the memory used by lists Matrix: shows the memory used by matrices Graph Eqn: shows the memory used by graph equations Solver Eqn: shows the memory used by solver equations Program: shows the memory used by programs Picture: shows the memory used by graph pictures G_Data: shows the memory used by registered graph data... -
Page 271: Link Function
OPTION FUNCTIONS 4. Link Function • The EL-9650 is capable of being linked to other EL-9650s and personal computers for data commu- nication by using optional parts (CE-450L and CE- LK1). • Use this menu for data transmission with other ÏqD devices. - Page 272 CHAPTER 13 * Please be aware that if there are existing data on the receiving side, the existing data will be overwritten. * Make sure that the communication cables are inserted properly so that they do not come unattached. * The number of files that can be selected at one time for sending is 10. ÏqD1 Selecting data to send: •...
-
Page 273: Data Communication Between The El-9650 And A Personal Computer
OPTION FUNCTIONS • All registered files are displayed as shown on the right (3 types of file are displayed on the right side of the screen). ® • The cursor is positioned at the very top line. • First select list “L1” for send. 2. -
Page 274: When Trouble Occurs
CHAPTER 13 (1) When trouble occurs If a problem occurs after replacing the batteries, or if the calculator does not function ˚ properly even after the above RESET operation, perform the following: 1. Press the RESET switch on the back. 2. -
Page 275: Appendix
APPENDIX APPENDIX 1. Replacing the Batteries Batteries used in the calculator: Type Model Q’ty Manganese battery AAA (R03) Unit operation Lithium battery CR2032 Memory backup With normal use, the AAA batteries last about 150 hours, and the lithium backup battery lasts 5 years. -
Page 276: Replacing The Memory Backup Battery
APPENDIX 4. Replace all four batteries. Be sure to insert the batteries as shown in the illustration. 5. Replace the battery compartment cover. The following message appears. If you do not see the message, repeat steps 2 to 5. 6. Press ˚. CAUTION Do not press ¬. -
Page 277: Specifications
APPENDIX 3. Using a pen or screwdriver as a lever, lift the battery out of its compartment. 4. Replace the battery with an identical 3V lithium battery (CR2032 or equivalent). Make sure the plus (+) sign faces up. 5. Replace the memory backup cover label. 6. - Page 278 APPENDIX Model EL-9650 Calculation Manual calculation (arithmetic, parentheses calculation, memory function calculation, function calculation, integral calculation, coordinate conversion), binary, octal, decimal and hexadecimal calculation, boolean operation, matrix calculation, complex number calcula- tion, complex function calculation, statistic calculation, regression calculation, statistic authorization calculation, financial calculation, etc.
- Page 279 APPENDIX Model EL-9650 Used temperature 0°C to 40°C (32°F to 104°F) range Power 0.13W consumption Battery life Battery for operation: approx. 150 hours (with 5 minutes of continual use and 55 minutes in the display state for every hour with temperature approx. 20°C / 68°F) Battery for memory: Approx.
-
Page 280: Error Codes And Error Messages
APPENDIX 3. Error Codes and Error Messages Error Error message Error content code Syntax Syntax error in equation or program Calculate Execution of a division using 0, calculation beyond calcula- tion range, etc. Nesting Reservation of 14 or more numerical values or 32 or more functions during execution. - Page 281 APPENDIX Error Error message Error content code Editor type Invalid editor type Continue = “=” exists in equation that has been recalled (RCL) No data Data does not exist Graph Type Error in graph type setting Too many var. Use of too many variables in the SOLVER mode No variable No variable in the specified equation of the SOLVER mode No solution...
-
Page 282: Calculation Equation Error Conditions Used By This Unit
APPENDIX 4. Calculation Equation Error Conditions Used by This Unit (1) Financial * Define constants “r” and “s” when using in the equation below. S=1 (Pmt_Begin) I (%) ÷ C/Y + 1 – 1 , ... - Page 283 APPENDIX 3. FV calculation If r ≠ 0, r >-1 1–(1+r) ×PMT PV+(1+r×s)× FV= – (1+r) If r = 0 FV = -n × PMT –PV If r ≤ -1 Error 4. PMT calculation If r ≠ 0, r > –1 PV+FV×(1+r) PMT= –...
-
Page 284: Error Conditions During Financial Claculations
APPENDIX (2) Error conditions during financial calculations • r ≤ -1 • N = 0 in PMT calculations • I% = 0 and PMT = 0, or I% ≠ 0 and FV = (1/r) (1 + r × s) × PMT, in N calculations. - Page 285 APPENDIX pdfχ χ χ – –1 f (χ , df) = ∞ ∫ However: Γ(s) = s–1 –x 2Γ ( df: Degree of freedom pdfF( Γ ( –1 – f (x) = Γ ( Γ ( ∞ ∫ However: Γ(s) = s–1 –x m: Degree of freedom of...
-
Page 286: Calculation Range
APPENDIX 5. Calculation Range Arithmetic Calculation The results for dividend, multiplicand and operand are: -1 × 10 < x ≤ -1 × 10 , 1 × 10 < x ≤ 1 × 10 or 0 (valid within the range of display capability) Please note that results and input numerical values less than 1 ×... - Page 287 APPENDIX Function Calculation range Notes |x| < 1 × 10 X ≠ 0 |x| < 1 × 10 0 ≤ x < 1 × 10 -0.5 ≤ n ≤ 69.5 n is an integer or integer + 0.5 When a > 0, -1 ×...
- Page 288 APPENDIX Function Calculation range Notes |x| ≤ 9999999999 Decimal: 1000000000000000 ≤ x Binary: ≤ 1111111111111111 0 ≤ x ≤ 0111111111111111 x is an integer 4000000000 ≤ x ≤ 7777777777 Octal: 0 ≤ x ≤ 3777777777 Hexadecimal: FDABF41C01 ≤ x ≤ FFFFFFFFFF 0 ≤...
- Page 289 APPENDIX Function Calculation range Notes |x| < 1 × 10 |y| < 1 × 10 |Σx| < 1 × 10 Σx < 1 × 10 Statistic calculations |Σy| < 1 × 10 Σy < 1 × 10 |Σxy| < 1 × 10 |n| <...
- Page 290 APPENDIX Function Calculation range Notes n > 0 |Σx| < 1 × 10 |(Σx) (Σy)| < 1 × 10 Regression calcula- | < 1 × 10 0 < |Σx – tions excluding 2nd, 3rd and 4th degree | < 1 × 10 |Σxy –...
-
Page 291: Complex Number Calculations
APPENDIX Complex number calculations Function Calculation range Notes |x| < 10 x + yi ≠ 0 x + yi |y| < 10 |x| < 10 (x + yi) |y| < 10 |xy| < 5 × 10 ln (x + yi) |x| <... -
Page 292: Explanation Of El-9650 Menus
APPENDIX 6. Explanation of EL-9650 menus Note: Numerical values, equations, variables, lists, etc. are entered in A and B. [ ] indicates that it may be omitted. (CPLX) indicates that the function can be used in the complex number mode. Major categories marked with an asterisk (*) are used only for explanation and are not related to actual keys or display indications. - Page 293 APPENDIX EL-9650 functions Major- Sub- Minor- Name Description Example of use category category category SET UP Mixed Sets answer display to the A mode is fixed by ANSWER (Real) mixed fraction mode selecting it in the menu screen Improp Sets answer display to the ”...
- Page 294 APPENDIX EL-9650 functions Major- Sub- Minor- Name Description Example of use category category category FORMAT E Connect Sets to connect plot mode. A mode is fixed by STYLE1 Reset all Y=graph line type selecting it in the to “–” menu screen Sets to dot plot mode.
- Page 295 APPENDIX EL-9650 functions Major- Sub- Minor- Name Description Example of use category category category MATH A CALC Executes calculation using squares fmin ( Calculates the variable when fmin (equation, a function equation takes the lower limit, upper smallest value limit) List cannot be used for all argu- ments fmax (...
- Page 296 APPENDIX EL-9650 functions Major- Sub- Minor- Name Description Example of use category category category MATH A CALC Calculates using integral dx see above calculus (close equation beginning with ∫ with dx) Σ ( Σ (equation, initial Calculates cumulative sum of a sequence equation value, end value [,increment]) Calculates trigonometric...
- Page 297 APPENDIX EL-9650 functions Major- Sub- Minor- Name Description Example of use category category category MATH B NUM abs ( Finds absolute value of real abs (A) number, equation, list or matrix (CPLX) round ( Round off at specified round (a [,digit decimal place number of decimals])
- Page 298 APPENDIX EL-9650 functions Major- Sub- Minor- Name Description Example of use category category category MATH C PROB 1 random Executes random numbers random[(number of random numbers)] Listing of random numbers is not possible Finds the number of items in A sequence (between list A and B, list and each element, numerical value, list and...
- Page 299 APPENDIX EL-9650 functions Major- Sub- Minor- Name Description Example of use category category category MATH E ANGLE 1 ° Degree input and DRG Numerical value ° conversion (for example [numerical value ’ entered (A° B’ C”)° in the RAD numerical value ”] mode is converted to DEG) A°...
- Page 300 APPENDIX EL-9650 functions Major- Sub- Minor- Name Description Example of use category category category ≥ Test operation that compares A ≥ B MATH F INEQ values on the right with the left. Returns 1 if true and 0 if false <...
- Page 301 APPENDIX EL-9650 functions Major- Sub- Minor- Name Description Example of use category category category MATH real ( Finds real number of a com- real (A) COMPLX plex number, or conjugate complex number of a complex number list (CPLX) image ( Finds imaginary number of image (A) complex number, or com-...
- Page 302 APPENDIX EL-9650 functions Major- Sub- Minor- Name Description Example of use category category category LIST A OPE sortD ( Sorts elements of list names sortD(list name) in descending order sortD(list name, (sorts list elements in the subordinate list order from the highest value name 1... subordi- to the lowest value) nate list name n) dim (...
- Page 303 APPENDIX EL-9650 functions Major- Sub- Minor- Name Description Example of use category category category LIST A OPE mat→list ( Satisfies individual list from mat→list(matrix individual line elements of name,list or list matrices subordinate list name 1...,list or list name n), mat → name n list(matrix name,line number,list number)
- Page 304 APPENDIX EL-9650 functions Major- Sub- Minor- Name Description Example of use category category category LIST B MATH 6 prod ( Finds the cumulative sum prod(list [,initial of list elements from value,end value]) beginning to end prod(seq(equation, Finds the total of sequential beginning value,end elements from beginning to value [,increment]))
- Page 305 APPENDIX EL-9650 functions Major- Sub- Minor- Name Description Example of use category category category STAT B OPE SetList Specifies the arrangement SetList of list used in the statistic SetList list editor. name1 [,list name2,...] ClrList Clears multiple list data ClrList list name 1 [,list name 2,...] C CALC 1 1_Stats...
- Page 306 APPENDIX EL-9650 functions Major- Sub- Minor- Name Description Example of use category category category STAT D REG Rg_x Executes quadratic Rg_x (X list name, regression calculation Y list name (regression equation: [,frequency list of + bx + c) data] [,equation name for storing]) Rg_x Executes cubic regression...
- Page 307 APPENDIX EL-9650 functions Major- Sub- Minor- Name Description Example of use category category category STAT D REG Rg_ae Executes exponential Rg_ae (Xlist regression calculation name,Ylist name (regression equation: ae [,frequency list of data] [,equation name for storing]) –1 –1 Rg_x Executes reciprocal Rg_x (Xlist...
- Page 308 APPENDIX EL-9650 functions Major- Sub- minor- Name Description Example of use category category category STAT D REG y’ Only for previously executed A y’ regression equation exclud- ing 2nd, 3rd, 4th degree polynomial regressions, sin regression and logistic regression : Calculates the estimated value of Y obtained by giving numerical values to x and y...
- Page 309 APPENDIX EL-9650 functions Major- Sub- Minor- Name Description Example of use category category category STAT E TEST Zint2samp Calculates confidence bound of two µs, when σ is known Zint1prop Outputs the confidence bound of one ratio Zint2prop Outputs the confidence bound of two ratios InputList Specifies list input of...
- Page 310 APPENDIX EL-9650 functions Major- Sub- Minor- Name Description Example of use category category category cdf χ Calculates χ cdf χ STAT F DISTRI 07 distribution (lower limit, probability (list not possible) upper limit,degree of freedom) pdfF ( Calculates F distribution pdfF(value,degree probability density of freedom of...
- Page 311 APPENDIX EL-9650 functions Major- Sub- Minor- Name Description Example of use category category category STAT F DISTRI 14 pdfgeo ( Calculates geometric pdfgeo(success distribution probability probability,x) density cdfgeo ( Calculates geometric cdfgeo(success distribution probability probability,x) DRAW A DRAW 1 ClrDraw Clears drawings and graphs ClrDraw of drawn elements Line (...
- Page 312 APPENDIX EL-9650 functions Major- Sub- Minor- Name Description Example of use category category category DRAW A DRAW 9 Circle ( Draws a circle on screen Circle(x coord.,y coord.,radius) Text ( Draws text on screen Text (column, line, ”characters to be displayed”) B POINT 1 PntON (...
- Page 313 APPENDIX EL-9650 functions Major- Sub- Minor- Name Description Example of use category category category DRAW C ON/ DrawON Make graph equations valid DrawON [numerical by equation units equation No1, Numerical equation No2,...,] -All equations are selected when numerical equation No is omitted DrawOFF Make graph equations DrawOFF[numerical...
- Page 314 APPENDIX EL-9650 functions Major- Sub- Minor- Name Description Example of use category category category DRAW INITIAL Return graph screen to its INITIAL SHADE default setting (clear shade) ZOOM A ZOOM 1 Auto Automatic scale setting Auto (relationship of Ymin and Ymax is adjusted to the relationship of Xmin and Xmax)
- Page 315 APPENDIX EL-9650 functions Major- Sub- Minor- Name Description Example of use category category category ZOOM Draws graph using screen POWER settings most suited for 2” drawing “Y=X –1 Draws graph using screen –1 settings most suited for –1 drawing “Y=X ”...
- Page 316 APPENDIX EL-9650 functions Major- Sub- Minor- Name Description Example of use category category category –1 –1 ZOOM E TRIG Draws graph using screen settings most suited for drawing “Y=sin –1 x” –1 –1 Draws graph using screen settings most suited for drawing “Y=cos –1 x”...
- Page 317 APPENDIX EL-9650 functions Major- Sub- Minor- Name Description Example of use category category category ZOOM H RCL PreWin Draws graph using PreWin WINDOW information prior to executing the ZOOM function CALC A CALC Value Find function value Y for Value value X (only value can be selected when coordinate system is Polar, Param or Seq) Intsct...
- Page 318 APPENDIX EL-9650 functions Major- Sub- Minor- Name Description Example of use category category category FINANCE B CALC 05 slv_FV Calculates total of principal slv_FV [(N, I%, PV, and interest (future value) PMT, P/Y, C/Y)] Npv ( Calculates net present value Npv(interest rate, (calculates the total present initial investment, value for cash inflow and...
- Page 319 APPENDIX EL-9650 functions Major- Sub- Minor- Name Description Example of use category category category →Eff ( →Eff(nominal FINANCE B CALC 12 Converts nominal interest rate to annual effective rate interest rate, number of settled accounts) days ( Calculates number of days days(initial month (from the initial day to last day year, last month...
- Page 320 APPENDIX EL-9650 functions Major- Sub- Minor- Name Description Example of use category category category * PRGM A PRGM 5 Comment command Rem character string End command Label Label definition command Label character BRNCH string (under 10 characters) Goto Jump command Goto label name Condition diversion If condition Goto...
- Page 321 APPENDIX EL-9650 functions Major- Sub- Minor- Name Description Example of use category category category * PRGM E COORD 5 Time Sets axis for sequence Time graphing (sets n to X axis and u( n ), v( n ) and w( n ) to Y axis) Sets axis for sequence graphing (sets u( n ) to X axis and v( n )
- Page 322 APPENDIX EL-9650 functions Major- Sub- Minor- Name Description Example of use category category category * PRGM F FORM 7 Connect Specifies connect plot mode. Connect Reset all graph line type to “–” Specifies dot plot mode. Reset all graph line type to “…”...
- Page 323 APPENDIX EL-9650 functions Major- Sub- Minor- Name Description Example of use category category category VARS L_Data1 Selects list data 1 then StoLD L_Data1 L_DATA transfers data to screen RclLD L_Data1 L_Data2 Selects list data 2 then StoLD L_Data2 transfers data to screen RclLD L_Data2 L_Data3 Selects list data 3 then...
- Page 324 APPENDIX EL-9650 functions Major- Sub- Minor- Name Description Example of use category category category VARS G_Data5 Selects graph data 5 then StoGD G_Data5 G_DATA transfers data to screen RclGD G_Data5 G_Data6 Selects graph data 6 then StoGD G_Data6 transfers data to screen RclGD G_Data6 G_Data7 Selects graph data 7 then...
- Page 325 APPENDIX EL-9650 functions Major- Sub- Minor- Name Description Example of use category category category VARS Pict9 Selects Picture data 9 then StoPict Pict9 PICTUR transfers data to screen RclPict Pict9 Pict0 Selects Picture data 0 then StoPict Pict0 transfers data to screen RclPict Pict0 G TABLE 1 TBLStrt...
- Page 326 APPENDIX EL-9650 functions Major- Sub- Minor- Name Description Example of use category category category * EQVAR A XY Selects graph equation Y7 then transfers it to screen Selects graph equation Y8 then transfers it to screen Selects graph equation Y9 then transfers it to screen Selects graph equation Y0 then transfers it to screen...
- Page 327 APPENDIX EL-9650 functions Major- Sub- Minor- Name Description Example of use category category category * EQVAR B XYT Selects graph equation Y6T Y6T then transfers it to screen C Rθ Selects graph equation R1 then transfers it to screen Selects graph equation R2 then transfers it to screen Selects graph equation R3 then transfers it to screen...
- Page 328 APPENDIX EL-9650 functions Major- Sub- Minor- Name Description Example of use category category category * WINVAR A XY Ymax Specifies the largest value Ymax of the Y axis of a graph screen then transfers it to screen Yscl Specifies the scale spacing Yscl of the Y axis of a graph screen then transfers it to...
- Page 329 APPENDIX EL-9650 functions Major- Sub- Minor- Name Description Example of use category category category * WINVAR D SEQ n Min Specifies the smallest value n Min of a numerical equation graph to be evaluated then displays it on screen n Max n Max Specifies the largest value of a numerical equation...
- Page 330 APPENDIX EL-9650 functions Major- Sub- Minor- Name Description Example of use category category category * STOWIN A Zm_Xmax Specifies Xmax prior to Zm_Xmax STOXY executing the ZOOM function then displays it on screen Zm_Xscl Specifies Xscl prior to Zm_Xscl executing the ZOOM function then displays it on screen Zm_Ymin...
- Page 331 APPENDIX EL-9650 functions Major- Sub- Minor- Name Description Example of use category category category * STOWIN B STOT Zm_Tstp Specifies Tstep prior to Zm_Tstp executing the ZOOM function then displays it on screen Specifies θmin prior to C STOθ Zm_θmin Zm_θmin executing the ZOOM function then displays it on...
- Page 332 APPENDIX EL-9650 functions Major- Sub- Minor- Name Description Example of use category category category * STOWIN D Zm_v( n Min) Specifies v( n Min) prior to Zm_v( n Min) STOSEQ executing the ZOOM function then displays it on screen Zm_w( n Min) Specifies w( n Min) prior to Zm_w( n Min) executing the ZOOM function then displays it on...
- Page 333 APPENDIX EL-9650 functions Major- Sub- Minor- Name Description Example of use category category category * STAT A XY xmax Specifies largest value of x xmax then displays it on screen Σx Σx Specifies sum of x then displays it on screen Σx Σx Specifies sum of squares of...
- Page 334 APPENDIX EL-9650 functions Major- Sub- Minor- Name Description Example of use category category category * STAT RegEqn Displays obtained regression RegEqn REGEQN equation Specifies linear regression coefficient a then transfers it to screen Specifies linear regression coefficient b then transfers it to screen Specifies linear regression coefficient c then transfers it...
- Page 335 APPENDIX EL-9650 functions Major- Sub- Minor- Name Description Example of use category category category * STAT C POINTS 1 Median summary point of x of lower part for Med_Med law Median summary point of x of center part for Med_Med law Median summary point of x of upper part for Med_Med law...
- Page 336 APPENDIX EL-9650 functions Major- Sub- Minor- Name Description Example of use category category category * STAT D TEST Specifies test statistic value (z) then displays it on screen Specifies test statistic value (t) then displays it on screen χ χ Specifies test statistic value (χ...
- Page 337 APPENDIX EL-9650 functions Major- Sub- Minor- Name Description Example of use category category category * STAT D TEST Specifies sample mean (x2) of x value of sample 2 then displays it on screen Specifies sample standard deviation (sx1) of x value of sample 1 then displays it on screen Specifies sample standard...
- Page 338 APPENDIX EL-9650 functions Major- Sub- Minor- Name Description Example of use category category category MATRIX A NAME 6 mat F Specifies matrix F then mat F displays it on screen mat G Specifies matrix G then mat G displays it on screen mat H Specifies matrix H then mat H...
- Page 339 APPENDIX EL-9650 functions Major- Sub- Minor- Name Description Example of use category category category MATRIX C OPE dim ( Finds list length and matrix dim (list name) dim size (matrix name) Defines list length and (matrix size is matrix size returned with list) List length→dim list name,{row,column}...
- Page 340 APPENDIX EL-9650 functions Major- Sub- Minor- Name Description Example of use category category category MATRIX C OPE row_m.p.( Multiplies a row of matrix row_m.p.(multiplied then adds rows of matrices number,matrix (multiplied number × row A + name,row number row B → row B) A,added row B) mat→list( Satisfies individual lists...
- Page 341 APPENDIX EL-9650 functions Major- Sub- Minor- Name Description Example of use category category category PRGM C NEW Sets new program create mode STAT A PLOT1 Specifies statistic graph 1 PLOT1 PLOT (PLOT1) B PLOT2 Specifies statistic graph 2 PLOT2 (PLOT2) C PLOT3 Specifies statistic graph 3 PLOT3...
- Page 342 APPENDIX EL-9650 functions Major- Sub- Minor- Name Description Example of use category category category STAT C N.P. Norm+_X Specifies X coordinate as Norm+_X GRAPH data value, Y coordinate as inverse conversion value (z) of normal distribution with data point “+” Norm _X Specifies X coordinate as Norm _X...
- Page 343 APPENDIX EL-9650 functions Major- Sub- Minor- Name Description Example of use category category category STAT F MBOX 1 MBox • Specifies modified box plot. MBox • GRAPH The lines on either side are (Q3–Q1) × 1.5 Uses “•” to draw data points (including Xmin and Xmax) of the lines that are on the outside...
- Page 344 APPENDIX EL-9650 functions Major- Sub- Minor- Name Description Example of use category category category STAT xyLine + Specifies xyLine with “+” as xyLine + GRAPH XYLINE data points xyLine Specifies xyLine with “ ” as xyLine data points OPTION A CTRST Sets contrast adjustment mode of the display sceen Sets memory usage check...
- Page 345 APPENDIX EL-9650 functions Major- Sub- Minor- Name Description Example of use category category category OPTION D LINK RECEIVE Sets to data receive mode RECEIVE E RESET 1 default set Resets the settings to default set default values All memory Resets all memory and set All memory to default condition LINK...
- Page 346 APPENDIX EL-9650 functions Major- Sub- Minor- Name Description Example of use category category category SLIDE A B-IN Y=1/X Opens the slide show screen Y=1/X SHOW of “Y=1/X” Y=sin X Opens the slide show screen Y=sin X of “Y=sin X” Y=tan X Opens the slide show screen Y=tan X of “Y=tan X”...
- Page 347 APPENDIX EL-9650 functions Major- Sub- Minor- Name Description Example of use category category category SHIFT A SHIFT 4 Opens the SHIFT screen of CHANGE “Y=e ” Y=InX Opens the SHIFT screen of Y=InX “Y=lnX” Y=sinX Opens the SHIFT screen of Y=sinX “Y=sinX”...
- Page 348 APPENDIX EL-9650 functions Major- Sub- Minor- Name Description Example of use category category category TOOL Sets to mode that solves SYSTEM simultaneous linear equations with four unknown values Sets to mode that solves simultaneous linear equations with five unknown values Sets to mode that solves simultaneous linear equations with six unknown...
- Page 349 APPENDIX * When coordinate system is Rect, param or polar...
- Page 350 APPENDIX E STYLE1 F STYLE2 * When coordinate system is Seq.
- Page 351 APPENDIX When coordinate system is Rect When coordinate system is Polar, Param or Seq MATH menu on the NBASE calculation...
- Page 352 APPENDIX...
- Page 353 APPENDIX on Program screen...
- Page 354 APPENDIX...
- Page 355 APPENDIX...
- Page 356 APPENDIX...
- Page 357 APPENDIX...
- Page 358 APPENDIX...
- Page 359 APPENDIX Index Σ — (bold line) Prn( (principle sum)(CALC(finance)) 207,308,348 o (dot) σ x (statistics) 158~160 ··· (dotted line) Σ (locus) x (statistics) 158~160 Σ — (solid line) (statistics) 158~160 Σ ’ (minute input) (ANGLE(MATH)) 59,289,340 xy (statistics) 158~161 σ ”...
- Page 360 APPENDIX C(cont.) B(cont.) battery Maximum 117,119,307,341 precaution Minimum 117,119,307,341 replacing 265,266 Value 117,118,307,341 BIN (binary)(numerical calculation) X_Incpt (X axis intersection) B-IN (built-in)(SLIDE SHOW function) 117,119,307,341 221,335,347 Y_Incpt (Y axis intersection) 117,120,307,341 bold line(–)(line type) 103,303,342 calculation boolean operator (N-BASE)(LOGIC) FINANCE 197,204~209 67,291,341 graph...
- Page 361 APPENDIX C(cont.) C(cont.) complex number cosh X(TRIG)(ZOOM)(graph) 102,306,342 abs( (absolute)(complex) 71,291,340 coshX(TRIG)(ZOOM)(graph) 102,306,342 arg( (arguments) 71,291,340 cosX(TRIG)(ZOOM)(graph) 102,305,342 conj( (conjugate complex number) cot(trigonometric functions) 55,286,340 70,290,340 (inverse trigonometric functions) functions 69,70 55,286,340 image( 71,291,340 csc (trigonometric functions) 55,286,340 real( 71,291,340 (inverse trigonometric functions) compound interest (finance caluculation) 55,286,340...
- Page 362 APPENDIX D(cont.) D(cont.) delete LINE 103,106,303,342 ON/OFF 106,113,303,342 (back space key) PICT 106,115,303,342 (clear key) 1,6,11 POINT 106,111,302,342 (delete key) SHADE 88,106,303,342 Files dx (integral functions) 54,286,340 SLIDE SHOW STAT data det (MATH (MATRIX)) 143,330,345 edit df (degree of freedom) 162,182 MATRIX 135,328,345...
- Page 363 APPENDIX F(cont.) E(cont.) EXPRES (express)(FORMAT(graph)) Freq (Frequency) 160,165,178,182 97,283,339,340 Ftest2samp (TEST(STAT)) 180,298,341 ExprOFF (FORM(PRGM)) 250,311,343 function (key board) ExprON (FORM(PRGM)) 249,311,343 functions (complex number) 69,70 FV (future value)(VARS(finance)) 200,309,348 (EZ key) 124,127,128 G_DATA (graph) FACTOR (ZOOM menu) 100,101,304,342 RclGD (recall G_DATA) 114,303,342 Files (delete) StoGD (store G_DATA)
- Page 364 APPENDIX H(cont.) I(cont.) ∫ 54,285,340 (Normal function calculation screen 54,286,340 selection key) Intsct (intersection)(CALC functions) (quit key) 117,118,307,341 HYP (ZOOM menu) 100,102,306,342 inverse hyperbolic functions hyperbolic functions cosh 55,286,340 cosh 53,286,340 sinh 55,286,340 sinh 53,286,340 tanh 55,286,340 tanh 53,286,340 inverse trigonometric functions 55,286,340 I%(VARS(finance)) 200,309,348...
- Page 365 APPENDIX L(cont.) M(cont.) dotted line (···) 103,303,342 mean( 152,293,341 locus( 103,303,342 median( 152,293,341 solid line(—) 103,303,342 min( 152,293,341 line( (DRAW(graph)) 107,301,342 prod( 153,294,341 linear equations 76,337,347 stdDv((standard deviation) 153,294,341 LINK (OPTION) sum( 153,293,341 RECEIVE 261,335,346 varian( (variance) 153,294,341 SEND 261,334,346 MATH(MATRIX) LINKdata (select) 143,330,345...
- Page 366 APPENDIX M(cont.) O(cont.) Mixed (Real)(fraction display method) ON (EXPRESS)(graph) 97,283,339 23,283,339 ON (power) memory backup battery ON (Y’)(graph) 97,283,339 MOVE 226, 227,283,339 ON/OFF 106,113,168,303,342,331,346 MOVE (EDIT(slide show) 226,336,347 ON/OFF (DRAW operations) 106,113,303,342 multiplication (*) ON/OFF(statplot) PlotOFF 331,346 PlotON 331,346 One line editor 24,283,339 N-BASE (number base)(LOGIC) 67,291,341...
- Page 367 APPENDIX P(cont.) P(cont.) P/Y (payments per year)(VARS(finance)) PntOFF( (point OFF)(POINT) 112,302,342 202,309,348 PntON( (point ON)(POINT) 112,302,342 Param (COORD(PRGM)) 248,310,343 PxlCHG( 112,302,342 Param (parametric)(COORD(coordinate)) PxlOFF( 112,302,342 22,282,339 PxlON( 112,302,342 Param (parametric equation) 22,23,282,339 PxlTST( 112,302,342 parentheses ( )(input) POINT (DRAW operations) 106, 111,302,342 pdfχ...
- Page 368 APPENDIX R(cont.) (statistics) 158~160 Med_Med (median-median method) (statistics) 158~160 172,295,341 quadratic equations 77,338,347 Rg_a+bx 172,295,341 Rg_ab 173,296,341 (quit key) Rg_ae 173,297,341 Rg_ax+b 172,295,341 Rg_ax 174,297,341 r∠θ (Complex)(fraction display method) Rg_ln 173,296,341 23,283,339 Rg_log 173,296,341 Rθ equation menu (EQVARS(PRGM)) Rg_logistic 174,297,341 252,317,344 Rg_sin 174,297,341...
- Page 369 APPENDIX S(cont.) S(cont.) S_PLOT (PRGM) SHADE menu Plt1( 250,312,343 shading function(graph) Plt2( 250,312,343 SHIFT equation (recall) 230,233,336,347 Plt3( 251,312,343 SHIFT equation (store) S_PLOT (command) 250,311,343 SHIFT function 229,336,347 sample program SHIFT/CHANGE function conversion CHANGE function 236,337,347 random substitution SHIFT function 229,336,347 SAVE (SOLVER function) 217,338,347...
- Page 370 APPENDIX S(cont.) S(cont.) SortA (sort in ascending order)(OPE(LIST)) PLOT1~3 163,331,346 149,291,341 stdDv( (standard deviation)(MATH(LIST)) sortA( (OPE(STAT)) 157,170,294,341 153,294,341 SortD (sort in descending order)(OPE(LIST)) step (Newton)(calculation of SOLVER) 149,292,341 Stoline (store program line)(copy(PRGM)) sortD( (OPE(STAT)) 157,170,294,341 251,312,343 specifications STO (store)(ZOOM menu) 100,102,306,342 SPLIT (split screen)(graph) (store memory key)
- Page 371 APPENDIX T(cont.) T(cont.) TBLStep 252,315,343 trans (transpose)(MATH(MATRIX)) TBLStrt 252,315,343 143,330,345 TABLE function 90,121~124 TRIG (ZOOM)(graph) tan (trigonometric functions) 102,306,342 (inverse trigonometric functions) cosh 102,306,342 X (TRIG)(ZOOM)(graph) 102,306,342 coshX 102,306,342 tanh (hyperbolic functions) 55,286,340 cosX 102,305,342 tanh (inverse hyperbolic functions) 102,306,342 55,286,340 sinh 102,306,342...
- Page 372 APPENDIX V(cont.) X(cont.) L_DATA 252,313,343 (reciprocal) PICTUR (picture) 252,314,343 xmax (statistics) 158~160 STAT 252,315,343 xmin (statistics) 158~160 STOWIN 252,312,343 xnor (LOGIC) 68,291,341 TABLE 252,315,343 xor (LOGIC) 68,291,341 WINDOW 252,312,343 Xth roots ( ◊ VARS (FINANCE) 210,309,348 XY equation menu (EQVARS(PRGM)) VARS (finance) 252,315,344 C/Y (compounding periods per year)
- Page 373 APPENDIX Z(cont.) FACTOR 100,101,304,342 100,102,306,342 POWER 100,102,305,342 Rapid zoom RCL (recall) 100,102,306,342 STO (store) 100,102,306,342 TRIG 100,102,305,342 ZOOM 100,304,342 ZOOM (window) ZOOM (ZOOM menu) 100,304,342 ZOOM (graph) 82,100,304,342 Ztest1prop (TEST(STAT)) 186,298,341 Ztest1samp (TEST(STAT)) 185,298,341 Ztest2prop (TEST(STAT)) 187,298,341 Ztest2samp (TEST(STAT)) 186,298,341...