Sign In
Upload
Manuals
Brands
Renesas Manuals
Motherboard
R0E420000MCU00
Renesas R0E420000MCU00 Manuals
Manuals and User Guides for Renesas R0E420000MCU00. We have
1
Renesas R0E420000MCU00 manual available for free PDF download: User Manual
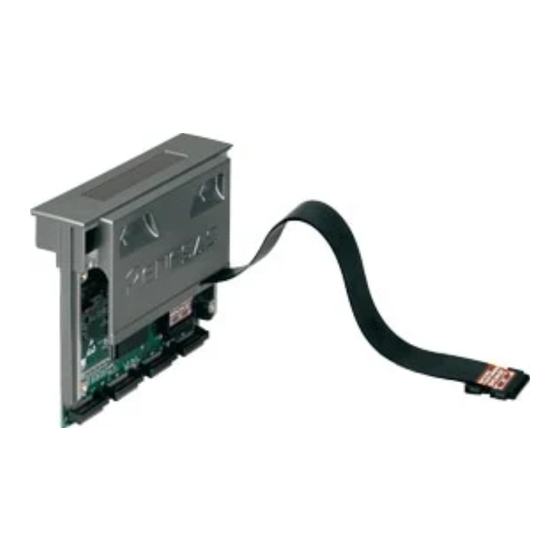
Renesas R0E420000MCU00 User Manual (230 pages)
Supported Devices: H8S Family / H8S/Tiny Series
Brand:
Renesas
| Category:
Motherboard
| Size: 4 MB
Table of Contents
Important
5
Precautions for Safety
7
Contents
9
Table of Contents
10
User Registration
14
Terminology
15
Outline
16
Package Components
16
Other Tool Products Required for Development
16
System Configuration
17
Names and Functions of the Emulator Parts
18
Specifications
20
Product Specifications
20
Regulatory Compliance Notices
21
Operating Environment
22
Setup
24
Flowchart of Starting up the Emulator
24
Installing the Included Software
26
Connecting the MCU Unit to and Disconnecting It from the E100 Emulator Main Unit
27
Connecting the Host Machine
28
Connecting the Emulator Power Supply
29
Turning on the Power
30
Checking the Connections of the Emulator System
30
Turning the Power on and off
30
Self-Checking
31
Selecting the Clock Supply
32
Clock Source
32
Using an Internal Oscillator Circuit Board
33
Using the Oscillator Circuit on the User System
34
Using the Internal Generator Circuit
34
Connecting the User System
35
Connection to an 80-Pin 0.65-MM Pitch Pad Pattern
36
Connection to an 80-Pin 0.5-MM Pitch Pad Pattern
37
Connection to a 64-Pin 0.8-MM Pitch Pad Pattern
38
Connection to a 64-Pin 0.5-MM Pitch Pad Pattern
39
Tutorial
40
Introduction
40
Starting the High-Performance Embedded Workshop
41
Connecting the Emulator
41
Downloading the Tutorial Program
42
Displaying the Source Program
43
Setting Software Breakpoints
44
Executing the Program
45
Resetting the CPU
45
Checking Breakpoints
46
Altering Register Contents
47
Referring to Symbols
48
Checking Memory Contents
49
Referring to Variables
50
Showing Local Variables
52
Single-Stepping through a Program
52
Executing Step in Command
53
Executing the Step out Command
54
Executing the Step over Command
55
Forcibly Breaking Program Execution
56
Hardware Break Facility
57
Stopping a Program When It Executes the Instruction at a Specified Address
57
Stopping a Program When It Accesses Memory
58
Tracing Facility
59
Showing the Information Acquired in "Fill until Stop" Tracing
60
Showing the Information Acquired in "Fill Around TP" Tracing
63
Showing a History of Function Execution
65
Filter Facility
67
Stack Trace Facility
69
What Next
70
Preparation for Debugging
71
Starting the High-Performance Embedded Workshop
71
Creating a New Workspace (Toolchain Unused)
72
Creating a New Workspace (with a Toolchain in Use)
74
Opening an Existing Workspace
77
Connecting the Emulator
78
Reconnecting the Emulator
78
Disconnecting the Emulator
78
Quitting the High-Performance Embedded Workshop
78
Making Debugging-Related Settings
79
Specifying a Module for Downloading
79
Setting up Automatic Execution of Command Line Batch Files
80
Debugging Functions
81
Setting up the Emulation Environment
83
Emulator Settings During Booting up
83
Setting up the Target MCU
84
Setting up the System
85
Setting for Overwriting Blocks of the Flash ROM
87
Settings to Request Notification of Exceptional Events
88
Viewing the Progress of Boot-Up Processing
89
Downloading a Program
91
Viewing the Source Code
91
Turning Columns in All Source Files off
93
Turning Columns off for One Source File
93
Viewing Assembly Language Code
94
Correcting Assembly Language Code
95
Viewing Memory Data in Real Time
96
Setting the Update Interval for RAM Monitoring
97
Clearing RAM Monitoring Access History
97
Clearing RAM Monitoring Error Detection Data
97
Viewing the Current Status
98
Viewing the Emulator Status
98
Viewing the Emulator Status in the Status Bar
99
Periodically Reading out and Showing the Emulator Status
100
Periodically Reading out and Showing the Emulator Information
100
Selecting the Items to be Displayed
101
Using Software Breakpoints
102
Adding and Removing Software Breakpoints
102
Enabling and Disabling Software Breakpoints
104
Using Events
106
Adding Events
106
Removing Events
112
Registering Events
114
Creating Events for each Instance of Usage or Reusing Events
116
Activating Events
117
Setting Hardware Break Conditions
118
Setting Hardware Breakpoints
118
Saving/Loading Hardware Break Settings
121
Viewing Trace Information
122
Acquiring Trace Information
122
Setting Conditions for Trace Information Acquisition
124
Selecting the Trace Mode
126
Setting Trace Points
128
Setting Extraction or Elimination Conditions
132
Selecting the Type of Trace Information to be Acquired
134
Viewing Trace Results
135
Filtering Trace Information
137
Searching for Trace Records
139
Saving Trace Information in Files
140
Loading Trace Information from Files
141
Temporarily Stopping Trace Acquisition
141
Restarting Trace Acquisition
141
Switching the Timestamp Display
141
Viewing the History of Function Execution
142
Viewing the History of Task Execution
143
Measuring Performance
144
Viewing the Results of Performance Measurement
144
Setting Performance Measurement Conditions
145
Starting Performance Measurement
147
Clearing Performance Measurement Conditions
148
Clearing Results of Performance Measurement
148
Maximum Time of Performance Measurement
148
Measuring Code Coverage
149
Opening the Code Coverage Window
149
Allocating Code Coverage Memory (Hardware Resource)
150
Code Coverage in an Address Range
153
Code Coverage in a Source File
154
Showing Percentages and Graphs
155
Sorting Coverage Data
156
Searching for Nonexecuted Lines
157
Clearing Code Coverage Information
158
Updating Coverage Information
158
Preventing Updates to Coverage Information
158
Saving the Code Coverage Information in a File
159
Loading Code Coverage Information from a File
159
Modes of Loading for Coverage Information Files
160
Displaying Code Coverage Information in the Editor Window
162
Measuring Data Coverage
163
Opening the Data Coverage Window
163
Allocating Data Coverage Memory (Hardware Resource)
164
Data Coverage in an Address Range
166
Data Coverage in Sections
167
Data Coverage in the Task Stack
168
Clearing Data Coverage Information
169
Updating Coverage Information
169
Preventing Updates to Coverage Information
169
Saving the Data Coverage Information in a File
170
Loading Data Coverage Information from a File
170
Viewing Realtime Profile Information
172
Selecting a Realtime Profile Measurement Mode
174
Measuring Function Profiles
175
Setting Ranges for Function Profile Measurement
176
Saving Function Profile Measurement Settings
177
Loading Function Profile Measurement Settings
177
Measuring Task Profiles
178
Setting Ranges for Task Profile Measurement
179
Saving Task Profile Measurement Settings
180
Loading Task Profile Measurement Settings
180
Clearing Results of Realtime Profile Measurement
181
Saving Results of Realtime Profile Measurement
181
Setting the Unit of Measurement
181
Maximum Measurement Time for Realtime Profiles
182
Detecting Exceptional Events
183
Detecting Violations of Access Protection
183
Setting Protection for an Area
185
Detecting Reading from a Non-Initialized Area
189
Detecting Stack Access Violations
190
Detecting a Performance-Measurement Overflow
191
Detecting a Realtime Profile Overflow
191
Detecting a Trace Memory Overflow
192
Detecting Task Stack Access Violations
192
Setting a Task Stack Area
193
Detecting an os Dispatch
197
Using the Start/Stop Function
198
Opening the Start/Stop Function Setting Dialog Box
198
Specifying the Work Address
198
Specifying the Routine to be Executed
198
Limitations of the Start/Stop Function
199
Limitations on Statements Within Specified Routines
199
Using the Trigger Output Function
200
Using the External Trigger Cable for Output
200
Opening the Trigger Output Conditions Dialog Box
201
Manual Setting for Output through Trigger Pins 31 to 24
202
Setting for Output through Trigger Pins 20 to 16
204
Events
205
Measuring the Execution Times in a Specific Section
205
Setting Trace Conditions
205
Acquiring Trace Data
206
Specifying a Section
206
Saving the Execution Times to a File
207
Troubleshooting (Action in Case of an Error)
208
Flowchart for Remediation of Trouble
208
Error in Self-Checking
209
Errors Reported in Booting-Up of the Emulator
210
How to Request Support
212
Hardware Specifications
213
Target MCU Specifications
213
Differences between the Actual MCU and Emulator
214
Connection Diagram
216
Connection Diagram for the R0E420000MCU00
216
External Dimensions
217
External Dimensions of the E100 Emulator
217
External Dimensions of the Converter Board (R0E420000CFJ30)
218
External Dimensions of the Converter Board (R0E420000CFK30)
219
External Dimensions of the Converter Board (R0E420000CFG40)
220
External Dimensions of the Converter Board (R0E420000CFK40)
221
Notes on Using the MCU Unit
222
Maintenance and Warranty
226
User Registration
226
Maintenance
226
Warranty
226
Repair Provisions
227
How to Request Repairs
227
Revision History
228
Advertisement
Advertisement
Related Products
Renesas R0K866597D020BR
Renesas R0K572167
Renesas R0K5R8C34DK2HBR
Renesas R0K521276S001BE
Renesas RC32504A
Renesas RTKA489204DK0000BU
Renesas RTKA489000DE0000BU
Renesas RTK0EE0007D01001BJ
Renesas RTKA211450DE0010BU
Renesas RZ/V2MA
Renesas Categories
Computer Hardware
Motherboard
Microcontrollers
Adapter
Switch
More Renesas Manuals
Login
Sign In
OR
Sign in with Facebook
Sign in with Google
Upload manual
Upload from disk
Upload from URL