Sign In
Upload
Manuals
Brands
Corelis Manuals
Measuring Instruments
BusPro-I
Corelis BusPro-I I2C Bus Analyzer Manuals
Manuals and User Guides for Corelis BusPro-I I2C Bus Analyzer. We have
1
Corelis BusPro-I I2C Bus Analyzer manual available for free PDF download: User Manual
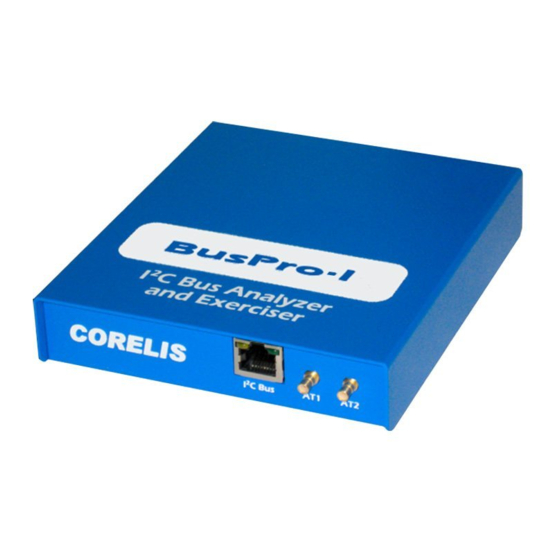
Corelis BusPro-I User Manual (250 pages)
I2C Bus Analyzer, Exerciser, Programmer, and Tester
Brand:
Corelis
| Category:
Measuring Instruments
| Size: 11 MB
Table of Contents
Table of Contents
5
Chapter 1 Product Overview
15
Introduction to I 2 C and Smbus
15
Figure 1. I 2 C Bus Topology
15
Introduction to the Buspro-I
16
Figure 2. Illustration of the Buspro-I
16
Software Toolset
17
Hardware Features
18
Host Computer Requirements
20
Chapter 2 Installation
21
Table 1. Optional Interface Cables
21
Installing the I2C Exerciser Application Software
22
Figure 3. I2C Exerciser Installation Wizard
22
Figure 4. Windows Run Dialog
23
Figure 5. License Agreement Screen
23
Figure 6. Customer Registration Screen
24
Figure 7. Destination Folder Screen
25
Figure 8. Select Program Folder Screen
26
Figure 9. Completing the Installation Wizard Screen
27
Figure 10. Windows 7 Security Warning Pop-Up Window
28
Figure 11. Windows XP Logo Test Warning Pop-Up Window
28
Figure 12. Software Installation Button on the Windows XP Task Bar
29
Figure 13. Installation Completed Screen
30
Buspro-I Hardware Installation
31
Figure 14. Found New Hardware Wizard - Welcome Screen (Windows XP)
31
Figure 15. Found New Hardware Wizard - Install Options (Windows XP)
32
Figure 16. Windows XP Logo Test Warning Pop-Up Window
33
Figure 17. Found New Hardware Wizard - Installation Complete (Windows XP)
34
Figure 18. Windows Device Manager (Windows XP)
35
Chapter 3 Getting Started
37
Overview
37
Tutorial - Using Demo Mode
37
Figure 19. Initial I2C Exerciser Warning Message When Buspro-I Is Not Initially Connected
38
Figure 20. Tools Menu Demo Mode Selection
39
Figure 21. Status Bar Indicating Demo Mode
39
Figure 22. Begin Monitor Data Collection
40
Figure 23. Demo Mode Reminder Pop-Up Window
40
Figure 24. Run Status Tab
41
Figure 25. Monitor Window Centered on Trigger Line
42
Figure 26. Monitor Window Right-Click Pop-Up Menu
43
Figure 27. Monitor Window Trace List Positioned on Trigger Line
44
Figure 28. Monitor Window Right-Click Pop-Up Menu Selecting Trigger Settings
45
Figure 29. Configuration Manager Trigger Setup Screen
46
Figure 30. Monitor Window Trace List Column Headings
47
Figure 31. I2C Exerciser Status Bar
47
Figure 32. Go to Start Tool Bar Button
48
Figure 33. Monitor Window Trace List Showing Symbolic Address and Data Entries
49
Figure 34. Configuration Manager Symbols Definition Screen
50
Figure 35. Symbol Definition Dialog
51
Figure 36. Configuration Manager Symbols Definition Screen with DAC Symbol
52
Figure 37. Monitor Window Trace List Showing New DAC Symbolic Address Entries
53
Figure 38. Monitor Window Trace List Data Byte Column Right-Click Pop-Up Menu
54
Figure 39. Monitor Window Trace List Data Column with Symbols Disabled
55
Figure 40. Monitor Window Trace List Data Byte Column Right-Click Pop-Up Menu
56
Figure 41. Monitor Window Trace List Data Column with Data Bytes in Binary Format
56
Figure 42. Monitor Window Trace List Data Byte Column Right-Click Pop-Up Menu
57
Figure 43. Monitor Window Trace List in Compact Mode
58
Figure 44. Monitor Window Trace List in Compact Mode with Data Bytes Pop-Up Window
59
Figure 45. Monitor Window Trace List I/O 2 Right-Click Pop-Up Menu
60
Figure 46. Dragging Monitor Window Trace List I/O 1 Column Heading
60
Figure 47. Monitor Window Trace List with Rearranged I/O Columns
61
Figure 48. Trace Layout Dialog
62
Figure 49. Monitor Window Timing Display
63
Figure 50. Monitor Window Trace List Positioned on Cursor a Line
64
Figure 51. Monitor Window Trace List Positioned on Cursor B Line
65
Figure 52. Monitor Window Timing Display Showing Edges Zoomed in at Line 100
66
Figure 53. Monitor Window Timing Display Measuring the Time between Cursors a & B
67
Figure 54. Go to Start Tool Bar Button
68
Figure 55. Find Tool Bar Button
69
Figure 56. Find Dialog
69
Figure 57. Find a Data Value of 2E
71
Figure 58. Monitor Window Trace List Showing Find 2E Data Result
72
Figure 59. Find a Data Value of 72
73
Figure 60. Clear Tagged Rows Prompt
73
Figure 61. Matched Transactions Prompt
74
Figure 62. Monitor Window Trace List Showing Find 72 Data Result
74
Figure 63. Go to Tagged Row Tool Bar Button
75
Figure 64. Monitor Window Trace List Showing the Second Find 72 Data Result
75
Figure 65. Monitor Colors Preferences Screen
76
Figure 66. Monitor Colors Preferences Screen Changing Cursor a Background Color
77
Figure 67. Monitor Window with Updated Cursor a Colors
78
Figure 68. Monitor Window with Updated Cursor a Colors
79
Figure 69. Monitor Window with Alternating Row Colors
80
Figure 70. Monitor Window Trace List with the Trigger Line Centered
81
Figure 71. Monitor Options Preferences Screen
82
Figure 72. Monitor Window Trace List with Trigger at Line Zero Numbering
83
Figure 73. Monitor Window Trace List with Trigger Is Time Zero Timestamps
84
Figure 74. Monitor Window Trace List with Relative Timestamps
85
Figure 75. Monitor Window Trace List Showing Addresses in FE Mode
86
Figure 76. Monitor Window Trace List Showing Addresses in 7F Mode
87
Tutorial - Using Live Mode
88
Figure 77. Tools Menu Deselect Demo Mode
88
Figure 78. Status Bar Indicating Live Data Mode
88
Figure 79. Analyzer Supplied Mode Prompt
89
Figure 80. Debugger Window
90
Figure 81. Byte Sent from the Debugger
91
Figure 82. Receive Three Bytes in the Debugger
92
Figure 83. Capture of Debugger Send
93
Figure 84. Tutorial Script Loaded into Debugger
94
Figure 85. Capture of Debugger Script
95
Figure 86. Set Discrete I/O Modes
96
Figure 87. Debugger Discrete I/O Script
97
Figure 88. Monitor Debugger Discrete I/O Manipulation
97
Figure 89. Debugger Close
98
Figure 90. Smbus Raw Data
99
Figure 91. Smbus Pane before Associating Decoder File
100
Figure 92. Smbus Decoder File Dialog with TC74 Information
101
Figure 93. Switch to Smbus Mode
102
Figure 94. Smbus Decoded Data
102
Figure 95. Decoded Smbus Message Tooltip
103
Figure 96. Smbus Data Window
103
Chapter 4 Connecting to a Target
105
Connecting the I C Signals
105
Table 2. Flying Leads Serial Bus Connector Pin Assignments
105
Figure 97. RJ45 Connector Pin Numbering
106
Table 3. 4-Pin Crimp Cable Pin Assignments
106
Interface Setup
107
Figure 98. Configuration Manager
108
Figure 99. Analyzer Supplied Voltage Prompt
109
Figure 100. Configuration Manager Analyzer Supplied
110
Figure 101. Configuration Manager Settings Pane
112
Figure 102. Bus Electrical Features
113
Figure 103. Bus Drive and Monitoring Features
114
Figure 104. Input/Output Signals
115
Figure 105. Monitor Buffer Options
116
Chapter 5 Bus Traffic Monitor
117
Figure 106. Monitor Window
117
Trace Listing
118
Figure 107. Monitor Trace Listing
118
Timing Field
121
Figure 108. Monitor Timing Field
121
Figure 109. Timing Field Popup Menu
123
Monitor Configurations
124
Figure 110. Filters Pane
125
Figure 111. Filter Definition Dialog (Similar to Edit)
126
Figure 112. Symbols Pane
127
Figure 113. Symbol Definition Dialog
128
Figure 114. Smbus Pane
129
Figure 115. Smbus Decoder File Dialog
130
Monitor Preferences
131
Figure 116. Monitor Colors Pane
131
Figure 117. Monitor Options Pane
133
Figure 118. Formats Pane
134
Monitor Trigger
135
Figure 119. Trigger Tab on Monitor Tools Dialog
135
Table 4. Summary of Available Trigger Components
136
Figure 120. Trigger on Single Event
139
Figure 121. Trigger on Repeated Single Event
140
Figure 122. Trigger on Sequence of Multiple Events
141
Figure 123. Trigger on Consecutive Sequence of Events
142
Figure 124. Trigger Dialog
143
Figure 125. Context Popup Menu on Trigger Definition Tree
144
Figure 126. Create New Trigger Dialog
145
Figure 127. Active Trigger Operation Status
147
Monitor Window Reference
148
Figure 128. I2C Exerciser Monitor Window Layout
148
Table 5. Monitor Window Layout
148
Figure 129. Monitor File Menu
149
Figure 130. Monitor Trace Menu
150
Figure 131. Trace | Execute Submenu
151
Figure 132. Run Status Tab on Monitor Tools Window
152
Figure 133. Trace | Go to Submenu
153
Figure 134. Trace | View Submenu
154
Figure 135. Monitor Find Dialog - Regular
155
Figure 136. Monitor Find Dialog - Compact
155
Figure 137. Trace Layout Dialog
157
Figure 138. Tools Menu
158
Figure 139. Monitor Window Menu
159
Figure 140. Monitor Help Menu
159
Figure 141. Monitor Tool Bar
160
Table 6. Monitor Tool Bar Functions
161
Chapter 6 Interactive Debugger
163
Figure 142. Debugger Window
163
Send Data
164
Figure 143. Debugger Send Controls
164
Receive Data
166
Figure 144. Debugger Receive Controls
166
Debugger Script
168
Table 7. Debugger Script Keywords
169
Debugger Options
171
Figure 145. Debugger Options Pane
171
Debugger Window Reference
173
Figure 146. I2C Exerciser Debugger Window Layout
173
Table 8. Debugger Window Layout
173
Figure 147. Debugger File Menu
174
Figure 148. Debugger Tool Bar
175
Table 9. Debugger Tool Bar Functions
175
Chapter 7 Serial EEPROM Programmer
177
Programmer Operations
178
Figure 149. Programmer Window
178
Table 10. Programmer Function Descriptions
179
Figure 150. Programmer Read Window
180
Table 11. Programmer Read Contents Window Function Descriptions
180
Figure 151. Programming Progress Window
181
Figure 152. Verifying Progress Window
181
Figure 153. Erasing Progress Window
181
Programmer Options
182
Figure 154. Programmer Options Pane
182
Programmer Window Reference
183
Figure 155. I2C Exerciser Programmer Window
183
Table 12. Programmer Window Areas
183
Figure 156. Programmer File Menu
184
Figure 157. Programmer Tool Bar
185
Table 13. Programmer Tool Bar Functions
185
Chapter 8 Configuration and Preferences
187
Configuration Manager
187
Figure 158. Configuration Manager Dialog Panes (Settings Selected)
188
Table 14. Configuration Manager Panes
189
Figure 159. Filters Pane
190
Figure 160. Filter Definition Dialog (Similar to Edit)
191
Figure 161. Symbols Pane
192
Figure 162. Symbol Definition Dialog
193
Figure 163. Smbus Pane
194
Figure 164. Smbus Decoder File Dialog
195
Figure 165. Settings Pane
196
Figure 166. Files Pane
200
Preferences Dialog
201
Figure 167. Monitor Colors Pane
201
Figure 168. Monitor Options Pane
202
Figure 169. Debugger Options Pane
203
Figure 170. Programmer Options Pane
204
Figure 171. Formats Pane
205
Using Project Files
206
Figure 172. Title Bar for a New Project
206
Figure 173. Title Bar for a Saved Project
207
Figure 174. File Menu MRU Project List
207
Calibration
208
Figure 175. Calibration Prompt
208
Figure 176. Calibration Warning
208
Figure 177. Calibration Status
209
Figure 178. Calibration Complete
209
Chapter 9 Third Party Application Interface
211
Overview
211
Dynamic Link Library (DLL)
212
Table 15. DLL Components
212
General Calling Sequence
213
Function Reference
214
Table 16. I2C DLL Functions
215
Appendix A Buspro-I Hardware Reference
247
Hardware Specifications
247
Electrical Specifications
248
Advertisement
Advertisement
Related Products
Corelis CAS-1000-I2C/E
Corelis Categories
Measuring Instruments
Controller
Computer Hardware
More Corelis Manuals
Login
Sign In
OR
Sign in with Facebook
Sign in with Google
Upload manual
Upload from disk
Upload from URL