
Related Manuals for Corelis BusPro-I

Summary of Contents for Corelis BusPro-I
- Page 1 CORELIS ™ BusPro-I I2C Bus Analyzer, Exerciser, Programmer, and Tester User’s Manual Corelis, Inc. 13100 Alondra Blvd. Cerritos, CA 90703 Telephone: 562.926.6727 • Fax: (562) 404-6196...
- Page 3 CORELIS. This manual is a CORELIS proprietary document and may not be transferred to another party without the prior written permission of CORELIS. CORELIS assumes no responsibility for the use of or reliability of its software on equipment that is not furnished by CORELIS.
- Page 4 The latest news, tips and updates on the Corelis bus analyzer hardware and software products can be found in the Corelis user forums. The forums are provided as a free service to our existing customers but an individual user name and password is required. To request an account, please visit forums.corelis.com/register.php...
-
Page 5: Table Of Contents
Table of Contents Chapter 1 Product Overview ..................1 Introduction to I C and SMBus......................1 Introduction to the BusPro-I™ ......................2 Software Toolset............................. 3 Hardware Features ..........................4 Host Computer Requirements....................... 6 Chapter 2 Installation....................7 Installing the I2C Exerciser Application Software................8 BusPro-I Hardware Installation ...................... - Page 6 Chapter 9 Third Party Application Interface ............197 Overview .............................. 197 Dynamic Link Library (DLL)....................... 198 General Calling Sequence ......................... 199 Function Reference ..........................200 Appendix A BusPro-I Hardware Reference ............233 Hardware Specifications ........................233 Electrical Specifications ........................234...
- Page 7 Figure 17. Found New Hardware Wizard – Installation Complete (Windows XP) ........20 Figure 18. Windows Device Manager (Windows XP) ................21 Figure 19. Initial I2C Exerciser Warning Message when BusPro-I is Not Initially Connected ....24 Figure 20. Tools Menu Demo Mode Selection................... 25 Figure 21.
- Page 8 Figure 49. Monitor Window Timing Display....................49 Figure 50. Monitor Window Trace List Positioned on Cursor A Line ............50 Figure 51. Monitor Window Trace List Positioned on Cursor B Line ............51 Figure 52. Monitor Window Timing Display Showing Edges Zoomed in at Line 100 ........ 52 Figure 53.
- Page 9 Figure 104. Input/Output Signals ......................101 Figure 105. Monitor Buffer Options ......................102 Figure 106. Monitor Window ........................103 Figure 107. Monitor Trace Listing ......................104 Figure 108. Monitor Timing Field ......................107 Figure 109. Timing Field Popup Menu ..................... 109 Figure 110.
- Page 10 Figure 159. Filters Pane ........................... 176 Figure 160. Filter Definition Dialog (similar to Edit).................. 177 Figure 161. Symbols Pane ........................178 Figure 162. Symbol Definition Dialog....................... 179 Figure 163. SMBus Pane ......................... 180 Figure 164. SMBus Decoder File Dialog....................181 Figure 165.
- Page 11 List of Tables Table 1. Optional Interface Cables ....................... 7 Table 2. Flying Leads Serial Bus Connector Pin Assignments ..............91 Table 3. 4-Pin Crimp Cable Pin Assignments .................... 92 Table 4. Summary of available Trigger Components ................122 Table 5. Monitor Window Layout ......................134 Table 6.
- Page 13 Chapter 4: Connecting to a Target This chapter provides you with instructions on how to hook up the BusPro-I to a target board and describes the initial software settings that you should be aware of to have the BusPro-I working properly.
- Page 14 Chapter 9: Third Party Application Interface This chapter provides a reference on all of the function calls available for use in third party software applications that control the BusPro-I analyzer through the provided dynamic link library (DLL). Appendix A: BusPro-I Hardware Reference This appendix presents the physical and electrical specifications for the BusPro-I hardware.
-
Page 15: Chapter 1 Product Overview
Chapter 1 Product Overview BusPro-I™ Bus Analyzer and I2C Exerciser product overview Introduction to I C and SMBus The I C bus was developed by Philips for basic communication between devices. It has since evolved, increasing in performance and finding many new applications including data transfer and system-level command-and-control. -
Page 16: Introduction To The Buspro-I
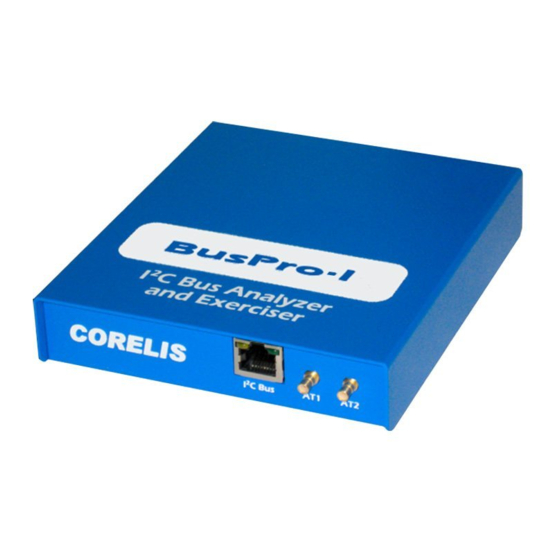
The BusPro-I pod, shown in Figure 2, connects to the PC via a high-speed USB 2.0 port and can operate either with the provided I2C Exerciser software application, or using the included API of C/C++ library function calls from third party software applications such as National Instruments’... -
Page 17: Software Toolset
SCL and SDA signals is depicted showing the edge transition history. Debugger Using the Debugger tool, the BusPro-I can be utilized to send and receive individual messages on the C bus. Looping is supported for repeating I/O patterns to facilitate external signal observation. -
Page 18: Hardware Features
USB Port Host Interface The BusPro-I uses a high-speed USB 2.0 interface for easy connection to a PC. The host PC supplies operating power to the unit and the hot-plug feature of the USB standard is fully supported. You simply plug the BusPro-I into a PC USB 2.0 socket and it will be automatically detected, configured, and then... - Page 19 The BusPro-I receives the standard power available from the host USB port. Built-in Self-Test The BusPro-I has a built-in self-test capability. Logic is provided to loop back bus signals from the target connector. This enables a basic go/no-go confidence testing of its operation. It is launched from the Tools menu and requires that there be no external target attached.
-
Page 20: Host Computer Requirements
Host Computer Requirements I2C Exerciser is a 32-bit Microsoft Windows®-based application which controls the BusPro-I. The PC on which it will be installed should meet the following minimum requirements: One available USB 2.0 Port Windows® XP (SP2), Windows® Vista, Windows® 7, or Windows® 8 3.2 GHz Pentium®... -
Page 21: Chapter 2 Installation
Installing the I2C Exerciser software and the BusPro-I hardware Prior to installation, please verify that the following I2C Exerciser software and BusPro-I hardware materials are present and free from visible damage or defects. If anything appears to be missing or damaged, please contact Corelis immediately. -
Page 22: Installing The I2C Exerciser Application Software
You must first install the I2C Exerciser application software, and then connect the BusPro-I controller. The application software contains the driver for the BusPro-I. The BusPro-I controller is a hot-pluggable USB device. However, you should not plug in or unplug the BusPro-I while the I2C Exerciser application is running. The BusPro-I CD-ROM contains the installation program. -
Page 23: Figure 4. Windows Run Dialog
If the installation program does not automatically begin, go to the Windows Start Menu and select Start, then Run. The Run dialog box will appear as shown in Figure 4. Type “[D]:\setup.exe” where [D] is the CD-ROM drive letter. Click on the OK button to run the installation program. Figure 4. -
Page 24: Figure 6. Customer Registration Screen
Review the entire agreement, and if you agree, select I accept the terms of the license agreement, and then click on the Next button. The Customer Registration screen shown in Figure 6 will then be displayed. Figure 6. Customer Registration Screen Type in or change the Full Name and Organization as needed, then click on the Next button. -
Page 25: Figure 7. Destination Folder Screen
Accept the default installation folder, or customize your installation by selecting the Change button. It is strongly recommended that the application be installed in the default folder. Figure 7. Destination Folder Screen Click on the Next button, and the Select Program Folder screen shown in Figure 8 will be displayed. Installation... -
Page 26: Figure 8. Select Program Folder Screen
Select Anyone who uses this computer or Only for me. By default, the installer will place a shortcut icon for the I2C Exerciser on your desktop. If you do not wish this shortcut to be created, uncheck the checkbox on this screen. Figure 8. -
Page 27: Figure 9. Completing The Installation Wizard Screen
To change any installation parameters, click on the Back button. Otherwise, click on the Next button and the installation process will begin. Figure 9. Completing the Installation Wizard Screen The installer copies the program files to the specified folder and support files to the Windows system folders. -
Page 28: Figure 10. Windows 7 Security Warning Pop-Up Window
If you are running Windows 7 or Vista, the software installation may be interrupted by the operating system by displaying warning pop-up windows as shown in Figure 10. If this occurs, click on the Install this driver software anyway button to safely ignore the warnings and proceed with the installation. Figure 10. -
Page 29: Figure 12. Software Installation Button On The Windows Xp Task Bar
The warning pop up windows may be hidden behind the installation window. If this happens, the installation progress bar will stop updating and the installation may appear to be hung. Bring the warning pop up windows to the foreground by clicking on the Software Installation button on the Windows task bar as shown in Figure 12. -
Page 30: Figure 13. Installation Completed Screen
The Installation Completed screen shown in Figure 13 will appear to indicate that the installation is complete. Click on the Finish button to exit from the installation program. Figure 13. Installation Completed Screen Installation... -
Page 31: Buspro-I Hardware Installation
1. You should have already installed the I2C Exerciser at this point. If not, please do so before continuing with hardware installation. 2. Connect a USB 2.0 compatible cable from the BusPro-I USB 2.0 connector to any available USB 2.0 connector on your PC. -
Page 32: Figure 15. Found New Hardware Wizard - Install Options (Windows Xp)
5. The dialog shown in Figure 15 will pop up. Click on Install the software automatically (Recommended) and click on the Next button. Figure 15. Found New Hardware Wizard - Install Options (Windows XP) Installation... -
Page 33: Figure 16. Windows Xp Logo Test Warning Pop-Up Window
6. The Hardware Wizard will attempt to locate the driver that was installed with the I2C Exerciser software. Under Windows XP, a warning dialog box will pop up as shown in Figure 16. You can safely ignore the warning and continue the installation process by pressing the Continue Anyway button. Figure 16. -
Page 34: Figure 17. Found New Hardware Wizard - Installation Complete (Windows Xp)
7. After the necessary files are copied to the system, the dialog box shown in Figure 17 will appear indicating that the driver has been successfully installed. Figure 17. Found New Hardware Wizard – Installation Complete (Windows XP) Installation... -
Page 35: Figure 18. Windows Device Manager (Windows Xp)
Serial Bus controllers section as shown in Figure 18. Figure 18. Windows Device Manager (Windows XP) 11. Plug the RJ45 connector end of the target cable into the BusPro-I socket labeled Serial Bus and the other end of the cable can be connected to the target I C bus signals. - Page 36 Installation...
-
Page 37: Chapter 3 Getting Started
I2C Exerciser operation overview and tutorial Overview This chapter will quickly introduce you to the basic usage of the Corelis I2C Exerciser tool for viewing bus traffic via the BusPro-I. Although it is possible to explore the capabilities of this system on your own, working through this chapter is intended to give an immediate feel and appreciation for its ease of use and core functionality. -
Page 38: Figure 19. Initial I2C Exerciser Warning Message When Buspro-I Is Not Initially Connected
Monitor window active. By default, the program will try to detect if the BusPro-I is connected and will enter Live Data mode if the controller is found. If the BusPro-I is not attached to the host PC, you will get the warning message shown in Figure 19 indicating that the controller was not detected and the program will automatically start in Demo Mode. -
Page 39: Figure 20. Tools Menu Demo Mode Selection
Click on the Tools menu and verify that the Demo Mode menu item has a check mark next to it as shown below in Figure 20. This indicates that the program is in Demo Mode. If the BusPro-I was connected to the PC when you started I2C Exerciser, you will have to select this menu item to force the program into Demo Mode. -
Page 40: Figure 22. Begin Monitor Data Collection
Step 3 – Begin the Monitor Window Simulated Bus Activity Click on the Run Single tool bar button (represented by a green arrow) as shown in Figure 22 to begin Monitor data collection of the simulated bus activity. Figure 22. Begin Monitor Data Collection When the program is in Demo Mode and a Run command is invoked, an informational pop-up window as shown in Figure 23 will appear to remind you that the program is currently in Demo Mode. -
Page 41: Figure 24. Run Status Tab
When traffic collection begins, the Run Status tab on the Monitor Tools window will be displayed to show progress information as the trace buffer fills with simulated traffic. You may move or resize this window at any time to obtain a better view of the trace list lines and timing display as shown in Figure 24. Step-by-step color-highlighted progress milestones are provided in the Run Status tab. -
Page 42: Figure 25. Monitor Window Centered On Trigger Line
Step 4 – Close the Monitor Tools Window Click on the Monitor Tools window close button and the window will close allowing a full view of the Monitor window which shows a portion of the trace buffer content. If a user-specified trigger is encountered while acquiring bus traffic, the trace list will automatically be centered on the transaction that satisfied the trigger condition. -
Page 43: Figure 26. Monitor Window Right-Click Pop-Up Menu
Step 5 – View the Trace Data The Monitor window allows the user to examine the captured data in the trace buffer. A vertical scroll bar is available on the right edge of the screen for standard positioning of the lines in addition to use of the page-up and page-down keys. -
Page 44: Figure 27. Monitor Window Trace List Positioned On Trigger Line
Trigger are configured by the user prior to starting data collection. The BusPro-I searches for the user-specified set of conditions while collecting trace data in order to mark the Trigger line and place it in a specific position in the buffer. -
Page 45: Figure 28. Monitor Window Right-Click Pop-Up Menu Selecting Trigger Settings
To access the Trigger setup screen, right-click in the trace list area and select the Trigger… entry from the pop-up menu as shown in Figure 28. The Trigger dialog will appear as shown in Figure 29. Figure 28. Monitor Window Right-Click Pop-up Menu Selecting Trigger Settings The Trigger dialog allows the user to specify particular address, data value, and other miscellaneous event criteria which correspond to the bus transaction of interest. -
Page 46: Figure 29. Configuration Manager Trigger Setup Screen
In Demo mode, the trigger condition is fixed internally and this screen is non-functional. Click on the Close button to close this dialog. Figure 29. Configuration Manager Trigger Setup Screen Getting Started... -
Page 47: Figure 30. Monitor Window Trace List Column Headings
Location – Indicates the device involved in the current transaction as being either a target device on the bus or the BusPro-I analyzer. For address transactions, “Analyzer” means the analyzer is the master (debugger or emulated master), while “Target” means a UUT master is driving. For data transactions (write toward the slave, read from the slave), “Analyzer”... -
Page 48: Figure 32. Go To Start Tool Bar Button
NAK – Blank for normal ACK responses, or will indicate NAK when the cycle is not acknowledged. Error – Blank for normal bus protocol transactions, or will indicate Error if the BusPro-I detected a protocol violation. If an error was detected, the user can click on the Error text and a pop-up window will appear describing the cause of error. -
Page 49: Figure 33. Monitor Window Trace List Showing Symbolic Address And Data Entries
Figure 33. Monitor Window Trace List Showing Symbolic Address and Data Entries Getting Started... -
Page 50: Figure 34. Configuration Manager Symbols Definition Screen
Using the method previously described, right-click in the trace list area of the Monitor window and select the Symbols… pop-up menu entry. This will cause the Configuration Manager Symbols definition screen to be displayed as shown in Figure 34. This screen allows the user to add new symbol definition rules, and to edit or remove existing symbol definition rules. -
Page 51: Figure 35. Symbol Definition Dialog
Click on the Add button and the Symbol Definition dialog shown in Figure 35 will appear. In the Symbol field, type DAC which is an acronym for Digital-to-Analog Converter. In the Addr field, type 18. This will cause the string DAC to be displayed in the address column for any trace list entries with a 7-bit hex address of 18. -
Page 52: Figure 36. Configuration Manager Symbols Definition Screen With Dac Symbol
The Configuration Manager Symbols screen will now contain the newly added DAC entry as shown in Figure 36. Click on the Close button to close the Configuration Manager Symbols screen. Figure 36. Configuration Manager Symbols Definition Screen with DAC Symbol Getting Started... -
Page 53: Figure 37. Monitor Window Trace List Showing New Dac Symbolic Address Entries
With the trace list still showing the beginning of the Demo data, you will now see that lines 17 through 34 are now all displaying the symbol DAC in the address column instead of the raw address value of 18. Lines 46 through 50, lines 78 through 82, and lines 94 through 98 are similarly affected. -
Page 54: Figure 38. Monitor Window Trace List Data Byte Column Right-Click Pop-Up Menu
Right-clicking on the column headings of either the Addr or Data Byte column allows the user to toggle the symbolic translation on and off. Additionally, the pop-up menu allows selection of the numeric display format to either hexadecimal, binary, or decimal. These settings work independently for the Addr and Data Byte columns. -
Page 55: Figure 39. Monitor Window Trace List Data Column With Symbols Disabled
Figure 39. Monitor Window Trace List Data Column with Symbols Disabled Getting Started... -
Page 56: Figure 40. Monitor Window Trace List Data Byte Column Right-Click Pop-Up Menu
Right-click on the Data Byte column heading and select the Binary format menu entry as shown in Figure 40. Observe that the Data Byte column is now displaying values in binary format as shown in Figure 41. Figure 40. Monitor Window Trace List Data Byte Column Right-Click Pop-up Menu Figure 41. -
Page 57: Figure 42. Monitor Window Trace List Data Byte Column Right-Click Pop-Up Menu
Using the method just described, re-enable symbol translation and change the display format back to hexadecimal. The Data Byte column heading pop-up menu also allows the toggling of Compact Mode. This special mode displays all of the data bytes for each message on a single line in the trace list. Enable Compact Mode by right-clicking on the Data Byte column and select the Compact Mode entry as shown in Figure Figure 42. -
Page 58: Figure 43. Monitor Window Trace List In Compact Mode
The trace list data will be reformatted as shown in Figure 43. Some messages may contain more data bytes than will fit on the screen. When the display is in Compact Mode, clicking on any data transaction in the Data Byte column will cause a pop-up Data Bytes window to appear making it possible to view and scroll through all data in the selected message. -
Page 59: Figure 44. Monitor Window Trace List In Compact Mode With Data Bytes Pop-Up Window
Figure 44. Monitor Window Trace List in Compact Mode with Data Bytes Pop-up Window When you have finished viewing the trace list in Compact Mode, close the Data Bytes pop-up window. Then select the Normal Mode selection from the Data Bytes column heading menu to put the trace list display back into Normal mode. -
Page 60: Figure 45. Monitor Window Trace List I/O 2 Right-Click Pop-Up Menu
You can right-click on any column heading and select Hide Column to remove the selected column from the trace list display. This may be useful when the user is not interested in some of the data columns and hiding them can reduce screen clutter. Additionally, you can drag and drop column headings to change the order that the columns are displayed in. -
Page 61: Figure 47. Monitor Window Trace List With Rearranged I/O Columns
After hiding the I/O 2 column and repositioning the I/O 1 column, the Monitor window should now look like Figure 47. Figure 47. Monitor Window Trace List with Rearranged I/O Columns Getting Started... -
Page 62: Figure 48. Trace Layout Dialog
If you wish to unhide one or more previously hidden columns or wish to restore the column layout to its default state, right-click on any column heading and select the Trace Layout menu. The Trace Layout dialog will appear as shown in Figure 48 showing each column and whether or not it is visible. Click on the Default Column Layout button to restore the default column settings and then click on the Close button. -
Page 63: Figure 49. Monitor Window Timing Display
Timing Display The lower portion of the Monitor window contains a graphical representation of the I C bus signal transitions depicted as a timing diagram similar to a logic analyzer. A picture of the timing display is shown in Figure 49. It displays the actual state and edge times of the signals as they transitioned on the bus while conveying transactions. -
Page 64: Figure 50. Monitor Window Trace List Positioned On Cursor A Line
Notice the colored flags that are displayed just above the top Field row of the timing display. These flags indicate the locations of the Trigger marker and the Cursor markers. A cursor is a special marker that can be positioned in the timing display at various points of interest to allow time measurements between any two points. -
Page 65: Figure 51. Monitor Window Trace List Positioned On Cursor B Line
Now right-click in the trace list area of the Monitor window and select the Go to Cursor B pop-up menu entry. This will cause the trace list and timing display to reposition to the Cursor B line as shown in Figure 51. -
Page 66: Figure 52. Monitor Window Timing Display Showing Edges Zoomed In At Line 100
Notice that the time scale has been reduced from 50µs/div to 20µs/div and that the edges appear much larger now revealing more detail. Figure 52. Monitor Window Timing Display Showing Edges Zoomed in at Line 100 Getting Started... -
Page 67: Figure 53. Monitor Window Timing Display Measuring The Time Between Cursors A & B
The Interval A to B field always displays the calculated time difference between the position of Cursor A and Cursor B. Reposition Cursor A by clicking on the small green triangle on the left side of the Field row and, while holding the mouse button, down drag it over the last edge of the previous transaction as shown in Figure 53. -
Page 68: Figure 54. Go To Start Tool Bar Button
Step 6 – Find Operations Push the Go to Start tool bar button as shown in Figure 54 to bring the trace list view to the first entries in the trace listing. This will also cause the first line in the trace list to be highlighted. The Find function will now search for entries starting with the first entry all the way to the end of the trace buffer contents. -
Page 69: Figure 55. Find Tool Bar Button
Click on the Find tool bar button as shown in Figure 55 below. It will bring up the Find dialog shown in Figure 56. Figure 55. Find Tool Bar Button Figure 56. Find Dialog Getting Started... - Page 70 The Less button compacts this dialog to display only the four buttons on top to minimize any obscuring of the Monitor window. This is useful when you have configured the search parameters and want to repeat the same search query many times. While compacted, this button changes to More enabling the user to force the dialog back to its expanded format.
-
Page 71: Figure 57. Find A Data Value Of 2E
Go to the start of the trace list using the Go to Start tool bar button as previously shown. Then in the Find window, enter the value 2E into the Data Byte Value field as shown in Figure 57. Figure 57. Find a Data Value of 2E Getting Started... -
Page 72: Figure 58. Monitor Window Trace List Showing Find 2E Data Result
Click on the Find Next button and the trace listing will go to the only line containing this data value which is on line 13 as shown in Figure 58. Figure 58. Monitor Window Trace List Showing Find 2E Data Result Getting Started... -
Page 73: Figure 59. Find A Data Value Of 72
Go to the start of the trace list using the Go to Start tool bar button as previously shown. Change the Data Byte Value field to 72 as shown in Figure 59. Click on the Tag All button and you will be prompted to clear all existing tags in the trace listing as shown in Figure 60. -
Page 74: Figure 61. Matched Transactions Prompt
When the search is complete, the pop-up window in Figure 61 will appear to notify you how many trace lines matched the search criteria. Click on the OK button and the trace list will display the first tagged line as shown in Figure 62. Lines 22 and 80 will be tagged since they contain the data value 72. Figure 61. -
Page 75: Figure 63. Go To Tagged Row Tool Bar Button
You can click on the Go to Tagged Row tool bar button, shown in Figure 63, to move to the second search result as shown in Figure 64. Repeatedly clicking on the Go to Tagged Row tool bar button will cause the trace list to alternate between the two tagged lines. -
Page 76: Figure 65. Monitor Colors Preferences Screen
Step 7 – Changing Preferences There are a number of user configurable preferences available from the Tools | Preferences menu entry. Right-click in the trace list and select Go to Cursor B from the pop-up menu. Select the Tools | Preferences menu entry and the Preferences dialog will appear. By default, this screen will be displaying the options on the Monitor Colors tab. -
Page 77: Figure 66. Monitor Colors Preferences Screen Changing Cursor A Background Color
Since Cursor A is visible in the trace list, we will change its background color to observe how these color configuration items work. Click on the Cursor A Background control and select the color Blue from the pop-up color picker as shown in Figure 66. Using the same method, click on the Cursor A Text control and select the color White from the pop-up color picker. -
Page 78: Figure 67. Monitor Window With Updated Cursor A Colors
After making these color changes, observe that the Cursor A line in the Monitor window trace list has immediately been painted with the newly selected colors as shown in Figure 67. All of the other items on the Monitor Colors tab can be similarly changed. Figure 67. -
Page 79: Figure 68. Monitor Window With Updated Cursor A Colors
The Color Scheme controls how trace line groupings are displayed. The options are no color, alternating color per line, or alternating color per message (address transaction and all conveyed data to/from that address). The default setting is Alternate color per message, but the user may prefer a different setting. Click on the Color Scheme control and select the Alternate color per row entry as shown in Figure 68. -
Page 80: Figure 69. Monitor Window With Alternating Row Colors
After changing the Color Scheme, observe the resulting effect as shown in Figure 69. Click on the Use Defaults button to reset all of the options on the Monitor Colors tab back to their default settings. Click on the Close button to close the Preferences screen. Figure 69. -
Page 81: Figure 70. Monitor Window Trace List With The Trigger Line Centered
Right-click in the trace list and select Go to | Trigger from the pop-up menu. Use the vertical scroll bar on the right side of the trace list to position the line containing the trigger into the middle of the window as shown in Figure 70. -
Page 82: Figure 71. Monitor Options Preferences Screen
Select the Tools | Preferences menu entry and the Preferences screen will appear. Click on the Monitor Options tab and move the Preferences screen to the middle of the Monitor window as shown in Figure 71. Figure 71. Monitor Options Preferences Screen Getting Started... -
Page 83: Figure 72. Monitor Window Trace List With Trigger At Line Zero Numbering
The Monitor Options tab allows configuration of other Monitor window display options. The Line Column option affects how the Line column in the trace list is displayed. When set to Starting from 1, the trace list rows will start at number one and increment sequentially. This is the default setting. When set to Trigger is line 0, the line containing the trigger will be zero, lines before the trigger will be negative, and lines after the trigger will be positive. -
Page 84: Figure 73. Monitor Window Trace List With Trigger Is Time Zero Timestamps
The Timestamp Start option operates in a similar fashion. When set to Starting from 0, timestamps will increment sequentially starting from the first trace list entry. This is the default setting. When set to Trigger is time 0, the line entry containing the trigger will have a timestamp of zero with lines before the trigger having a negative timestamp and lines after having a positive timestamp. -
Page 85: Figure 74. Monitor Window Trace List With Relative Timestamps
The Timestamp Display option affects how timestamps are calculated and displayed. When set to Absolute, the timestamp displayed for each entry is the absolute time relative to the start of bus traffic acquisition. This is the default setting. When set to Relative, the timestamp displayed for each entry is the elapsed time since the last transaction was recorded. -
Page 86: Figure 75. Monitor Window Trace List Showing Addresses In Fe Mode
Click on the Preferences screen Formats tab and position the screen to the right of the Monitor window as shown in Figure 75. The Formats tab controls how addresses in 7-bit mode will be displayed when shown in hex format. In FE mode, the LSB will always be zero and the 7-bits of address will be left-justified within the byte. -
Page 87: Figure 76. Monitor Window Trace List Showing Addresses In 7F Mode
Click on the 7F mode option and observe how the Addr column changes as shown in Figure 76. The addresses are effectively divided by two since the seven address bits are now displayed in a right-justified format within the byte. Click on the FE mode selection to return this setting to its default state. Click on the Close button to close the Preferences screen. -
Page 88: Tutorial - Using Live Mode
If it is not already connected, you will need to connect the BusPro-I controller by attaching the provided USB cable between the USB port on the back of the BusPro-I and an available USB 2.0 port on the host computer. Refer to the Installation chapter for detailed installation instructions. No target should be connected to the BusPro-I controller during this portion of the tutorial. -
Page 89: Figure 79. Analyzer Supplied Mode Prompt
When the I2C Exerciser is first used to interact with the bus in Live Mode (as you will do in the next step), it checks the electrical characteristics of the target bus to determine if there may be a possible conflict with the electrical settings of the current project. -
Page 90: Figure 80. Debugger Window
Step 2 – Send and Receive with Debugger Click on the Debugger icon in the shortcut bar on the far left side of the main window to open the Debugger window. Alternatively, you could select the Debugger entry from the Tools menu. The Debugger window will appear as shown in Figure 80 below. -
Page 91: Figure 81. Byte Sent From The Debugger
Debugger preferences (Tools | Preferences | Debugger Options). If turned off, the sent data would not be shown in the receive section text box. In Analyzer Supplied mode, the BusPro-I controller supplies the pull-up voltage for the I C bus. If you were still in Target Supplied mode, since there is no target connected there would be no pull-up supply to the bus making the lines undefined when high. -
Page 92: Figure 82. Receive Three Bytes In The Debugger
Click on the Receive button now. The value FF will appear in the Receive area text box. Without a target attached to communicate with, this is the only value that should ever be received since the bus is floating high. Enter the number 3 in the Bytes field and then click on the Receive button again to tell the debugger to read three bytes. -
Page 93: Figure 83. Capture Of Debugger Send
Step 3 – Send While Monitoring In order to see the bus traffic that is being generated by the Debugger, you need to start the Monitor to collect data. Go to the Monitor window by clicking on its entry in the Shortcut Bar. Click on the Run Single button in the I2C Exerciser tool bar (indicated by the icon). -
Page 94: Figure 84. Tutorial Script Loaded Into Debugger
It is located in the “Demo” subfolder of the I2C Exerciser examples folder. For a default installation, this would be “C:\Corelis Examples\I2C Exerciser\Demo”. Find this subfolder and select the file named “tutorial.dcf” and then click on the Open button. -
Page 95: Figure 85. Capture Of Debugger Script
Click on the Send button to execute the script and the bytes sent will be echoed to the Receive area text box. Then return to the Monitor window to view the captured data. You will see in the trace list that the bytes were sent to various bus addresses as specified by the script. -
Page 96: Figure 86. Set Discrete I/O Modes
Step 4 – Manipulate Discrete I/O Signals Suppose that you want to use the I/O 1 and I/O 2 general purpose lines to stimulate a target device. To drive these signals, you must first set the discrete I/O modes to output. Open the Configuration Manager by clicking on its entry in the I2C Exerciser’s Tools menu and then click on the Settings tab. -
Page 97: Figure 87. Debugger Discrete I/O Script
Set the script to execute twice by entering a 2 in the Run field. Then click on the Send button to execute the script. The contents of the Debugger window should appear as shown in Figure 87 below. Click on the Monitor entry in the Shortcut Bar to return to the Monitor window. -
Page 98: Figure 89. Debugger Close
Step 5 – Close the Debugger Click on the Stop button in the I2C Exerciser tool bar (indicated by the icon) to stop the Monitor from collecting data. Return to the Run Status tab on the Monitor Tools window that was opened when data capturing started—you may have to restore it from minimized state if you had minimized it earlier. -
Page 99: Figure 90. Smbus Raw Data
“Demo” subfolder of the I2C Exerciser examples folder. For a default installation, this would be “C:\Corelis Examples\I2C Exerciser\Demo”. From the Monitor window, click on the File menu and then click on Open Trace Data… Note that there is also a tool bar button for this. Browse to the “Demo” folder mentioned above and select the file “tc74.tdf.”... -
Page 100: Figure 91. Smbus Pane Before Associating Decoder File
The raw data shown was collected while communicating with a simple temperature sensor (Microchip TC74 Tiny Serial Thermal Sensor). In order to understand the messages, you need to use an SMBus decoder file containing protocol information for this device. Click on the Tools menu and then click on Configuration Manager… Then click on the SMBus tab to display the SMBus configuration pane shown in Figure 91 below Figure 91. -
Page 101: Figure 92. Smbus Decoder File Dialog With Tc74 Information
“Decoder” subfolder of the I2C Exerciser examples folder. For a default installation, this would be “C:\Corelis Examples\I2C Exerciser\Decoder”. Browse to this folder and select the file named “tc74.smb.” Then click on the Select button and the File field of the SMBus Decoder File dialog window will be filled in. -
Page 102: Figure 93. Switch To Smbus Mode
Now back in the Monitor window, right-click in the Data Byte column heading and click on the SMBus Mode menu item as shown in Figure 93 below. SMBus messages in the Data Byte column will now be decoded for you as well as the device name in the Addr column as shown below in Figure 94. Figure 93. -
Page 103: Figure 95. Decoded Smbus Message Tooltip
placing your mouse pointer over the line 18 Data Byte column entry for several seconds as shown in Figure 95 below. Figure 95. Decoded SMBus Message ToolTip You can also open up a window containing the full decoded SMBus message by clicking on the Data Byte column entry. - Page 104 This completes the I2C Exerciser tutorial. Please refer to chapters 5 and on for more detailed information on the I2C Exerciser graphical user interface. Getting Started...
-
Page 105: Chapter 4 Connecting To A Target
Two types of test cables are available to plug into the Serial Bus connector according to your target needs as listed in Table 1. One, included in the standard BusPro-I package, terminates in sleeved flying leads with detachable mini clips for arbitrary target test point hookup. The pin assignments of this cable are presented in Table 2. -
Page 106: Figure 97. Rj45 Connector Pin Numbering
Figure 97. RJ45 Connector Pin Numbering The 4-pin crimp cable connects to targets that have a 4-pin I C header compatible with the Philips demo board. The cable is designed to mate with Molex part number 22-23-2041 or equivalent. Table 3 shows the pin assignments of this cable. -
Page 107: Interface Setup
What signal clock rate is supported by the target When the BusPro-I analyzer is first used to interact with the target bus, it checks for a target supplied pull- up. If a target supplied pull-up is detected but the analyzer expects to provide the pull-up source, then a prompt will be displayed so that the analyzer may be set to not provide the pull-up source in order to avoid contention with the target. -
Page 108: Figure 98. Configuration Manager
Scenarios The following scenarios are presented to help you configure the BusPro-I analyzer to get it up and running in the shortest amount of time. Most setup options are found in the Settings pane of the Configuration Manager, as shown in Figure 98. The Configuration Manager can be opened from the I2C Exerciser’s menu bar by selecting Tools | Configuration Manager…... -
Page 109: Figure 99. Analyzer Supplied Voltage Prompt
Case 2: The target does not supply any pull-up voltage In the case where the target does not supply pull-up voltage, the BusPro-I must supply the pull-ups for the target. When the I2C Exerciser is first used to interact with the bus, it will automatically attempt to detect a target reference voltage. -
Page 110: Figure 100. Configuration Manager Analyzer Supplied
Case 1 above. Note that the Pull-up Resistance setting is enabled only when the Analyzer Supplied voltage source is selected, as seen in Figure 100. When the BusPro-I is to supply pull-ups, examine the following settings: 1. Make sure that the Analyzer Supplied radio button is selected. - Page 111 When you first try to interact with the bus, a reference voltage will not be detected and you will be prompted to change to Analyzer Supplied. Select Yes and follow the steps in Case 2 of Scenario 1 described above. With no target attached, the BusPro-I will effectively talk to itself. Case 2: Program already set up If the program is already set up, such as from a loaded project or from prior usage, you should not need to do anything.
-
Page 112: Figure 101. Configuration Manager Settings Pane
Setting Details All of the BusPro-I settings that are of principal concern when connecting to a target can be found in the Settings pane of the Configuration Manager, shown in Figure 101. This can be opened by pressing <F8> or selecting Tools | Configuration Manager from the menu bar, and then selecting the Settings tab. -
Page 113: Figure 102. Bus Electrical Features
When this setting is selected, the Pull-up Resistance setting is disabled. Analyzer Supplied – Specifies that the BusPro-I will supply pull-up voltage to the target bus. In this case, the target has no other attached pull-up voltage source and the analyzer must supply this to activate the bus. -
Page 114: Figure 103. Bus Drive And Monitoring Features
RC time-constant, creating a rapid edge. This can then allow an increase in the clock rate for a given RC value of the bus. If this option is set to AUTO, the BusPro-I will... -
Page 115: Figure 104. Input/Output Signals
104, allow configuration of these discrete I/O lines. Figure 104. Input/Output Signals High Level – Specifies the TTL high voltage level of the I/O signals. When sensing inputs, the BusPro-I will also use this setting to automatically determine corresponding signal threshold values. -
Page 116: Figure 105. Monitor Buffer Options
Monitor Buffer Options Monitor Buffer Depth – The Monitor Buffer Depth setting, shown in Figure 105, allows the user to select the buffer depth specified by the number of transactions. This value indicates the number of transactions that occur before the monitor trace is considered to be full. Figure 105. -
Page 117: Chapter 5 Bus Traffic Monitor
The Monitor window is the primary information display of the I2C Exerciser. Data that is passively collected from the target I C bus by the BusPro-I analyzer is presented in both a trace listing and a graphical timing representation. Using the Monitor window, samples of bus traffic are easily acquired and traversed for review. -
Page 118: Trace Listing
Trace Listing The trace listing, located in the top portion of the Monitor window, provides the fundamental presentation of traffic acquired from the target I C bus. Each row is considered to represent a transaction which describes a complete read/write address or data byte sequence that is conveyed over the bus. All of the transaction details are included as columns in the listing. - Page 119 Data Byte column. Location – This column indicates whether the BusPro-I analyzer is involved in the transaction. For address cycle transactions, “Analyzer” signifies that the analyzer is acting as a master (through the Debugger or Emulator, for example), while “Target”...
- Page 120 I/O 1 – This column indicates the state of discrete I/O line 1 during the transaction. I/O 2 – This column indicates the state of discrete I/O line 2 during the transaction. Data Byte – This column indicates the data byte values conveyed to or from the target slave device by the transaction.
-
Page 121: Timing Field
Timing Field The timing field located in the bottom portion of the Monitor window provides a graphical image of bus signal edge transitions over time. This information is similar to that acquired by logic analyzers, showing the state progression of clock (SCL) and data (SDA) signals. Figure 108 shows the Monitor timing field with its major components labeled. - Page 122 W/R – Designates the transfer direction indicator bit. During an address cycle, either a “W” is shown meaning that a master is writing data to a target slave device or an “R” is shown meaning that a master is reading data from a target slave device. Scale controls –...
-
Page 123: Figure 109. Timing Field Popup Menu
Timing Field Popup Menu The Timing Field Popup Menu is accessed by right-clicking in the waveform area of the timing field window as shown in Figure 109. It provides various functions to help users to navigate and examine the waveform display. Figure 109. -
Page 124: Monitor Configurations
Monitor Configurations Various configuration options relevant to the Monitor Window can be specified by opening the Configuration Manager from the Tools menu. The Configuration Manager can be used to configure the Filters, Symbols, and SMBus features which are applicable to use of the Monitor Window. Filters A filter defines a class of transactions by specifying a set of particular transaction features. -
Page 125: Figure 110. Filters Pane
Figure 110. Filters Pane Filters can either define transactions that will be included in the trace listing or excluded from the trace listing. The radio buttons at the top of the dialog determine this selection or turn off filtering completely. The Include and Exclude selections each have their own separate set of filters which are displayed in the dialog’s list box. -
Page 126: Figure 111. Filter Definition Dialog (Similar To Edit)
Figure 111. Filter Definition Dialog (similar to Edit) Bus Traffic Monitor... -
Page 127: Figure 112. Symbols Pane
Symbols This dialog, shown in Figure 112, displays a list that can contain symbolic text strings along with associated parameters that specify the criteria which determine where the symbolic text will replace a numeric value in the trace listing and other related dialogs. This can be used to enhance the user readability of transactions. -
Page 128: Figure 113. Symbol Definition Dialog
Using the Add button beneath the list box, a new symbol can be defined and appended to the list. The Edit button allows alteration of an existing selected symbol definition. The Remove and Remove All buttons enable the deletion of a selected symbol definition or the entire list of symbol definitions. The Symbol Definition dialog that is displayed when using the Add or Edit buttons is shown in Figure 113. -
Page 129: Figure 114. Smbus Pane
SMBus This dialog, shown in Figure 114, shows a list of associations between bus addresses and SMBus devices. Device entries shaded gray are reserved by the SMBus Specification (v. 2.0). Those devices cannot be removed, but their associated addresses can be re-associated with a different device if necessary. -
Page 130: Figure 115. Smbus Decoder File Dialog
Monitor trace listing any time that the clock signal (SCL) is detected to be low for 25 milliseconds or longer during capturing of bus traffic. If a timeout occurs while the BusPro-I is driving the bus, it will abandon all transactions and generate a STOP condition to return the bus to the idle state. -
Page 131: Monitor Preferences
Monitor Preferences Preferences relevant to the Monitor Window can be selected by opening the Preferences dialog from the Tools menu. The Preferences dialog can be used to specify the monitor colors and other monitor options, as well as address format. Monitor Colors This pane enables altering of the colors of the trigger and cursor backgrounds and text in the trace listing. - Page 132 Trigger – Changes the text and background color of the Trigger trace listing Cursor A – Changes the text and background color of the cursor marked “A” in the Timing Field Cursor B – Changes the text and background color of the cursor marked “B” in the Timing Field Timing View –...
-
Page 133: Figure 117. Monitor Options Pane
Monitor Options This pane enables the altering of preferences for the layout and style of data in the Monitor window. Figure 117. Monitor Options Pane Line Column – Sets the numbering of entries in the trace list to start from one at the first entry (default) or start from zero at the trigger, with earlier transactions being negative. -
Page 134: Figure 118. Formats Pane
Other Options – The first preference sets whether or not a prompt to save data pops up whenever the trace list will be cleared. The second preference allows the Timing display to be locked to the trace screen (on the first line), rather than aligning with the selected line. START Hold Time Checking –... -
Page 135: Monitor Trigger
Monitor Trigger A trigger defines a set of criteria to be compared against the transactions captured by the Monitor. When a match occurs, a trigger transaction marker will appear on the Monitor’s trace listing and the capturing process stops when the triggering transaction reaches a user-specified position in the buffer. In addition, a trigger out signal can be generated through one of the I/O lines when the match occurs so that external third-party tools can be triggered for further data capturing and analysis. -
Page 136: Table 4. Summary Of Available Trigger Components
There are two special states in the Trigger definition tree. START is the default state in which the state machine begins when I2C data collection begins. TRIGGER is the ending state, which causes the triggering actions to occur. Between the START and TRIGGER states, there are one or more intermediate states, which have conditional branches to check for matching events and perform actions accordingly. - Page 137 event condition at the current state of the Trigger state machine. Then actions specified in the matching IF/ELSE/THEN branch are executed. The following items are available criteria of an event and their possible values. If any of these conditions are not specified, they are considered as “don’t-care”. For example, if the TxType (transaction type) is not specified and an Address value of “A2”...
- Page 138 Pulse IO – Generates a pulse signal to one of the I/O lines. The pulse can be either “ActiveHigh”, which generates a high and then low signal, or “ActiveLow”, which generates a low and then high signal. The width of the pulse is about 0.5 ms, and the typical delay between the actual trigger event on the bus and the trigger out pulse is approximately 1.6 ms.
-
Page 139: Figure 120. Trigger On Single Event
Examples The following sections present some examples to describe how the components described in the previous sections can be integrated together to design various triggering sequences. Scenario 1) Trigger on Single Event Goal: Trigger when Event A occurs Figure 120. Trigger on Single Event START: [Action] Go to State 1;... -
Page 140: Figure 121. Trigger On Repeated Single Event
Scenario 2) Trigger on Repeated Single Event Goal: Trigger when Event A occurs 3 times in total Figure 121. Trigger on Repeated Single Event START: [Action] Set counter C1 = 3; [Action] Go to State 1; State 1: If C1 > 1 and Event A happens [Action] Decrement C1 by 1 and Stay at State 1 Else If C1 = 1 and Event A happens [Action] Go to TRIGGER;... -
Page 141: Figure 122. Trigger On Sequence Of Multiple Events
Scenario 3) Trigger on Sequence of Multiple Events (Not Necessarily Consecutive) Goal: Trigger when Event A occurs and then Event B occurs eventually Figure 122. Trigger on Sequence of Multiple Events START: [Action] Go to State 1; State 1: If Event A happens [Action] Go to State 2;... -
Page 142: Figure 123. Trigger On Consecutive Sequence Of Events
Scenario 4) Trigger on Consecutive Sequence of Events Goal: Trigger when Events A and B occurs consecutively Figure 123. Trigger on Consecutive Sequence of Events START: [Action] Go to State 1; State 1: If Event A happens [Action] Go to State 2; Else [Action] Do nothing;... -
Page 143: Figure 124. Trigger Dialog
Trigger Dialog The following is list of GUI components in Trigger dialog and their descriptions. Mode selection – Enable or disables the Trigger operation. The Trigger definition can be edited only when it is disabled. New… button – Launches the “Create New Trigger” dialog, which provides a list of Trigger templates that can be used as the basis for creating a new Trigger. -
Page 144: Figure 125. Context Popup Menu On Trigger Definition Tree
Designing a Trigger The Trigger feature is in design mode when the Disable Trigger (Design Mode) option is selected on the Trigger dialog. In this mode, if a node in the Trigger definition tree is right-clicked, a context popup menu will appear as shown in Figure 125. -
Page 145: Figure 126. Create New Trigger Dialog
In order to provide an easy starting point for designing a new trigger definition, the Create New Trigger dialog is provided. When the New button is clicked at the Trigger dialog, the dialog will appear as shown in Figure 126. This dialog lets you browse and select from sample templates, which can be used as the basis for creating a new trigger definition. - Page 146 Activating Trigger The Trigger feature is activated when the Enable Trigger option is selected at the Trigger dialog, and the Monitor is running. When I2C Exerciser is collecting bus data in Run Single mode and the Trigger is disabled, the capturing process will stop automatically once the buffer becomes full.
-
Page 147: Figure 127. Active Trigger Operation Status
Figure 127. Active Trigger Operation Status Bus Traffic Monitor... -
Page 148: Monitor Window Reference
Monitor Window Reference The Monitor window, shown in Figure 128, can be opened using the either the Monitor entry in the Shortcut Bar or in the Tools menu. By default, the Monitor window is opened when the I2C Exerciser starts. Table 5 describes the numbered areas of the I2C Exerciser Monitor window. Figure 128. -
Page 149: Figure 129. Monitor File Menu
Monitor Menu Bar When the Monitor window is active, the Menu Bar provides accesses to relevant functions including File, Trace, Tools, Windows and Help. A description of each menu follows. Monitor File Menu The File menu shown in Figure 129 includes commands to load and save projects and trace data. The entries on this menu are described below. -
Page 150: Figure 130. Monitor Trace Menu
Monitor Trace Menu The Trace menu as shown in Figure 130 is used to access various trace buffer functions including run/stop control, buffer navigation, data layout and display formats, filter and trigger management setup, and clearing of trace data or line tags. These menu entries are described below. Figure 130. -
Page 151: Figure 131. Trace | Execute Submenu
Trigger… – Provides access to the Trigger dialog allowing the user to view or edit the trigger condition. The trigger defines conditions to mark a special transaction event in the trace buffer. The Trigger function is described earlier in this chapter. Symbols…... -
Page 152: Figure 132. Run Status Tab On Monitor Tools Window
Run Status Tab When the Monitor window is started via the Run or Run Repetitive command, the Run Status tab will appear to provide status about events and progress. If a Trigger is active, it will notify you when the trigger condition has been met. -
Page 153: Figure 133. Trace | Go To Submenu
Trace | Go To Submenu The Trace | Go To submenu shown in Figure 133 provides navigation control for the Monitor window trace buffer. Figure 133. Trace | Go To Submenu Trigger – Causes the quick positioning of visible trace lines to bring the Trigger into view at the top of the screen. -
Page 154: Figure 134. Trace | View Submenu
Trace | View Submenu The Trace | View submenu shown in Figure 134 provides data view mode control for the Monitor window Data Byte column. Figure 134. Trace | View Submenu Normal Mode – Causes the Data Byte column display to switch to the default Normal mode. When using Normal mode, the Data Byte column simply indicates the raw data byte values conveyed to or from a target slave device during a transaction, one byte per trace listing line. -
Page 155: Figure 135. Monitor Find Dialog - Regular
Find Function You can use the Find function to search for entries in the trace buffer matching user specified criteria. Figure 135 and Figure 136 show the regular and compact version of the Find dialog box. The regular (full- size) dialog allows the user to configure the various transaction search conditions, including don’t-care entries. - Page 156 Each of the Find window search criteria fields is described below. Type – Indicates that either an address or data transaction is being searched for. Select Any to specify “don’t-care.” Addr (Hex) – Specifies the address of interest. Select Any to specify “don’t-care”. If a 7-bit address is being entered, the hex address value should be entered properly according to the current “FE mode”...
-
Page 157: Figure 137. Trace Layout Dialog
Trace Layout The Trace Layout dialog shown in Figure 137 controls which columns will be displayed in the trace listing. The dialog also allows you to restore the factory defaults for column widths, visibility, and order. Figure 137. Trace Layout Dialog Bus Traffic Monitor... -
Page 158: Figure 138. Tools Menu
I2C Exerciser application is in the demo mode. Self-Test – Launches a test sequence to validate the basic proper operation of the BusPro-I hardware. Calibration – Launches an automated tool that calibrates the BusPro-I electrical outputs in order to improve analyzer supplied voltage source settings. -
Page 159: Figure 139. Monitor Window Menu
Help Topics – Invokes the I2C Exerciser online help system and displays a list of available help topics. Technical Support / Corelis Forum / Corelis on the Web – Opens support, forum, and Corelis Web page using the default Web browser. -
Page 160: Figure 141. Monitor Tool Bar
Monitor Tool Bar The Monitor Tool Bar shown in Figure 141 provides quick single-click access to commonly used commands in the Monitor window. Simply click on the tool bar button to perform the desired command. Table 6 describes the tool bar functions. Positioning the mouse cursor over each tool bar button will also display a pop-up “tooltip”... -
Page 161: Table 6. Monitor Tool Bar Functions
Icon Name Function Description Clear Trace Data Deletes all of the trace buffer contents and clears the trace list and timing display. If the current data has not yet been saved, you will be prompted to save it. This prompt can be disabled from the Tools | Preferences | Monitor Options screen. - Page 162 Bus Traffic Monitor...
-
Page 163: Chapter 6 Interactive Debugger
The Debugger window provides a direct read/write interactive interface with the target I C bus. Unlike the Monitor window where the BusPro-I is passively monitoring the bus, the Debugger can be used to perform simple message transfers both to and from slave devices. During this process, the BusPro-I analyzer essentially acts as a master on the bus. -
Page 164: Send Data
Send Data The left side of the Debugger window contains controls for generating messages that write data to slave devices on the target I C bus. These controls are shown in Figure 143. Figure 143. Debugger Send Controls Addr – This field specifies the I C bus address of the target slave that is being written to. - Page 165 No Stop – This check box specifies whether a STOP condition is generated at the end of a message. When unchecked (default), the STOP condition is included after all of a message’s data bytes have been written. Checking this box causes the STOP condition to be omitted. Under the I C bus protocol, absence of the STOP condition means that a master is not yet done transmitting.
-
Page 166: Receive Data
Receive Data The right side of the Debugger window contains controls for generating messages that read data from slave devices on the target I C bus. These controls are shown in Figure 144. Figure 144. Debugger Receive Controls Addr – This field specifies the I C bus address of the target slave that is being read from. - Page 167 read. Checking this box causes the STOP condition to be omitted. Under the I C bus protocol, absence of the STOP condition means that a master is not yet done transmitting. The previous data transfer can then be followed by a repeated START condition and another data transfer. This can be used to support some slave devices which require that the first data transfer specify the value of an offset register (or a command) and then the following data is read from (or written to) the device at that offset location.
-
Page 168: Debugger Script
This text field also supports the use of special commands that can override the settings of the other Send controls as well as insert pauses in the message transmission sequence, manipulate the BusPro-I analyzer’s two discrete I/O lines, or activate Error Injection. -
Page 169: Table 7. Debugger Script Keywords
Keyword Example Description ADDRESS ADDRESS 3A Indicates that the send address should change to the 7-bit address specified by the following hex value parameter. This command modifies the value of the Send-side Addr combo box. Note that 7-bit I C addresses are represented as 8-bit hexadecimal values and their format is dependant on the current address mode setting (FE mode or 7F mode). - Page 170 Example Debugger Script Command Text File Below is an example debugger script that might be used to load an EEPROM with some values in part of its first page of memory and wiggle one of the discrete I/O signals while processing. // ADDRESS_MODE: FE // fill 24AA16 eeprom // page 0...
-
Page 171: Debugger Options
Figure 145. Debugger Options Pane Track Transactions – If selected, data sent by the BusPro-I is tracked by the Monitor and the transaction times out if matching data does not appear on the bus within 2 seconds. Tracking the sent byte will ensure the sent bytes are generated on the bus correctly. - Page 172 Echo Sent Data – If selected, data sent by the BusPro-I is echoed in the Receive-side text box along with all other incoming traffic during the send operation. This option is available only when the Track Transaction option is enabled.
-
Page 173: Debugger Window Reference
Debugger Window Reference The Debugger window, shown in Figure 146, can be opened using the either the Debugger entry in the Shortcut Bar or in the Tools menu. Table 8 describes the numbered areas of the I2C Exerciser Debugger window. Figure 146. -
Page 174: Figure 147. Debugger File Menu
Debugger Menu Bar When the Debugger window is active, the Menu Bar contains entries relevant to the Debugger functions including File, Tools, Windows and Help. A description of each menu follows. Debugger File Menu The File menu shown in Figure 147 includes options to load and save projects and debugger command files as well as an option to save debugger data from the Debugger window’s Receive section. -
Page 175: Figure 148. Debugger Tool Bar
Debugger Window Menu The Window menu manages the various windows of I2C Exerciser and is identical to the Monitor Window Menu described in the Bus Traffic Monitor chapter. Debugger Help Menu The Help menu accesses the on-line help features and is identical to the Monitor Help Menu described in the Bus Traffic Monitor chapter. - Page 176 Interactive Debugger...
-
Page 177: Chapter 7 Serial Eeprom Programmer
Chapter 7 Serial EEPROM Programmer Programmer Window Overview and component descriptions The Programmer Window provides an interface specifically tailored for convenient interaction with standard I C EEPROM devices on the target I C bus. It enables file-linked programming and viewing of the content of such devices. -
Page 178: Programmer Operations
Programmer Operations The Programmer window shown in Figure 149 can be accessed from the Tools | Programmer entry in the menu bar or from the Programmer icon in the shortcut bar. It allows the user to program most common I C EEPROM devices using a common data file format such as a Motorola S Record file, Intel Hex file, or a text file containing a list of hex values. -
Page 179: Table 10. Programmer Function Descriptions
Component Description Manufacturer combo box Specifies the manufacturer of the I C EEPROM device to be programmed. Most devices can be programmed as a “Generic” manufacturer device if they are compatible with the ATMEL 24xxXXX series of I C EEPROM devices. Type combo box Specifies the type of the EEPROM device to program. -
Page 180: Figure 150. Programmer Read Window
Read Button The Read button opens the Read Contents window shown in Figure 150. This allows the user to examine the memory content of the I2C EEPROM device without dumping the entire data to a file. The components of the Read Contents window are described Table 11. -
Page 181: Figure 151. Programming Progress Window
Program Button The Program button allows the user to program and verify the I2C EEPROM device. With a single click on the button, the I2C Exerciser will program the device using the specified data file. If the Preferences is set to verify after programming (see the Programmer Options section of this chapter), the I2C Exerciser will automatically verify that the data is written to the device by performing a read. -
Page 182: Programmer Options
Programmer Options The user can change Programmer options by accessing the Programmer Options pane of the Preferences dialog. To open the Preferences dialog, press F7 or select Preferences… from the Tools menu. Once the Preferences dialog appears, select the Programmer Options pane as shown in Figure 154. -
Page 183: Programmer Window Reference
Programmer Window Reference The Programmer window, shown in Figure 155, can be opened using the either the Programmer entry in the Shortcut Bar or in the Tools menu. Table 12 describes the numbered areas of the I2C Exerciser Programmer window. Figure 155. -
Page 184: Figure 156. Programmer File Menu
Programmer Menu Bar When the Programmer window is active, the Menu Bar contains entries relevant to the Programmer functions including File, Tools, Windows and Help. A description of each menu follows. Programmer File Menu The File menu shown in Figure 156 includes commands to load and save projects and programmer configuration files as well as a command to save a dump of the data from a device. -
Page 185: Figure 157. Programmer Tool Bar
Programmer Tools Menu The Tools menu provides a path to the major application function windows. This is identical to the Monitor Tools Menu selections in the Bus Traffic Monitor chapter. Programmer Window Menu The Window menu manages the various windows of I2C Exerciser and is identical to the Monitor Window Menu in the Bus Traffic Monitor chapter. - Page 186 Serial EEPROM Programmer...
-
Page 187: Chapter 8 Configuration And Preferences
Chapter 8 Configuration and Preferences Configuration Manager and Preferences dialogs overview and component descriptions Configuration Manager The Configuration Manager allows the user to change the setting for the various tools provided by the I2C Exerciser in one easily accessible location. The user can access certain Configurations Manager tabs directly from some of the tools such as the Filters and Trigger toolbar in the Monitor window. -
Page 188: Figure 158. Configuration Manager Dialog Panes (Settings Selected)
The Configuration Manager dialog, shown in Figure 158, enables selection of various settings controlling the behavior of the BusPro-I and I2C Exerciser. The user can access the Configuration Manager using the Tools menu. The major features are grouped under separate panes of this dialog. These panes are listed in Table 14 and described on the following pages. -
Page 189: Table 14. Configuration Manager Panes
Function Description Filters Establishes the criteria for one or more filters that determine what transactions will be included or excluded from the trace listing. Symbols Establishes the criteria for transactions that will have their particular address or data byte value replaced by a specified text string symbol. SMBus Establishes the associations between bus addresses and SMBus devices using files containing SMBus decoding information. -
Page 190: Figure 159. Filters Pane
Figure 159. Filters Pane Filters can either define transactions that will be included in the trace listing or excluded from the trace listing. The radio buttons at the top of the dialog determine this selection or turn off filtering completely. The Include and Exclude selections each have their own separate set of filters which are displayed in the dialog’s list box. -
Page 191: Figure 160. Filter Definition Dialog (Similar To Edit)
Figure 160. Filter Definition Dialog (similar to Edit) Configuration and Preferences... -
Page 192: Figure 161. Symbols Pane
Symbols Pane This dialog, shown in Figure 161, displays a list that can contain symbolic text strings along with associated parameters that specify the criteria which determine where the symbolic text will replace a numeric value in the trace listing and other related dialogs. This can be used to enhance the user readability of transactions. -
Page 193: Figure 162. Symbol Definition Dialog
Using the Add button beneath the list box, a new symbol can be defined and appended to the list. The Edit button allows alteration of an existing selected symbol definition. The Remove and Remove All buttons enable the deletion of a selected symbol definition or the entire list of symbol definitions. The Symbol Definition dialog that is displayed when using the Add or Edit buttons is shown in Figure 162. -
Page 194: Figure 163. Smbus Pane
Figure 163. SMBus Pane Configuration and Preferences... -
Page 195: Figure 164. Smbus Decoder File Dialog
Monitor trace listing any time that the clock signal (SCL) is detected to be low for 25 milliseconds or longer during capturing of bus traffic. If a timeout occurs while the BusPro-I is driving the bus, it will abandon all transactions and generate a STOP condition to return the bus to the idle state. -
Page 196: Figure 165. Settings Pane
Settings Pane This dialog, shown in Figure 165, allows setting of the various electrical and bus features of the analyzer. There are some settings that depend on others and may be grayed out accordingly. All of the controls present in the Settings pane are detailed below. Figure 165. - Page 197 Auto Detect – This button causes the I2C Exerciser to check for a voltage on the target bus and automatically select recommended default electrical settings based on its findings. Drive Clock Rate – Specifies the nominal clock rate of the SCL signal when the BusPro-I drives the bus. Note that the I C bus is not of a continuously clocking type since various conditions can stretch the clock or require resynchronization between multiple sources.
- Page 198 RC time-constant, creating a rapid edge. This can then allow an increase in the clock rate for a given RC value of the bus. If this option is set to AUTO, the BusPro-I will...
- Page 199 transactions of data, and the Run Status tab on the Monitor Tools window lists the name of the trace data file currently being logged to. After finishing capturing, you may double-click on the listed filenames to load the trace data to the Monitor Window. Driving Bus Clock Rate Considerations When adjusting the SCL clock rate at which the analyzer operates the bus as a master (during Debugger functions), the user must be aware of limitations imposed by the target bus itself.
-
Page 200: Figure 166. Files Pane
Figure 166. Files Pane Configuration and Preferences... -
Page 201: Preferences Dialog
Preferences Dialog The Preferences Dialog allows the user to change the preferences for the various tools provided by the I2C Exerciser in one easily accessible location. The user can access the last used Preferences tab by using the Tools | Preferences menu command accessible from all windows. The user can use the Preferences dialog to set the preferences for the monitor colors, monitor options, debugger options, programmer options, and formats. -
Page 202: Figure 168. Monitor Options Pane
Monitor Options This pane enables the altering of preferences for the layout and style of data in the Monitor window. Figure 168. Monitor Options Pane Line Column – sets the numbering of entries in the trace list to start from one at the first entry (default) or start from zero at the trigger, with earlier transactions being negative. -
Page 203: Figure 169. Debugger Options Pane
Other Options – The first preference sets whether or not a prompt to save data pops up whenever the trace list will be cleared. The second preference allows the Timing display to be locked to the trace screen (on the first line), rather than aligning with the selected line. START Hold Time Checking –... -
Page 204: Figure 170. Programmer Options Pane
Programmer Options This pane enables setting of whether or not the Programmer performs a verification of written data after programming a device. Figure 170. Programmer Options Pane Configuration and Preferences... -
Page 205: Figure 171. Formats Pane
Formats This pane enables selection of how a 7 binary bit address representation is formatted for hexadecimal display (does not apply to 10-bit addresses or to non-hex representations such as symbolic). The FE format (default) shows the hexadecimal byte value with the 7 address bits left-justified in the byte. The 7F format shows the 7 address bits right-justified in the byte. -
Page 206: Using Project Files
Using Project Files When the I2C Exerciser saves and loads project files, it saves and loads all of your customized settings and preferences with these files. It is recommended that you become familiar with this feature and make use of it as much as possible. This functionality allows you to save an environment that you have set up for a particular target bus, debugging session, or test routine, and then load up that environment whenever needed. -
Page 207: Figure 173. Title Bar For A Saved Project
Once you have saved a project to a file, the title bar will display the current project file name as shown in Figure 173. Figure 173. Title Bar for a Saved Project The project settings are saved in a file with “.i2c” extension. Along with this main *.i2c file, several secondary files are created and associated with the project whenever you create a new project. -
Page 208: Calibration
USB busses. Each installation of the I2C Exerciser maintains a separate collection of calibration data for every BusPro-I that it operates. Whenever the application detects a BusPro-I that it has not yet calibrated, it will display a prompt as shown in Figure 175. -
Page 209: Figure 177. Calibration Status
Calibration Status window as shown in Figure 177. When all steps have completed successfully, the status window may be closed by clicking on the Done button as shown in Figure 178 and the calibrated BusPro-I is ready for use. Figure 177. Calibration Status Figure 178. - Page 210 Configuration and Preferences...
-
Page 211: Chapter 9 Third Party Application Interface
Description of using the BusPro-I with third party software Overview The BusPro-I provides the ability to operate some of its features by using function calls from third party software. In this manner, such applications can access the connected I C bus of the target, including observing its traffic, interacting with it, and performing bus measurements. -
Page 212: Dynamic Link Library (Dll)
LabVIEW, Python, Microsoft Visual C++, and Visual Basic are provided in the I2C_DLL example folder, which is located at “C:\Corelis Examples\I2C Exerciser\I2C_DLL”. Note that the I2C_DLL.dll is a 32-bit version and can be used with 32-bit versions of programs only, and I2C_DLL_64.dll is a 64-bit version and can be used with 64-bit versions of programs only... -
Page 213: General Calling Sequence
The first and last function calls are mandatory. The first function call will enable most of the other operations. The last function call ensures a clean disconnection of the BusPro-I so that it can be restarted trouble-free. If this is not done, it may be necessary to cycle-plug the analyzer in the USB port. -
Page 214: Function Reference
I2C_GetLastTransferStatus Reports supplemental status of the most recent call to I2C_Receive_Data or I2C_Send_Data. I2C_InitHardware Confirms BusPro-I status and establishes default initial conditions. I2C_LoadSetup Reloads all previously stored setup parameters from a project file. I2C_PulseDiscrete Pulses one of the discrete I/O signals low for a given period of time. -
Page 215: Table 16. I2C Dll Functions
Sets application-defined callback function for processing transaction data captured by the analyzer. I2C_SetRisingEdgeDriveMode Overwrites configuration rising edge drive setting with provided selection. I2C_ShutdownHardware Forces an orderly shutdown of the BusPro-I analyzer and its USB disconnection. Table 16. I2C DLL Functions Third Party Application Interface... - Page 216 I2C_ConfigureDiscretes Overwrites several configuration parameters related to driving the two discrete I/O lines. This includes setting each line’s direction, drive type (TTL or open-drain), SMB connector linkage and voltage level. Prototype: extern “C” __declspec(dllexport) int _cdecl I2C_ConfigureDiscretes ( int nDiscrete1Function, BOOL bDiscrete1DrivesSMB_AT1, int nDiscrete2Function, BOOL nDiscrete2InputFromSMB_AT2,...
- Page 217 I2C_DisableCollisionDetection Enables an analyzer mode which ignores bus collision conditions when it is driving the bus. This may be useful for busses with overly slow rise-times. In such cases, the analyzer will not see its own high SDA drive level soon enough before deciding that another master is driving the bus and colliding with it.
- Page 218 I2C_DisableTxTracking Turns off the transmission tracking feature. Removes delays between transactions. Prototype: extern “C” __declspec(dllexport) void _cdecl I2C_DisableTxTracking ( void ); Return Value: None. Parameters: None. Third Party Application Interface...
- Page 219 I2C_EnableTxTracking Turns on the transmission tracking feature. Adds delays between transactions. Prototype: extern “C” __declspec(dllexport) void _cdecl I2C_EnableTxTracking ( void ); Return Value: None. Parameters: None. Third Party Application Interface...
- Page 220 I2C_GetLastStatus Reports supplemental status of the most recent call to an API function. Prototype: extern “C” __declspec(dllexport) char * _cdecl I2C_GetLastStatus ( void ); Return Value: The status string indicating the result of the most recent call to an API function, including any error messages.
- Page 221 I2C_GetLastTransferStatus Reports supplemental status of the most recent call to I2C_Receive_Data or I2C_Send_Data. The event of an address cycle NAK is provided. Prototype: extern “C” __declspec(dllexport) char * _cdecl I2C_GetLastTransferStatus ( void ); Return Value: NULL if there is no transfer status information, otherwise the string "ADDRESSNAK". Parameters: None.
- Page 222 I2C_InitHardware Confirms that the BusPro-I is present and properly linked via its USB port. It initializes the hardware with logic and downloads the firmware, with all settings at factory default states. Prototype: extern “C” __declspec(dllexport) char * _cdecl I2C_InitHardware ( void );...
- Page 223 I2C_LoadSetup Overwrites all settings from the referenced project (*.i2c) file. Following are the parameters being loaded. LowThresholdVoltageSetting, HighThresholdVoltageSetting, InterfaceSpeedSetting, TolerateSlowRiseTimes, DisableCollisionDetection, AnalyzerSuppliesBusVoltage, BusDriveVoltageSetting, BusDrivePullUpSetting, SlopeControlMode, BufferDepthSetting, Discrete1IOmode, Discrete1Drives_SMB_AT1, Discrete2IOmode, Discrete2InputSource, DiscreteVoltage, HiSpeedMode, TimingSkewMode, TimingSkewSetupTime, TimingSkewHoldTime, SMBusTimeout, Is8BitAddrFormat Prototype: extern “C” __declspec(dllexport) char * _cdecl I2C_LoadSetup ( char * szFilename );...
- Page 224 I2C_PulseDiscrete Pulses one of the discrete I/O signals low for a specified period of time, if it is configured as output. If discrete 1 is selected and it is configured as tied to the output trigger SMB, that signal will be operated instead of the line to the target.
- Page 225 I2C_Random_Read Writes internal memory address of the slave device to read from, and then reads data from it. Prototype: extern “C” __declspec(dllexport) int _cdecl I2C_Random_Read ( int nAddress, int b10BitAddress, unsigned char * pMemAddrBytes, int nMemAddrLength, unsigned char * pReceiveData, int nDataCount, int bUseStopBits);...
- Page 226 I2C_Receive_Data Launches a Receive operation as in the Debugger function, conveying data bytes from a given bus address and checking for its timely completion. This function may not return quickly (up to the timeout interval) depending on the time it takes to receive and confirm completion. Use the I2C_GetLastTransferStatus function following this call to determine if the address cycle got NAK’ed.
- Page 227 I2C_Receive_Data_Q Reads data from the specified target and returns immediately without waiting for the read values, which will be stored in a queue for later retrieval. In order to retrieve the queued data, call I2C_Receive_Data_Q_Get function with matching QID. This function enables retrieving of the read data while avoiding the gaps between transactions.
- Page 228 I2C_Receive_Data_Q_Get Retrieves queued data values stored from the previous I2C_Receive_Data_Q function call. Prototype: extern “C” __declspec(dllexport) int _cdecl I2C_Receive_Data_Q_Get ( int nQID, unsigned char * pReceiveData, int nDataCount); Return Value: Number of bytes retrieved. Parameters: nQID ID of the queue entry to be retrieved from the memory. pReceiveData A pointer to a block of memory where the receive data bytes are to be stored.
- Page 229 I2C_Send_Data Sends a message (ie. performs a write operation) to the specified target slave address. This function may not return quickly (up to the timeout interval) depending on the time it takes to send and confirm completion. Use the I2C_GetLastTransferStatus function following this call to determine if the address cycle got NAK’ed.
- Page 230 I2C_SendData Sends a message (ie. performs a write operation) to the specified target slave address. This function may not return quickly (up to the timeout interval) depending on the time it takes to send and confirm completion. Use the I2C_GetLastStatus function following this call to determine if the address cycle got NAK’ed.
- Page 231 I2C_SendDataPEC Sends a message (ie. performs a write operation) with a SMBus Packet Error Checking (PEC) byte to the specified target slave address. The PEC is a CRC-8 error-checking byte, calculated on all the message bytes (including addresses and read/write bits). The PEC is appended to the message as the last data byte.
- Page 232 I2C_SenseDiscrete Reads the level of one of the discrete I/O signals. If discrete 2 is selected and it is configured as tied to the input trigger SMB, that signal will drive this function instead of the target signal. The configured direction of the signal has no effect here.
- Page 233 I2C_SetBusDriveVoltage Overwrite configuration reference voltage with provided value. Prototype: extern “C” __declspec(dllexport) char * _cdecl I2C_SetBusDriveVoltage ( char * szVoltage ); Return Value: NULL if I2C_InitHardware was never called, otherwise a pointer to a string containing the actual resulting reference voltage (closest available to requested). Parameters: szVoltage The string holding text of the new bus reference level as a floating-point decimal value in volts.
- Page 234 I2C_SetBusHighVoltageThreshold Overwrite configuration high threshold voltage with provided value. This supports the hysteresis feature of the analyzer as it monitors the bus and improves noise immunity. If a bus signal is currently considered low, it must be sensed above this voltage before being switched to high by the analyzer. Note that for slow rising busses (high parasitic capacitance, with Accelerated Rising Edge Drive off), the rise time may limit the ability of a driver to achieve a desired clock rate (since the top of the pulse may not reach the high threshold before turning around again).
- Page 235 I2C_SetBusLowVoltageThreshold Overwrite configuration low threshold voltage with provided value. This supports the hysteresis feature of the analyzer as it monitors the bus and improves noise immunity. If a bus signal is currently considered high, it must be sensed below this voltage before being switched to low by the analyzer. Note that for slow rising busses (high parasitic capacitance, with Accelerated Rising Edge Drive off), the rise time may limit the ability of a driver to achieve a desired clock rate (since the top of the pulse may not reach the high threshold before turning around again).
- Page 236 I2C_SetBusPullupResistance Overwrite configuration pull-up resistors with provided value (same for both bus signals). Note that high pull-up values may increase the signal rise times impacting the bus monitoring function and affecting clock rate performance. This is also affected by Accelerated Rising Edge Drive and threshold values.
- Page 237 I2C_SetBusVoltageSource ( int nSource ); Return Value: 0 if I2C_InitHardware was never called, otherwise 1. Parameters: nSource 0 if target should drive the voltage (enter Target Supplied mode). 1 if the BusPro-I should drive the voltage (enter Analyzer Supplied mode). Third Party Application Interface...
- Page 238 I2C_SetClockRate Overwrite configuration SCL clock rate with the provided value. This is the rate at which the analyzer attempts to run when it drives the bus. Note that for slow rising busses (high parasitic capacitance, with Accelerated Rising Edge Drive off), the rise time may limit the ability of a driver to achieve a desired clock rate (since the top of the pulse may not reach the high threshold before turning around again).
- Page 239 I2C_SetDiscrete Drives the level of one of the discrete I/O signals to the state passed in, if configured as output. If discrete 1 is selected and it is configured as tied to the output trigger SMB, that path will be operated instead of the line to the target.
- Page 240 I2C_SetDiscreteVoltage Overwrite configuration TTL voltage level for the high state of the discrete I/O signals. Prototype: extern “C” __declspec(dllexport) char * _cdecl I2C_SetDiscreteVoltage ( char * szVoltage ); Return Value: NULL if I2C_InitHardware was never called, otherwise a pointer to a string containing the actual resulting voltage (closest available to requested).
- Page 241 I2C_SetFEAddrFormat Defines the mode of byte representation used throughout the set of DLL commands for 7-bit addresses. That is, the 7 bits of the protocol address is always given in a byte, but these bits can be placed in the byte either left-justified where the LSB is zero (FE mode), or right-justified where the MSB is zero (7F mode).
- Page 242 Sets application-defined callback function for processing transaction data. This callback function is called whenever BusPro-I detects any new transactions on the target I2C bus. The callback function should perform minimal necessary work and return immediately to avoid overflowing of BusPro-I buffer.
- Page 243 9 8 7 Error Transaction Type: TxType[3:0] = 0x3 Summary of Error Codes: 00H: no error 01H: ADDR_ERR - Protocol violation found during address transaction 02H: START_ERR - START hold time violation (i.e. less than minimum hold time) 03H: DATA_ERR - Protocol violation found during data transaction 04H: reserved 05H: reserved 06H: reserved...
- Page 244 I2C_SetRisingEdgeDriveMode Overwrite configuration rising edge drive setting with provided selection. When enabled and driving the bus, the analyzer will assert hard drivers on the bus momentarily, during signal rising edges. This should overcome parasitic capacitance on the bus resulting in fast rise-times. Prototype: extern “C”...
- Page 245 I2C_ShutdownHardware Forces an orderly shutdown of the BusPro-I analyzer and its USB disconnection. This function must be invoked prior to any new I2C_InitHardware call, for trouble-free operation. Otherwise, the analyzer must be unplugged and re-plugged into the PC before being initialized again. This function may not return immediately, until the disconnection is complete.
- Page 246 Third Party Application Interface...
-
Page 247: Appendix A Buspro-I Hardware Reference
5.0V Provided by the host USB 2.0 port in compliance with its requirements. Do not connect the BusPro-I to the host PC through a bus (passive/un- powered) powered USB hub. It may not provide adequate operating current. An externally powered hub is OK. -
Page 248: Electrical Specifications
Prior to launching the I2C Exerciser application, both LEDs will be lit while plugged into a powered host PC. Once the application is running, the LEDs have the following meaning: Green LED – BusPro-I is powered and initialized Amber LED – I C bus activity is detected... - Page 249 Programmable SDA/SCL Reference Pull-up resistor (in Analyzer Supplied mode) starting at a Pull-up Resistors base approximate value of 250 ranging up to 50K ohms in an assortment of 64 values. Available values are 250, 1000, 1850, 2650, 3450, 4200, 5000, 5800, 6600, 7400, 8200, 9000, 9750, 10550, 11350, 12150, 12950, 13750, 14550, 15350, 16100, 16900, 17700, 18500, 19300, 20100, 20900, 21700, 22450, 23250, 24050, 24850, 25650, 26450, 27250,...
- Page 250 - The BusPro-I supports SCL frequencies of up to 5 MHz, but actual performance may be limited due to target bus conditions, such as parasitic capacitance and pull-up resistance (rise-time). - Standard/Fast/Fast-mode Plus is supported for master emulation and monitoring up to 5MHz; High- Speed mode is supported for target monitoring only up to 5 MHz (no emulation).
Need help?
Do you have a question about the BusPro-I and is the answer not in the manual?
Questions and answers