Sign In
Upload
Manuals
Brands
Affinité Instruments Manuals
Laboratory Equipment
P4SPR
Affinité Instruments P4SPR Manuals
Manuals and User Guides for Affinité Instruments P4SPR. We have
1
Affinité Instruments P4SPR manual available for free PDF download: User Manual
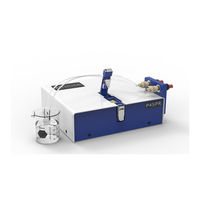
Affinité Instruments P4SPR User Manual (61 pages)
Portable 4-Channel Surface Plasmon Resonance
Brand:
Affinité Instruments
| Category:
Laboratory Equipment
| Size: 3 MB
Table of Contents
Table of Contents
3
General Information
10
Purpose of this Manual
10
Device Overview
10
Before You Start
10
P4SPR Starter-Kit Checklist
10
Figure 1- Device Components
11
Unpacking Instructions
12
Technical Specifications
13
System Specification
13
Table 1 - P4SPR Technical Specification
13
Microfluidic Cell
14
Analytical Performances
14
Limitations of Liability
14
Table 2 - Microfluidic Cell Technical Specification
14
Table 3 - Analytical Performances Technical Specification
14
Safety Notes
15
Environmental Requirements
15
Chemical Compatiblity
15
Installation
17
Instrument Installation
17
Figure 2 - P4SPR Installed Setup (Version May Slightly Vary)
17
SPR Sensor Insertion
18
Figure 3 - SPR Sensor Chip Handing
18
Tubing Connection
19
Figure 4 Aligning Holes on the Cell Holder Arm with Microfluidic Cells
19
Figure 5 Inserting Connectors through Aligned Holes
19
Leak Test
20
Software Installation
20
Figure 6 Connector in Microfluidic Cell
20
Figure 7 P4SPR Installer Folder
21
Figure 8 P4SPR Installation Directory
21
Figure 9 P4SPR Installation License Agreement
22
Figure 10 P4SPR Installation Review
22
Figure 11 P4SPR Installation Complete
23
Figure 12 Restart PC
23
Installation Troubleshooting
24
Figure 13 P4SPR Control Software Icon
24
Figure 14 P4SPR Optical Detector Driver in Device Manager
24
Figure 15 P4SPR Optical Detector Driver Property Window
25
Figure 16 Update P4SPR Optical Detector Driver
25
Figure 17 P4SPR Optical Detector Driver Path (Left) and USB4000 Folder Unzipped on USB Stick
26
Operation Instructions
27
General Guidelines
27
Overall Setup of the P4SPR
28
Sensor Set up
28
Figure 18 Overall P4SPR Setup Picture
28
Figure 19 SPR Sensor Setup Picture
28
Microfluidic Setup
29
Software and Gui
30
Overview of P4SPR Data Acquisition
30
Figure 20 Overview of P4SPR Control Graphicaluser Interface
30
Software and Device Setup
31
Figure 21 P4SPR Software on Button
31
Figure 22 P4SPR Software Connect Device Window
31
Graphical User Interface (GUI) Quick Start
32
Figure 23 P4SPR Software Connection Confirmatino Window
32
Figure 24 GUI Message Board
32
Figure 25 GUI Spectroscopy Tab Initial Display
33
Figure 26 GUI Data Acquisition Tab
34
GUI Tabs
35
Data Acquisition Tab
35
Figure 27 GUI Data Acquiring Tab
35
Spectroscopy Tab
36
Figure 28 GUI Spectroscopy Tab
36
Parameter Tab
37
Figure 29 GUI Parameter Tab
37
Additional GUI Hints
38
Graphic Display
38
Figure 30 GUI Graphical Display
38
Cursor Control
39
Figure 31 GUI Cursor Control
39
Graphic and Channel Display - Full Sensorgram View
40
Figure 32 GUI Channel Display
40
Graphic and Channel Display - Segment of Interest
41
Figure 33 GUI Segment of Interest Display
41
Segments Table
42
Figure 34 GUI Segment Table
42
Display Channel Average on Segment of Interest Graph
43
Activate Reference
43
Figure 35 GUI Average Display Option
43
Data Processing Tab
44
Figure 36 GUI Data Recording
44
Graphics Tab
45
Figure 37 GUI Graphics Display
45
GUI Example: Determining of SPR Shift of Different Solutions
46
Figure 38 GUI Example : Segment Table
46
Export Data
47
Cleaning Procedure and Store Device
47
Data Output and Analysis
48
Processed Data Representation
48
Figure 39 Raw Data
48
Figure 40 Overlaid Sensorgram Segments
48
Structure in Saved Folder
49
Data Processing of Table in Excel (Case of Calibration Curve with Nacl in Water)
49
Figure 41 Shifts
49
Figure 42 Data Structure in Saved Folder
49
Troubleshooting
51
Setting up a Microfluidic Cell
51
Troubleshooting Via Spectroscopy Tab
51
Out of Range Refractive Index
51
Figure 43 Setting up the Microfluidic Cell
51
Air Bubble
52
Figure 44 Transmission Spectra
52
Figure 45 Troubleshooting Full Sensorgram
52
Figure 46 Air Bubbles in Microfluidic Channels
52
Figure 47 Large Bubble Effect on Sensorgram Graph
53
Figure 48 Large Bubble Effect on Transmission Spectra Graph
53
Leak in Sample Holder
54
Figure 49 Leak Warning
54
Figure 50 Weak LED Intensity in Channel a (White Line) Due to a Leak
54
Figure 51 Water Leak
54
Saturating Signal
55
Figure 52 Transmission Spectra after Clearing Leak
55
Misplaced Sample Cell Holder
56
Sensor Transmittance above T20
56
Figure 53 Signal Saturation
56
Maintenance
57
Rinsing before and after each Run
57
Microfluidic Cell
57
Sensor
57
Tubing
57
Check Valves
57
Dust
58
Order Parts and Consumables
59
Table 4 List of Parts and Consumables
59
Advertisement
Advertisement
Related Products
Affinité Instruments Categories
Laboratory Equipment
More Affinité Instruments Manuals
Login
Sign In
OR
Sign in with Facebook
Sign in with Google
Upload manual
Upload from disk
Upload from URL