
Summary of Contents for Affinité Instruments P4SPR
- Page 1 Portable 4-Channel Surface Plamson Resonance (P4SPR) User Manual Research Use Only www.affiniteinstruments.com Rev 2.0...
- Page 2 Revision History October 13 2020: First version for production version of P4SPR October 26 2020: Fixed Figure 37 November 20 2020: revised technical specifications November 25 2020: correcte page numbers December 09 2020: Updated driver install for Flame T December 17 2020: updated some maximum rating conditions...
-
Page 3: Table Of Contents
Leak Test.................................. 12 Software Installation ............................12 Installation troubleshooting ............................ 16 OPERATION INSTRUCTIONS ....................... 19 General guidelines ............................... 19 Overall setup of the P4SPR ..........................20 Sensor set up ................................20 Microfluidic setup ..............................21 SOFTWARE AND GUI ........................22... - Page 4 Overview of P4SPR data acquisition ........................22 Software and device setup........................... 23 Graphical User Interface (GUI) Quick Start ......................24 GUI Tabs ................................27 Data Acquisition Tab ............................... 27 Spectroscopy Tab ..............................28 Parameter Tab ................................. 29 Additional GUI Hints ............................30 Graphic display ................................
- Page 5 Rinsing before and after each run ........................49 Microfluidic cell ..............................49 Sensor .................................. 49 Tubing .................................. 49 Check valves ................................ 49 Dust ..................................50 ORDER PARTS AND CONSUMABLES ................... 51...
- Page 6 List of Tables Table 1 - P4SPR technical specification ..................5 Table 2 - Microfluidic cell technical specification ................ 6 Table 3 - Analytical performances technical specification ............6 Table 4 List of parts and consumables ..................51...
- Page 7 Figure 15 P4SPR Optical Detector Driver Property WIndow ............ 17 Figure 16 Update P4SPR Optical Detector Driver ..............17 Figure 17 P4SPR Optical Detector Driver Path (Left) and USB4000 folder unzipped on USB stick............................... 18 Figure 18 Overall P4SPR Setup Picture ..................20 Figure 19 SPR Sensor Setup Picture ...................
- Page 8 Figure 37 GUI Graphics Display ....................37 Figure 38 GUI Example : Segment Table ..................38 Figure 39 Raw Data ........................40 Figure 40 Overlaid Sensorgram Segments ................40 Figure 41 Shifts ..........................41 Figure 42 Data Structure in Saved Folder .................. 41 Figure 43 Setting up the microfluidic cell ..................
-
Page 10: General Information
This user manual describes all the steps needed to run the Portable, 4-Channel Surface Plasmon Resonance (P4SPR), from device setup to software installation, taking measurements and finally analyzing the obtained data. Please read this guide carefully before using the P4SPR and keep it available to ensure maximum device performance. This manual frequently updated. -
Page 11: Figure 1- Device Components
Figure 1- Device Components... -
Page 12: Unpacking Instructions
Unpacking instructions Carefully unpack the product immediately and check the box to make sure all the parts are in the package and are in good condition. If the box or the content show signs of damages from shipping, or signs of mishandling, notify the carrier immediately as well as Affinité... -
Page 13: Technical Specifications
Technical specifications System Specification Table 1 - P4SPR technical specification Dimensions (175 x 155 x 55) mm Weight < 1.3 kg Operating -10ᵒC to 40ᵒC temperature range Power Two USB ports via computer or laptop. USB 5 VDC, requirement 250 mA... -
Page 14: Microfluidic Cell
Limitations of liability Affinité Instruments is not responsible for the misinterpretation as a result of following instructions given this manual. Please contact Technical Support (info@affiniteinstruments.com) or your local distributor to discuss any questions you validated using using Affinité Instruments P4SPR Calibration Kit... -
Page 15: Safety Notes
may have from your measurement. As with all scientific studies, your experiment should be repeated before making any significant conclusions for public presentations or publications. Safety Notes • This instrument is designed for research use only and should not be used for diagnostics or clinical applications in any circumstances. - Page 16 Highly acidic (pH <2) or highly basic (pH >12) solutions for an extended period of • time. Precipitated or highly viscous solutions. • Organic solvents, except for DMSO up to 20% in water, glycerol up to 50% in water • and ethanol/methanol up to 70% in water.
-
Page 17: Installation
Installation Instrument Installation The P4SPR comes with four (4) tubes pre-assembled with connectors that the user has to connect to the instrument prior using it. The microfluidic inlet tubing (2) and outlet tubings (2) must be connected as shown as picture in Figure 1. -
Page 18: Spr Sensor Insertion
SPR sensor insertion Carefully take out a sensor from the package by holding both shorter ends. Take extra care to not touch the gold surface. If residue is found on the surface, use a gentle stream of air to blow it away. If residue is seen on the longer edges of the sensor, gently wipe the edges with a kim wipe Gently place the SPR sensor into the cavity... -
Page 19: Tubing Connection
Tubing connection Hand tighten the threaded end of the inlet tubing to the threaded adaptor of the injection port for the sample and reference. The reference injection port is the one with the arrow sticker Remove a microfluidic cell from the package, make sure to remove the protective film from the side of the 4-channel engraving Lift the latch up and align the 4 holes on the... -
Page 20: Leak Test
Software Installation Visit to access the latest version of the P4SPR control www.affiniteinstruments.com/software software. Currently we support Windows 7 and up OS. Once you have downloaded the installation file. 1. Find the P4SPR installer folder and install the \P4SPR_installer\Volume\setup.exe... -
Page 21: Figure 7 P4Spr Installer Folder
Figure 7 P4SPR installer folder 2. These are default directory paths for the P4SPR software and National Instruments files. Click Browse… to change path and click Next to continue Figure 8 P4SPR installation directory 3. Read the license agreement and select I accept the above 2 License Agreement(s) then... -
Page 22: Figure 9 P4Spr Installation License Agreement
Figure 9 P4SPR installation license agreement 4. This is to inform on what is being installed or changed on your computer. Click Next to launch the installation. Figure 10 P4SPR installation Review 5. Press Nextafter installation has completed. -
Page 23: Figure 11 P4Spr Installation Complete
Figure 12 Restart PC 7. On your computer, go to the following path and create a shortcut of the P4SPR Control software on your desktop. Or it can be located in: c:\Users\(User name)\Program Files (x86)\Affinite Instruments\P4SPR... -
Page 24: Installation Troubleshooting
Figure 13 P4SPR Control Software Icon The installation is now completed. You can now plug both USBs from P4SPR to your PC. Installation troubleshooting If your PC does not detect the optical detector, then it is possible the driver has not been installed properly. -
Page 25: Figure 15 P4Spr Optical Detector Driver Property Window
Figure 15 P4SPR Optical Detector Driver Property WIndow 3. Click on Update Driver Figure 16 Update P4SPR Optical Detector Driver 4. Select Browse my computer for driver software and follow the path to the folder USB4000 on the USB key provided with the device. Make sure you unzipped... -
Page 26: Figure 17 P4Spr Optical Detector Driver Path (Left) And Usb4000 Folder Unzipped On Usb Stick
USB key otherwise folder path will not be visible in Browse For Folder. Figure 17 P4SPR Optical Detector Driver Path (Left) and USB4000 folder unzipped on USB stick. The PC will now install manually the P4SPR optical detector USB driver. If this does not work, please contact us at info@affiniteinstruments.com... -
Page 27: Operation Instructions
5. Inject at a flow rate of about 100 µL per second. 6. While wearing gloves, place a sensor into the P4SPR by holding the shorter end sides of the sensor. Avoid touching the gold surface or the windows on the prism’s longer edges. -
Page 28: Overall Setup Of The P4Spr
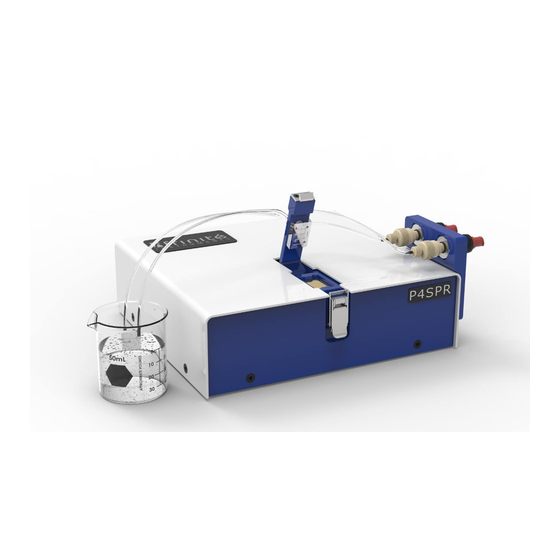
Overall setup of the P4SPR Figure 18 Overall P4SPR Setup Picture Sensor set up Figure 19 SPR Sensor Setup Picture 1. Make sure the microfluidic cell (mfd cell) is in place on the cell holder arm. If the mfd cell is not in place, see how to set it up in section 4.2.8 below 2. -
Page 29: Microfluidic Setup
4. Visually inspect from the side that the mfd cell is sitting squarely on the gold sensor Microfluidic setup 1. Using a 1-mL syringe filled with DI water, inject 500 L at a flow rate of approximately 100 L / sec into each channel inlets 2. -
Page 30: Software And Gui
Software and GUI Overview of P4SPR data acquisition Figure 20 Overview of P4SPR Control GraphicalUser Interface... -
Page 31: Software And Device Setup
Software and device setup 1. Plug in the 2 USB cables from the back of the P4SPR to the USB port of your computer. 2. Click the application to open the software “P4SPR Control” 3. Press the ON (beside the green button) to turn the system ON Figure 21 P4SPR Software On Button 4. -
Page 32: Graphical User Interface (Gui) Quick Start
A Window Pop up will show after 5 seconds. Click “OK” • Figure 23 P4SPR Software Connection Confirmatino Window Graphical User Interface (GUI) Quick Start The software will start displaying data in Setup Mode that is not recorded automatically as indicated on the Message Board section in the top center. -
Page 33: Figure 25 Gui Spectroscopy Tab Initial Display
Figure 25 GUI Spectroscopy Tab Initial Display Click Data Acquiring Tab, the Left Panel SPR wavelength minimum should be between 610 nm and 640 nm and the Right Panel should be around zero. If the signal on the right panel is oscillating by more than 0.1 nm over 120 sec, then see the section Troubleshooting via Spectroscopy Tab. -
Page 34: Figure 26 Gui Data Acquisition Tab
Figure 26 GUI Data Acquisition Tab Now you can press to start your experiment. Select the folder path to save the experiment data. Both Panels will reset to time zero, the background should turn from grey to black. Your data is now being automatically recorded. NOTE: If the override message is prompted, create a new folder to preserve your previous data. -
Page 35: Gui Tabs
GUI Tabs Below are some screenshots explaining various tabs and their functions inside the P4SPR GUI. Data Acquisition Tab Figure 27 GUI Data Acquiring Tab... -
Page 36: Spectroscopy Tab
Spectroscopy Tab Figure 28 GUI Spectroscopy Tab... -
Page 37: Parameter Tab
Parameter Tab Figure 29 GUI Parameter Tab... -
Page 38: Additional Gui Hints
Additional GUI Hints Graphic display The Full Sensorgram View graph displays the whole run. • The Segment of Interest graph is the region within the boundaries of the Yellow and Red cursor on the Full Sensorgram • View (see the section Cursor control). The delta wavelength in the Segment of Interest graph is referenced against the Yellow marker. -
Page 39: Cursor Control
Cursor control Figure 31 GUI Cursor Control... -
Page 40: Graphic And Channel Display - Full Sensorgram View
Graphic and Channel Display – Full Sensorgram View Figure 32 GUI Channel Display... -
Page 41: Graphic And Channel Display - Segment Of Interest
Graphic and Channel Display – Segment of Interest Figure 33 GUI Segment of Interest Display... -
Page 42: Segments Table
Segments table This table is enabled ONLY in record mode. Figure 34 GUI Segment Table Segments are portions of the Full Sensorgram View data displayed and saved individually. • Segment names are numbers from 1 and up. • The Start Time and End Time correspond to the time in the Full Sensorgram View data and are defined by the cursors. •... -
Page 43: Display Channel Average On Segment Of Interest Graph
Display Channel Average on Segment of Interest graph This function allows to display the average of two or three channels on the right graph. Click on Average Display Option button. • Select the channels you want to average and press OK •... -
Page 44: Data Processing Tab
Data Processing Tab Figure 36 GUI Data Recording Click on Load to load saved data for post-run processing. • Adjust the yellow and red cursors to define the segments. • Click on Add to add segment and Save Shift for shift calculation. •... -
Page 45: Graphics Tab
Graphics Tab Figure 37 GUI Graphics Display... -
Page 46: Gui Example: Determining Of Spr Shift Of Different Solutions
Once the data is loaded and processed in the Data Processing Tab, graph of the concentration vs. SPR shift is plotted. • Choose between Linear or Affinity graph fitting model to establish a calibration curve or evaluate dissociation • constant (K The concentration value (X) will automatically appear in this table if the value is entered in the Data Processing Tab •... -
Page 47: Export Data
Export data 1. Once you've finished collecting data onto the table - make sure to press the button to export individual or all segments in the table. Your exported data will be saved in the folder path you entered. 2. When finished with your experiment make sure to click to stop recording. -
Page 48: Data Output And Analysis
Data output and Analysis Processed Data Representation Below are some examples on how the recorded data may be processed. Raw data: SPR band position (in wavelength) over time. Figure 39 Raw Data Sensorgram segments: Overlaid SPR band position (in wavelength shift) over time. Figure 40 Overlaid Sensorgram Segments Shifts: “Table”... -
Page 49: Structure In Saved Folder
Figure 41 Shifts Structure in saved folder Figure 42 Data Structure in Saved Folder “A, B, C and D_Graph” are sensorgram data for each channel “All_Graph” is data collected from all 4 channels over time in a single column “1, 2, ….” is the segments of all for channels over a specific period of time defined by the user in the Table. - Page 50 Under the Data tab, select • delimiter, select semicolon and click Finish. • Subtract channel D value to each channel (A, B and C). • Average the shifts of across channel A, B and C for each segment. • For each segment, add the SPR shift of the previous segments. •...
-
Page 51: Troubleshooting
Troubleshooting via Spectroscopy Tab Out of range refractive index The operating refractive index (RI) range of the P4SPR is 1.333 to 1.39 RI unit. Within this range, an absorption band should be visible on the Transmission spectra graph between 610 nm and 700 nm. Outside of this range the Transmittance will be near 100 and no clear absorption band will be visible (see below). -
Page 52: Air Bubble
Figure 44 Transmission Spectra Figure 45 Troubleshooting Full Sensorgram Air bubble Small air bubbles Big air bubble Figure 46 Air Bubbles in Microfluidic Channels... -
Page 53: Figure 47 Large Bubble Effect On Sensorgram Graph
Bubbles mean trouble. Avoid injecting air bubbles into the channels as much as possible. Air bubbles have two effects on the SPR absorption band: increase the transmittance intensity and random large SPR shift. The increase in transmittance effect can be seen on the Transmission spectra graph. -
Page 54: Leak In Sample Holder
Leak in sample holder If a leak happens, this message will blink on the Message Board. Figure 49 Leak Warning Also, the signal will flatten in one or multiple channels on the Raw Spectra graph. Figure 50 Weak LED intensity in channel A (white line) due to a leak. If the mfd cell is damaged or seal with the sensor is not tight, liquid can leak out of the channels and into the sample holder. -
Page 55: Saturating Signal
In this case, clear the water in the channels by injecting air, unlock and lift the arm, take out the sensor and remove the sample holder. Make sure you wipe away all the water on the plateau and in the holes of the sample holder (see picture above). Then reinstall sample holder (make sure the larger holes are facing the LEDs), put back the sensor, lock the latch, flow water on the sensor and check the transmission panel. -
Page 56: Misplaced Sample Cell Holder
Figure 53 Signal saturation Misplaced sample cell holder If the intensity is weak and there is no leaks. Make sure the sample holder is properly sitting in the cavity. Press the bottom of the sample holder down to make sure it is sitting flat on the plateau. -
Page 57: Maintenance
Maintenance Follow this section for maintenance for P4SPR. An extensive maintenance is usually not required. However, general care must be taken to ensure proper operation of the P4SPR. Rinsing before and after each run Before a run, once the sensor and microfluidic cell are secured, inject 1mL of deionized water into each injection port to condition the system. -
Page 58: Dust
Dust In the event that dust has accumulated onto the P4SPR, a gentle jet of compressed air can be used to remove any presence of dust. 7.7 List of changeable spare parts and consumables... -
Page 59: Order Parts And Consumables
Order Parts and Consumables For orders, quotations, or information, contact Affinite Instruments at: Phone: +1-514-791-4082 Email: info@affiniteinstruments.com Online: www.affiniteinstruments.com Affinité Instruments, Inc. Montréal (HQ): 1250 rue Guy, Suite 600, Montréal, Québec, H3H 2L3 Toronto: Banting Institute, 100 College St Suite 150, Toronto, ON M5G 1L5 Table 4 List of parts and consumables Product name Description... - Page 60 For technical support or orders, Please contact us at info@affiniteinstruments.com visit www.affiniteinstruments.com www.affiniteinstruments.com Rev 2.0...
Need help?
Do you have a question about the P4SPR and is the answer not in the manual?
Questions and answers