
Related Manuals for PICARRO A0344 Sage

Summary of Contents for PICARRO A0344 Sage
- Page 1 A0344 Sage User Manual Gas Autosampler Edition: December 2024, Revision A Document Number: 40-0137 Picarro Inc. | 3105 Patrick Henry Drive | Santa Clara, CA 95054 USA +1 408 982 3900 | www.picarro.com...
- Page 2 Revision History Revision Date Notes December 2024 Initial release PN 40-0137, REV A A0344 User Manual...
- Page 3 DISCLAIMER AND RESERVATION OF RIGHTS Picarro has prepared this manual solely for the information and use by its customers as a guide for the selection, installation, operation, and maintenance of the products described.
- Page 4 5 Hardware Installation and Setup 5.1 Setup Safety 5.2 Pre-Installation Requirements 5.3 Required Setup 5.3.1 Instrument Dimensions and Placement 5.4 A0344 Sage Startup and Setup 6 Software 6.1 About the Pages 6.2 Information on the Status Bar 6.3 The Method Page 6.3.1 About Method Timing...
- Page 5 6.5.3 The Experiment Results Tab 6.5.4 The Export Data Tab 6.6 The Settings Page 6.6.1 The Settings Tab 6.6.2 The Standards Tab 6.6.3 The Manual Control Tab 7 Run an Experiment 7.1 Prepare Vials for an Experiment 7.1.1 Fill Vials from a Tank 7.1.2 Fill Vials from a Gas Bag or Other Sources 7.2 Download the CSV File 7.3 Working with Standards...
- Page 6 10.3 Septum Caps Over-Tightened 10.4 Reused Septa 10.5 Outliers on Calibration Curve 10.6 Manual Control of the Sage Gas Autosampler 10.7 Export Data for Troubleshooting A Evacuate Vials B Limited Warranty PN 40-0137, REV A A0344 User Manual...
- Page 7 List of Figures Figure 1 - Front view of the A0344 Sage gas autosampler Figure 2 - Back panel of the A0344 Sage gas autosampler Figure 3 - Back panel connections Figure 4 - Basic analyzer setup Figure 5 - A0344 Sage gas autosampler to analyzer connections Figure 6 - Common elements of Sage pages Figure 7 - ...
- Page 8 Figure 37 - A good and bad injection differs in outlet valve behavior Figure 38 - Septa caps tightened correctly and over-tightened Figure 39 - Bad and good septa Figure 40 - Outliers on the calibration curve Figure 41 - Manual Control buttons Figure 42 - Setup of the four-way valve PN 40-0137, REV A A0344 User Manual...
- Page 9 Table 2 - Analyzers compatible with the A0344 Sage gas autosampler Table 3 - Options and recommendations for tubing and connections Table 4 - Sample preparation kit for A0344 Sage gas autosampler (P/N A0346) A0344 User Manual PN 40-0137, REV A...
- Page 10 1 Introduction Introduction The Picarro A0344 Sage gas autosampler is an advanced solution designed to automate the measurement of greenhouse gas (GHG) concentrations and stable isotope ratios in small discrete gas samples. It addresses the need for high-precision, low-maintenance systems in GHG and isotope analysis, making it the ideal tool for researchers who require efficiency and reliability.
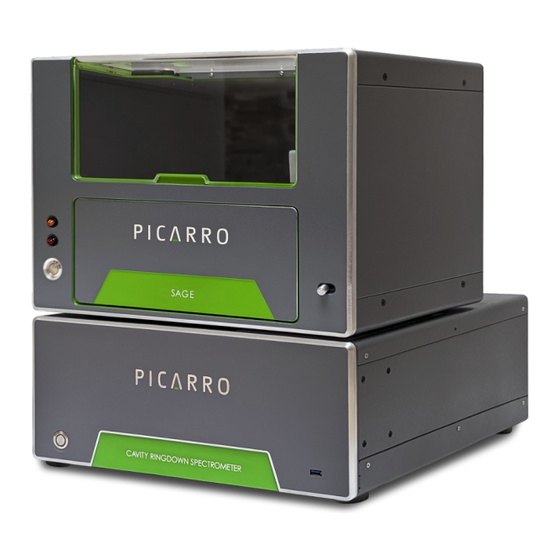
- Page 11 1.2.1 Front Panel The front panel of the A0344 Sage gas autosampler has a cover, two LED status lights, a power switch that illuminates when the power is on, a drawer to access the tray, and a lever to open the drawer.
- Page 12 The back panel of the gas autosampler contains a sample inlet port, a flush port, USB communications, and the power connection. Figure 2 - Back panel of the A0344 Sage gas autosampler Figure 3 - Back panel connections PN 40-0137, REV A...
- Page 13 1 Introduction 1.3 Specifications Table 1 - Specifications for the A0344 Sage gas autosampler Parameter Specifications Maximum Number of Vials Picarro recommends BD PrecisionGlide™ 22 G X 1" Hypodermic Needle Needles. Equivalent syringes from other manufacturers may be used.
- Page 14 1 Introduction 1.4 Compatible Analyzers Table 2 - Analyzers compatible with the A0344 Sage gas autosampler Model Number Gases Measured δ C in CO G2131- i δ C in CO and CH G2201- i δ C in CH , CH...
- Page 15 2 Safety Safety The following chapter provides an overview of warning symbols used in this document, general safety guidelines for using the A0344 Sage, and acquired certifications. 2.1 Warning Symbols The purpose of these icons is to provide a visual convention to alert you of important information.
- Page 16 Using the A0344 Sage in a manner not specified by Picarro may result in damage to the Sage and render it unsafe to operate. WARNING The A0344 Sage is for indoor use only and has an ingress protection rating of IPx-0. It is NOT protected against exposure to water including dripping, spraying, splashing or immersion.
- Page 17 HOT SURFACE The inlet gas connector on the back panel of the A0344 Sage, and its immediate vicinity, run hot during operation of the A0344 Sage. Take care when connecting gas lines or working at the rear of the instrument to wear protective gloves or avoid contact with these surfaces.
- Page 18 QuickStart Before connecting gas lines, connect your A0344 Sage gas autosampler to the analyzer by using a USB cable. Power on both the A0344 Sage and the CRDS analyzer to verify that they function properly and communicate with each other.
- Page 19 Exceeding the maximum of 5 psi pressure can cause damage to the CRDS analyzer. Refer to the CRDS analyzer user manual for further information. 2. Connect the 1/16” green tubing from the input port on the A0344 Sage to the analyzer’s sample inlet. PN 40-0137, REV A...
- Page 20 Inspect the condition of all boxes upon arrival. Even if the outer box shows damage, the inner box holding the analyzer will protect the instrument under most circumstances. If the equipment does appear to be damaged, photograph the damage and contact Picarro (email pictures) as soon as possible.
- Page 21 4 Unpacking Table 3 - Options and recommendations for tubing and connections Tubing included in the A0344 Sage gas autosampler 1/16" nut + ferrules on GA side accessory kit 1/16" nut and ferrule on analyzer Swagelok SS-100-NFSET side 1/6" to 1/4" adapter Swagelok SS-100-R-4 1/4"...
- Page 22 Pre-Installation Requirements The A0344 Sage gas autosampler is intended to be used as an accessory to compatible Picarro analyzers (for a list of analyzers that are compatible with the A0344 Sage, see section 1.4 Compatible Analyzers). It cannot function as a stand-alone device. The following pre- installation requirements are divided into two segments: requirements, and optional aspects a user may wish to prepare prior to installation.
- Page 23 Instrument Dimensions and Placement The A0344 Sage gas autosampler is 17" w X 13” h X 12.2" d (43.3 x 33.2 x 30 cm) and weighs 24.15 lb. (11.1 kg). It can be placed directly on top of a Picarro analyzer.
- Page 24 5 Hardware Installation and Setup 5.4 A0344 Sage Startup and Setup Figure 5 - A0344 Sage gas autosampler to analyzer connections A0344 User Manual PN 40-0137, REV A...
- Page 25 5.2 Pre-Installation Requirements. 1. Place the A0344 Sage gas autosampler on top or to the side of the analyzer. 2. Remove all gas port caps. 3. Plug in the communication cable and power cable to power-on the A0344 Sage gas autosampler.
- Page 26 6 Software Software The Picarro Sage Gas Autosampler software automates sample measurement and streamlines data analysis of the results. Powerful new tools generate real-time data visualizations, calibration curves, and other actionable data for faster, easier sample analysis and interpretation. The Sage software has the following pages: ...
- Page 27 6 Software 6.1 About the Pages All pages share common elements that you'll use as you work with them. These include: Navigation menu, where you select The active page area. pages. The status bar. Information about the currently running experiment. If a page has multiple tabs, they appear here.
- Page 28 6 Software The most recent status log entry. The connected analyzer type. The connection status. Button to show or hide detailed logs. Figure 7 - Status bar example You can view the logs by clicking Show Logs. The logs appear above the status bar and the button changes to Hide Logs .
- Page 29 6 Software List of defined sampling methods— Details about the selected sampling selected method highlighted. method. Click to add a sampling method. Click to delete the selected method. Click to save changes or save changes under a new name. Figure 9 - The Method page 6.3.1 About Method Timing The sampling methods determine how long each phase of the sampling takes.
- Page 30 6 Software Stabilization, where the system begins taking on the gas from the sample but the line is not yet wholly composed of the sample gas, but may still contain the reference gas introduced during flushing. This time is set to ensure that the sample gas fully occupies the sampling lines.
- Page 31 6 Software 6.4 The Run Page You use the Run page to set up and run an experiment, and to monitor the experiment's results, which display in real-time as the experiment commences. Run pages include: Sample List tab, where you create and set up experiments. ...
- Page 32 6 Software Experiment Template Settings area, Button to replace the needle. where you can name your experiment Removes all rows in the detail area for and select a sampling method. the selected experiment. The Sample List area—including Adds a row to the list of vials in the details, locations, and whether the vial experiment.
- Page 33 6 Software 6.4.2 Real Time Tab The Real Time tab displays the current readings in real time. The readings are color coded to show the different stages, such as standby, flush, stabilization, measurement, and post- measurement stages. Status about the currently running Click and drag to zoom in to view experiment.
- Page 34 6 Software 6.5.1 The Vial Results Tab The Vial Results tab displays a list of vials, their names, and their status for a selected experiment. You can view two available species measurements in plots and view the mean and standard deviation calculations derived during the measurement period. The plots let you evaluate the quality of the sampling process—you can see every time point for each variable and determine if there was an issue with a specific measurement, such as a leak, improper pressurization, or the zero air turned off.
- Page 35 6 Software 6.5.2 The Calibration Curve Tab On the calibration curve page, you can view the already-selected experiment or select a different one from the drop list. If the experiment measured a series of standards, the Sage Software can use the values to construct a calibration curve.
- Page 36 6 Software View Calibration Curve Details Click a point on the calibration curve to highlight the corresponding vial in the vial list on the left pane. Figure 15 - Drag to view detailed measurement points You may need to zoom in to see multiple vial measurements that are closely spaced on the curve.
- Page 37 6 Software Flags on the Calibration Curve Page Flags indicate results of the automatic outlier calculations, depending on which species (or data key) is selected to view. Red flag indicates a pressure outlier. Solid black flag indicates a measurement outlier for the selected species or data key. ...
- Page 38 6 Software Removing Outliers You can exclude outliers and problem vial readings by clearing the check box next to vial number. Flagged vial readings can be excluded Select the species sampled. individually by clearing the Include The calculated data updates as values check box.
- Page 39 6 Software View by Sample Groups You can also view the vial results by the group assigned when creating the sample list. doing so, you can exclude entire sample groups. If you select a group, the associated vials appear in the bottom pane, where you can work with them as in the vial view.
- Page 40 6 Software The selected experiment. The selected species. Shows individual or groups of vials. Corrected values are shown in green; measured values are in yellow. Show or hides corrected or measured values. Calculated values. Vials included in the results show with a selected check box.
- Page 41 6 Software View by Sample Groups You can also view the vial results by the group assigned when creating the sample list. doing so, you can exclude entire sample groups. If you select a group, the associated vials appear in the bottom pane, where you can work with them as in the vial view.
- Page 42 You can also export Quality Control (QC) sample measurements that may carry across several months of experiments. You can select a date range for the QC data. Exported data is saved on your local disk in this location: C:\Users\[User_Name]\Documents\Picarro Sage The selected experiment. Export a range of QC data. To specify...
- Page 43 6 Software Standards tab, where you can view an existing standard, edit an existing standard, or create a new standard. Manual Control tab, where you can control individual components of the autosampler for troubleshooting purposes. 6.6.1 The Settings Tab You use this tab to specify the serial port to connect to and whether the system should connect automatically on startup.
- Page 44 6 Software 6.6.2 The Standards Tab On the Standards tab, you define standards that can be used in your experiments. Standards specify a physical tank of gas with specific certified concentrations or deltas (or both). The page contains a list of standards, and the details defined within it. You can add new standards, edit and save changes you make to...
- Page 45 6 Software 6.6.3 The Manual Control Tab You can use the Manual Control tab to troubleshoot the autosampler or your sample preparation. This page lets you specify a vial position and move the needle to it, raise and lower the needle, open and close the valve, and change a needle. A visual representation of the tray of Click Replace Needle to pause the vials.
- Page 46 7 Run an Experiment Run an Experiment Running an experiment on the A0344 Sage gas autosampler occurs in two phases: the work you do setting up the physical sampling vials and trays, and the sampling done automatically by the A0344 Sage gas autosampler using the software settings you choose.
- Page 47 Appendix A, Evacuate Vials. 2. Use the 1/8” tubing in the A0344 Sage sample preparation kit to connect to the included luer lock using 1/8” compression fitting. 3. Connect the included needle to the luer lock and prepare the tubing.
- Page 48 Fill Vials from a Gas Bag or Other Sources Follow the steps below to transfer a gas sample from gas bags or other sources into the A0344 Sage exetainer vials. Figure 26 - Preparing to fill vials from a gas bag To fill vials from a gas bag or other source: 1.
- Page 49 7 Run an Experiment Figure 27 - Filling a syringe from a gas bag 5. Extract 60 mL of gas sample from the source. 6. Insert the needle of the syringe into the evacuated vial. 7. Open the valve. Pre-evacuated vials take in the gas sample as soon as the needle is inserted and the valve is opened on the syringe.
- Page 50 7 Run an Experiment 9. Repeat the transfer process to fill the remaining vials. NOTE This procedure can also be used to fill gas bags with calibration gases ahead of time. 7.2 Download the CSV File You can download a comma-separated value (CSV) file that you can use to document the location and contents of the vials offline, and then import later to quickly add the information in your experiment.
- Page 51 7 Run an Experiment 4. (Optional) In the Manufacturer field, type a name for the manufacturer of the tank or standard. 5. (Optional) In the Serial Number field, type the serial number of the tank or standard. 6. (Optional) Click Select in the Expiration Date area to select an expiration date for the sample.
- Page 52 7 Run an Experiment 3. (Optional) Modify the fields you want to change. 4. Click Save As to save the standard under a different name. 7.4 Working with Methods A method determines the timing of the sampling process, from the initial flushing of the analyzer lines to the time to allow for stabilization of the gas within the lines, the actual sampling times, and time between sampling sequences for the system to reset.
- Page 53 7 Run an Experiment NOTE The post-measurement duration is calculated automatically as the difference between the Sample box and the values in the Stabilization and Measurement boxes. If the value is outside the optimal range of 5-30 seconds, adjust the values in the other boxes until this value is within the optimal range.
- Page 54 7 Run an Experiment 7.5.1 Create a New Experiment When you create a new experiment, you name it and choose a default sampling method. Then you enter the sample details, including the location of vials, their type (unknown, standard, or QC) and their content, the standard name (if the content type is standard), and the sampling method to use, if different from the experiment's default.
- Page 55 7 Run an Experiment Figure 30 - The Vial Selection pop-up 3. Click individual vial locations on the tray to specify where this sample group is located. Click and drag a range of locations. NOTE Depending on your planned sampling sequence, there is an option to drag and select a row, which can be assigned to one sample group.
- Page 56 7 Run an Experiment NOTE You can also specify locations by typing the locations directly in the Vials field. 4. In the Sample Type box, select the type of sample for this group. You can choose from: Unknown - the vials containing the samples you want to test. ...
- Page 57 7 Run an Experiment NOTE Follow these steps to import a CSV file to quickly add this information. You can also manually add details for your samples. To import sample details: 1. Click Import. 2. In the Open Sample List dialog box, locate the CSV file you want to import. 3.
- Page 58 8 View Results View Results You can view results as soon as an experiment has completed. You'll do that on the Results page. For the Vial Results , Calibration Curve , and Experiment Results tabs, you'll first need to select an experiment to see the data. 8.1 ...
- Page 59 CAUTION Do not install third-party data processing applications on the Picarro analyzer. You can also export Quality Control (QC) data for a range of dates. This QC export is not limited to a single experiment.
- Page 60 8 View Results For additional information on using the Export Data tab, see 6.5.4 The Export Data Tab. 8.5 Understanding Results The Sage software creates graphs of the vial measurements to visually represent the data. An example is shown below. Figure 33 - A sample view of the Results page Figure 33 displays various stages of sampling a vial.
- Page 61 2. Click Replace Needle. The XYZ arm moves to the needle-change position. 3. Open the cover of the A0344 Sage autosampler. 4. Disconnect the current needle from the luer lock at the XYZ arm of the A0344 Sage autosampler. A0344 User Manual...
- Page 62 Figure 34 - The needle inside the autosampler 5. Replace with the new needle. 6. Ensure the needle is connected and locked into the luerlock of the XYZ arm. 7. Close the cover on the A0344 Sage autosampler. 8. Click Done. 9.2 ...
- Page 63 9 Maintenance 3. Open the cover of the A0344 Sage autosampler. 4. Disconnect the current needle from the luer lock at the XYZ arm of the A0344 Sage autosampler. 5. Replace with the new needle. 6. Ensure the needle is connected and locked into the luer lock of the XYZ arm.
- Page 64 10 Troubleshooting Troubleshooting 10.1 Test the vacuum in the vials: the bubble test It is important to test the vacuum in the vials that will be used. An easy way of testing the vacuum is the bubble test. To bubble-test vials: 1.
- Page 65 10 Troubleshooting Vial data with good needle pressure Vial data with poor needle pressure Figure 36 - Plots indicating that the needle pressure is faulty Outlet valve Outlet valve behavior can also be used to track bad injections. Good Figure 37 - A good and bad injection differs in outlet valve behavior A0344 User Manual PN 40-0137, REV A...
- Page 66 10 Troubleshooting 10.3 Septum Caps Over-Tightened Caps should be optimally tightened and too much tightness leads to septum kink and subsequent leaks. NOTE It is very important not to over-tighten the caps. The butyl rubber septum will be pushed into the vial.
- Page 67 10 Troubleshooting A septum with multiple punctures An unused septum Figure 39 - Bad and good septa 10.5 Outliers on Calibration Curve Check for outliers. Flagged data points should be reviewed by users and excluded from calibration as appropriate. Some outliers may also exist in concentration or isotope variables, which need to be reviewed and excluded accordingly.
- Page 68 Settings page, to test or troubleshoot the autosampler or your sample preparation setup. The manual control of the A0344 Sage can help you troubleshoot and perform preventative maintenance. For example, from this page you can: ...
- Page 69 10 Troubleshooting Returns the needle to the home Opens or closes the flush gas tank position. valve. Raises or lowers the needle into a Turns on or off the arm motors. selected vial location. Moves the arm to a convenient spot to replace the needle.
- Page 70 Before filling the vials with the gas you intend to measure, you must first evacuate the vials from any gasses to ensure a valid reading. Follow the instructions below to evacuate vials using a Picarro A2000 or similar external vacuum pump. Table 4 - Sample preparation kit for A0344 Sage gas autosampler (P/N A0346) Description Quantity For evacuation 1/16"...
- Page 71 This setup ensures that, while the external pump is used to evacuate vials using A0344 Sage gas autosampler, the analyzer's inlet is allowing ambient air to flow in. Any deviation from this setup may result in chocking of the sample inlet of CRDS analyzer and cause damage to cavity over time.
- Page 72 A Evacuate Vials Sample evacuation method time settings: Flush = 5 seconds Sample = 60 seconds Stabilization = 10 seconds Measurement = 45 seconds Post measurement = 5 seconds 4. From the main menu, click Run, and then the Sample List tab. 5.
- Page 73 Picarro repair or replace such defective Product or credit the Purchaser’s account, whichever Picarro may elect in its sole discretion. If it is found that any Product has been returned which is not defective, the Purchaser will be notified and such Product returned at the Purchaser’s expense.
- Page 74 There will be no charge for repair of products under warranty where the repair work is done by Picarro, Inc. NOT COVERED BY THE WARRANTY — Damage to any optical surface from improper handling or cleaning procedures.
- Page 75 Access to online community forums and software downloads are available only for registered Picarro customers with login credentials. If you do not have an account, you can register by using the community and software download links below. ...
Need help?
Do you have a question about the A0344 Sage and is the answer not in the manual?
Questions and answers