Table of Contents
Advertisement
Quick Links
Advertisement
Table of Contents

Related Manuals for PCB LARSON DAVIS HVM200


Summary of Contents for PCB LARSON DAVIS HVM200
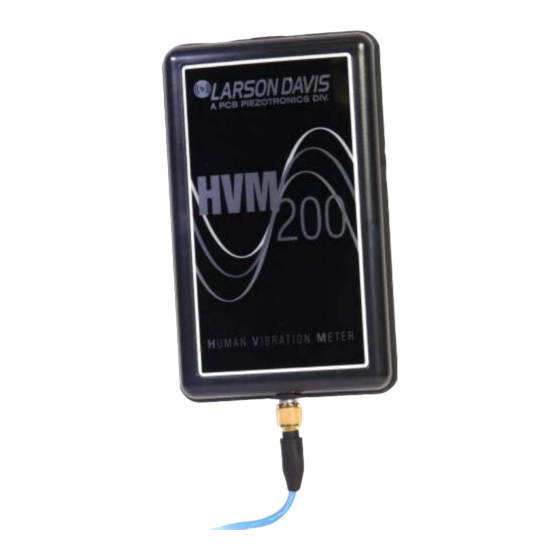
- Page 1 HVM200 Human Vibration Meter Reference Manual...
- Page 2 Larson Davis HVM200 Reference Manual IHVM200.01...
- Page 3 Copyright Copyright 2024, by PCB Piezotronics, Inc. This manual is copyrighted, with all rights reserved. The manual may not be copied in whole or in part for any use without prior written consent of PCB Piezotronics, Inc. Trademarks in this Manual Android and the Google Play Store are trademarks of Google, LLC in the U.S.
-
Page 4: Table Of Contents
Table of Contents Module 1 Introduction to HVM200 - - - - - - - - - - - - - - - - - - - - - - - - - - - - - - - - - - - - - - - - - 1 Features Standard Contents, Optional Kits, and Accessories Module 2... -
Page 5: Module
1.2.1 Optional Kits 1.2.2 Accessories 1.1 Features The Larson Davis HVM200 Human Vibration Meter is designed for use in assessing vibration FIGURE 1-1 as perceived by human beings. The HVM200 provides the following features: • Whole body, hand-arm, and general vibration applications •... - Page 6 1.2.1 Optional Kits HVM200 is available to purchase in the following kits, which include accessories and options for your specific task: • Kit for hand/arm vibration (HVM200-HA-40F) includes: • HVM200 Human Vibration Meter • Hard Shell Case (CCS047) • Hand/Arm Vibration Arm Band (CCS048-L) •...
- Page 7 • Hard Shell Case for transport and protection of HVM200 and accessories (CCS047) • Arm Band for wearing the HVM200(CCS048-L) • Size Large / X-Large (CCS048-L) or Small / Medium (CCS048-S) Accelerometers: • Accelerometer for ADP063 palm adapter (SEN026) FIGURE 1-2 •...
-
Page 8: Module
Getting Started Chapter 2 This module provides instructions for setting up and configuring HVM200 meters for use with the LD Atlas app and G4 LD Utility. In this module: Charging and Power - - - - - - - - - - - - - - - - - - - - - - - - - - - - - - - - - - - - - - - - - - - - - - - - - - - - - -4 2.1.1 Charging the HVM200 2.1.2... - Page 9 Lower the other end of the battery into the tray. Make sure the battery contacts are fully seated against the power TAKE NOTE contacts in the meter and that the battery lies flat in the tray. FIGURE 2-2 Insert Battery Step 3.
-
Page 10: Installing The Ld Atlas App
Table 2.1 HVM200 Power Button Functionality Press Action Result Power on Press and hold for 1 The Power LED is blue. second Start Measurement When powered on, The Status LED is green. The green LED will press once periodically blink. Stop Measurement Press when The Status LED is red to indicate that the... -
Page 11: Installing The G4 Ld Utility
2.3 Installing the G4 LD Utility The G4 LD Utility software (G4) enhances the features, flexibility, and ease-of-use of Larson Davis instruments. It provides the following benefits: • Measurement setup workspace • Instrument calibration • Computer-based control of the instrument •... - Page 12 FIGURE 2-4 HVM200 as a WiFi Access Point Before you begin: • Verify that WiFi is enabled on your device. You may need to disconnect from your current WiFi network to select the HVM200. • For Android users on version 9+: Disable your mobile data. Step 1.
- Page 13 Step 4. Tap to select the “HVM <serial number>.” This opens the meter interface in the app. Step 5. Tap the Menu icon WiFi Settings, the Access Point IP address displays at the top of the screen under the Network heading. FIGURE 2-6 Network Settings This meter is set as an Access Point.
- Page 14 Step 2. Access the HVM200 meter view by clicking on Live View FIGURE 2-8 Live View Header with Icon Step 3. Tap the menu icon and select Setup WiFi from the Menu that opens. Step 4. Select an available network that you will connect all devices to. Networks are listed in the order of greatest signal strength.
-
Page 15: Connecting The Hvm200 To G4
2.5 Connecting the HVM200 to G4 G4 LD Utility (G4) provides features for setup, measurement, data download, and data viewing with Larson Davis products, including HVM200. In this section: 2.5.1 Connecting the HVM200 to G4 LD Utility via USB • 2.5.2 Connecting the HVM200 meter to G4 LD Utility via IP Address •... - Page 16 FIGURE 2-12 Connecting via IP Address Before you begin: • Make sure the meter connection to G4 is active. • Verify that Port Forwarding is enabled on your gateway or local router. • Locate the IP address of the gateway or router to enter into G4 as shown below. Step 1.
-
Page 17: Setting Up The Measurement
Setting Up the Measurement Chapter 3 In this module: Preparing the Sensor - - - - - - - - - - - - - - - - - - - - - - - - - - - - - - - - - - - - - - - - - - - - - - - - - - - - -13 3.1.1 Connecting Sensor Cable to the HVM200 3.1.2... - Page 18 3.1.2 Connecting Sensor Cable to the Adapter Connecting the sensor cable to the accelerometer is similar for all different types of adapters, follow the instructions in Figure 3-1. FIGURE 3-1 Connecting Sensor Cable to Accelerometer Place the accelerometer into one end of the cable, so the connector cut-out aligns with the gold cable lock.
- Page 19 Using the Palm Adapter Step 1. Feed one end of the cable (CBL216) from the bottom to the top of the palm adapter as shown in Figure 3-2. FIGURE 3-2 Cable Path for Palm Adapter Step 2. Connect the accelerometer to CBL216 as shown in Figure 3-1. Step 3.
- Page 20 Using Other Adapters This section shows how to secure the accelerometer to the following adapters: hand adapter (ADP080A), handle adapter (ADP081A), clamp adapter (ADP082A). FIGURE 3-3 Other Adapters Step 1. Connect the accelerometer to the adapter as shown in Figure 3-1. FIGURE 3-4 Adapter Placement with Accelerometer (SEN04XF) ADP080A...
- Page 21 3.1.3 Configuring the Sensor In this section, configure the sensor in G4 or LD Atlas. Step 1. If the HVM200 is not already turned on, press the power button once. The Power LED turns blue. Step 2. Connect the HVM200 to G4 or LD Atlas via the included USB cable (CBL218). Step 3.
-
Page 22: Creating The Measurement Setup File
3.2 Creating the Measurement Setup File 3.2.1 Performing a Calibration Check Before you begin: • A calibration check requires a hand-held shaker, such as the PCB Model 394C06. To view shaker options, go to www.pcb.com/Sensor-Calibration/Portable- Vibration • The Calibration check frequency will be dependent on the shaker you use. For the 394C06, it is 159.2 Hz. - Page 23 Step 7. Repeat the process for each axis on the accelerometer as shown in Figure 3-2. FIGURE 3-7 Calibration Check Z-axis values displayed in green are within standard tolerance range (± 5%). Reference value from shaker Sensitivity settings you specified in the Setup Saved calibration checks.
- Page 24 Step 1. In LD Atlas or G4, open the meter screen, tap the menu icon , then tap Settings. Step 2. Tap and hold on a default Setup File in the Settings list. In the pop-up that appears, tap Save As and enter a name for the measurement setup. FIGURE 3-8 Naming the Setup File If you return to the Setup Manager tab from a Settings page, the app...
- Page 25 sizes up to 2 GB and more than 6 hours of data. When not enabled, the card stores approximately 8000 hours of data. For more information, see 4.5 Working with RAW Data Files Weighting: For each axis, “Wh-weighting” is the default for all axes in Hand/ •...
- Page 26 Step 5. If your Setup is complete, tap Close to save it, then see 3.2.3 "Setting the Active Setup File" on page 24. You may also tap the page arrow icon continue defining the Setup. Part 4: Choosing Values On the Misc Page Select values for miscellaneous measurement settings on the Misc Page as shown in this section.
- Page 27 Step 2. If desired, customize the Display FIGURE 3-13 LD Atlas, Setup Tools Units. If you change this, also review the dB Reference level on the Misc page. Step 3. If desired, choose a new Integration option. Selecting “Single integration” calculations converts acceleration values into velocity values;...
- Page 28 3.2.3 Setting the Active Setup File Before you begin: • Customize the setup file as shown in 3.2.2 Creating a Setup File by Using Your Mobile Device. Step 1. Within the Setup Manager, navigate to the list of Setup files. To do this, tap the page arrow icon until the Setup list displays.
-
Page 29: Module
Making a Measurement Chapter 4 This module shows how to perform a vibration measurement using the HVM200, with LD Atlas app on a mobile device, and G4 LD Utility on the PC. Review sections in this module that utilize the sensor and accessories applicable to your measurement. In this module: Deploying the Sensor - - - - - - - - - - - - - - - - - - - - - - - - - - - - - - - - - - - - - - - - - - - - - - - - - - - - -25 Selecting the Sensor in G4 or LD Atlas - - - - - - - - - - - - - - - - - - - - - - - - - - - - - - - - - - - - - - - -28... - Page 30 Step 1. Attach the Arm Band (CCS048) on the person being monitored. When applied to the subject, the transparent cover should be farthest from the hand. Step 2. Insert the HVM200 into the meter pocket and thread the attached sensor cable through the bottom of the pocket.
- Page 31 4.1.4 Positioning the Handle Adapter and Accelerometer Step 1. Attach the Larson Davis hand adapter on the person being monitored. The end with the transparent cover should be farthest from the hand. FIGURE 4-4 Positioning the Handle Adapter Accelerometer Step 2. Secure the HVM200, using the arm band or other similar method, so that it stays near the hand in a place where it won’t fall.
-
Page 32: Selecting The Sensor In G4 Or Ld Atlas
Step 1. Place the seat adapter where the person being monitored will sit. Step 2. Connect CBL217-01 to the HVM200 on one end and the seat adapter cable on the other end. Step 3. Secure the HVM200 in a secure location where it won’t fall. 4.2 Selecting the Sensor in G4 or LD Atlas Step 1. -
Page 33: Making The Measurement
accelerometer. TEDS sensitivity values override any sensitivity values you enter manually. Click or tap Add. Step 7. Select the accelerometer when it appears in the list and click or tap Select. The sensitivity values automatically appear on the Sensor page. Step 8. - Page 34 FIGURE 4-7 Run Pending Icons TRY THIS You can also start the measurement manually by pushing the Power button on the HVM200 for at least 1 second after the Status LED is red, as long as the meter is not reading TEDS data from a sensor. For more information, see 2.1.2 Overview of Buttons and Indicators FIGURE 4-8 Meter is stopped...
- Page 35 FIGURE 4-10 Viewing Live Data & Meter is stopped Live Step 2. In the Live View, the LD Atlas app and G4 display current measurement information in Overall, Summation, X-axis, Y-axis, and Z-axis pages. Click the right arrow or left arrow icons to navigate pages. Click the Zoom button to enlarge the displayed data.
- Page 36 FIGURE 4-12 Summation Data Display Vibration values according to specified units Measurement Time Current a value PEAK Overall measurement data TAKE NOTE For more information on summation values, including Vibration Dose Value (VDV) and the Daily Vibration Exposure Value Over 8 hours, A(8), see the “Glossary of Terms”...
- Page 37 In G4 or LD Atlas, the Overload icon displays as shown in Figure 4-14. FIGURE 4-14 Overload Indicators Indicates an overload has occurred on one or more axes in the current measurement Red background shows the overload values for each axis Under-Range Indicator An under-range condition occurs when the signal from the accelerometer is below the input range to the point it cannot be measured accurately.
-
Page 38: Downloading Hvm200 Data
4.4 Downloading HVM200 Data You can view and interpret the resulting data by using any of the following actions: • Download and view HVM2 files in G4 LD Utility G4 LD Utility provides graphing, analysis, and report functionality to provide ease of data interpretation. - Page 39 FIGURE 4-17 Raw Data File Be aware that RAW format files always require much more storage space than HVM2 files. 4.5.1 Using the Raw Data Script You will need MATLAB, GNU Octave, or similar program to work with RAW format files after downloading.
- Page 40 y_axis = A(2:3:end); z_axis = A(3:3:end); %% Remove DC bias from data (optional) x_axis x_axis - mean(x_axis); y_axis y_axis - mean(y_axis); z_axis z_axis - mean(z_axis); %% Plot figure(1); plot(x_axis,'-b'); hold plot(y_axis, '-r'); plot(z_axis, '-k'); hold off; legend('x','y','z'); title('HVM200 Data'); save(rawsavename,'x_axis','y_axis','z_axis','Sample_Rate','Sample_Time'); %% Further processing through ISO 8041 Wk filter x_axis_filt = isofilwk(x_axis, Sample_Rate);...
- Page 41 isofilwk() Sample Code (ISO 8041 standard) function y isofilwk(x, fs) % ISOFILWK % Filter ISO 8041 Wk y = isofilwk(x,fs) y output signal, acceleration x input signal, acceleration fs sampling frequency Hz bilinear transformation algorithm is used = 0.4; = 100; = 12.5;...
- Page 42 [1/w6/w6 1/Q6/w6 [b4,a4] bilinear (B4, A4, fs); % Apply filter to input signal vector x (output to signal vector y) filter (b2, a2, x); % Apply low-pass band limiting filter (b1, a1, y); % Apply high-pass band limiting filter (b3, a3, y); % Apply a-v transition filter (b4, a4, y);...
- Page 43 Table 4.2 Parameters and transfer functions of the frequency weightings (source: ISO 8041) Band-limiting a-v-transition Upward step Gain 0.55 0.95 1.024 0.63 ∞ ∞ 0.63 ∞ ∞ 0.63 ∞ ∞ 0.08 0.63 ∞ 0.25 0.86 0.0625 0.80 0.10 0.80 ∞ ∞...
-
Page 44: Module
Settings and Features Reference Chapter 5 This module provides instructions for setting and disabling features, upgrading the HVM200, and troubleshooting when necessary. In this module: Setting/Syncing Meter Time and Date - - - - - - - - - - - - - - - - - - - - - - - - - - - - - - - - - - - - - - - -40 Enabling/Disabling the HVM200 WiFi Signal - - - - - - - - - - - - - - - - - - - - - - - - - - - - - - - - - - -42 Upgrading Firmware or Options - - - - - - - - - - - - - - - - - - - - - - - - - - - - - - - - - - - - - - - - - - - -43 Troubleshooting HVM200 External Memory - - - - - - - - - - - - - - - - - - - - - - - - - - - - - - - - - - -44... - Page 45 FIGURE 5-1 Date and Time Setting the Meter Time Manually in G4 If desired, complete these steps in G4 instead of automatic time sync. Step 1. Click in the Time field and enter the time. Step 2. Click in the Date field and enter the date. Step 3.
-
Page 46: Enabling/Disabling The Hvm200 Wifi Signal
Step 2. In the Setup Manager, tap the Setup menu , and choose the Time page. FIGURE 5-3 HVM200 Settings, Time Page Step 3. Tap Sync Time to sync the time on the meter with the time on your mobile device. -
Page 47: Upgrading Firmware Or Options
Step 1. In G4, go to the Setup WiFi page. Step 2. Click the red power icon in the top left. Step 3. G4 displays a WiFi Alert. Click Confirm to continue. Step 4. Select the Reboot button, then click Confirm in the pop-up window to continue. -
Page 48: Troubleshooting Hvm200 External Memory
Step 4. Click Choose Firmware File or Choose Options File. FIGURE 5-5 Upgrade Firmware or Options Step 5. In the File Explorer window that opens, open the available firmware or options file. Step 6. In the G4 Upgrade window, choose Upload Firmware or Upload Options. G4 will show an upgrade progress overlaid on the meter panel, and once completed will display a success message. -
Page 49: Appendix A Specifications
Appendix A Specifications The following specifications are subject to change without notice. A.1 General Characteristics Measurement modes Effects of Temperature and Humidity • Hand-arm, Whole-body, Vibration • Operating temperature: 14°F to 122°F (-10 °C to 50 °C) • The RMS level of the HVM200 varies up to 1% Measurement Units when exposed to temperatures of - 10 °C to 50 •... - Page 50 Effects of Mechanical Vibrations • Complete instrument RMS level varies up to 0.4% when exposed to mechanical vibrations of 30 m/s at 79.58 Hz (worst-case orientation). Data Flow Characteristics Data flow is characterized by the chart shown in . AC Power and Radio Frequency Susceptibility FIGURE A-1 Data Flow Block Diagram...
- Page 51 A.2 Physical Characteristics Dimensions/Weight • Length: 4.6 inches (11.8 cm) • Width: 2.6 inches (6.7 cm) • Depth: 0.7 inches (1.8 cm) • Weight: 4.6 ounces (130 grams) - including battery • Ingress Protection Rating: IP42 Communication Interface • USB 2.0 Hi-Speed •...
- Page 52 TABLE A.2 HVM200 Power LED (Left) Indications Indication State Additional Information Click the Warning Icon on the G4 LD Utility Live View. The “About This Meter” information shows if there is a sensor/cable connection error, battery connection error, or SD memory card error. To avoid system errors, do not hot swap SD memory cards.
- Page 53 TABLE A.4 Power Button Functions Power Button Functions Action Press Power Button Turn on power At least one second until Power LED is blue Turn off power Until Power and Status LEDs are blue. Meter will power off after a few seconds Start or stop toggle for manual measurement After turning on meter, less than three seconds Shut down (if unresponsive)
- Page 54 Absolute voltage range (min to max): 0 to 28 V • Bandwidth: 0.4 Hz to 3000 Hz • Range: Single range • Sample rate: 7161.45833 Hz • Maximum recommended cable length: 5 ft 1. ICP is a registered trademark of PCB Piezotronics, Inc. HVM200 Reference Manual...
- Page 55 FIGURE A-4 Pinout Signal X Axis Y Axis Z Axis Anti-alias Filter Performance The anti-alias filter attenuates all frequencies above the stop band frequency at 100 dB. Sample Rate: 7161.45833 Hz Stop Band Frequency: 3917.318 Hz Stop Band Rejection: 100 dB Pass Band -3db Frequency: 3509.115 Pass Band Frequency: 3244.141 HVM200 Reference Manual...
- Page 56 A.5 Reference Values The following values represent the primary frequencies and amplitudes at which weighting filters are specified and tested. TABLE A.5 Operating Mode Reference Values Operating Reference Frequency Weighting Reference Frequency Mode Amplitude Vibration Fa (0.4 Hz to 100 Hz) 50 rad/s (7.958 Hz) 10 m/s Fb (0.4 Hz to 1250 Hz)
- Page 57 Lower Limit Lower Limit Lower Limit Linearity Frequency Noise Floor Linearity Upper Limit (Under-range Range Weighting (typical mV) Range (Overload V) (maximum (typical mV) 0.018 0.144 0.073 0.121 5.01 0.017 0.103 0.060 0.077 5.01 A.7 Frequency Weighting Curves The following graphs show frequency weighting curves for the HVM200. Choosing the appropriate weighting for your measurement is vital to achieve the most accurate results.
- Page 58 FIGURE A-6 FIGURE A-7 HVM200 Reference Manual A-10...
- Page 59 FIGURE A-8 FIGURE A-9 HVM200 Reference Manual A-11...
- Page 60 FIGURE A-10 FIGURE A-11 HVM200 Reference Manual A-12...
- Page 61 FIGURE A-12 FIGURE A-13 HVM200 Reference Manual A-13...
- Page 62 FIGURE A-14 FIGURE A-15 HVM200 Reference Manual A-14...
- Page 63 FIGURE A-16 A.8 Frequency Weighting Tables The following tables show frequency weighting values for the HVM200. TABLE A.7 Fa (Flat 0.4 Hz to 100 Hz) Freq (Hz) Fa Ideal (dB) Fa Typical (dB) Tolerance (dB) - 0.1000 -24.10 -25.19 - 0.1259 -20.12 -21.21...
- Page 64 Freq (Hz) Fa Ideal (dB) Fa Typical (dB) Tolerance (dB) 3.981 0.00 -0.02 +1/-1 5.012 0.00 -0.03 +1/-1 6.310 0.00 -0.04 +1/-1 7.943 0.00 0.00 10.00 0.00 -0.01 +1/-1 12.59 0.00 0.00 +1/-1 15.85 0.00 0.02 +1/-1 19.95 -0.01 -0.02 +1/-1 25.12 -0.02...
- Page 65 Fb Typical Tolerance Freq (Hz) Fb Ideal (dB) (dB) (dB) 1.585 -0.02 -0.04 +1 / -1 1.995 -0.01 -0.04 +1 / -1 2.512 0.00 -0.04 +1 / -1 3.162 0.00 -0.07 +1 / -1 3.981 0.00 -0.05 +1 / -1 5.012 0.00 -0.05...
- Page 66 TABLE A.9 Fc (Flat 6.3 Hz to 1260 Hz), Wh, and Wf Frequency Weighting. Freq Fc Ideal Fc Typ Wh Ideal Wh Typ Tolerance Wf Ideal Wf Typ Tolerance ( Hz) (dB) (dB) (dB) (dB) (dB) (dB) (dB) (dB) 0.7943 -36.06 -36.10 +2 / -...
- Page 67 Freq Fc Ideal Fc Typ Wh Ideal Wh Typ Tolerance Wf Ideal Wf Typ Tolerance ( Hz) (dB) (dB) (dB) (dB) (dB) (dB) (dB) (dB) 1585 -5.46 -6.86 -45.42 -46.21 +2 / -2 1995 -8.64 -12.55 -50.6 -54.40 +2 / - 2512 -12.27 -21.30...
- Page 68 Freq Wm Ideal WmTyp Wc Typ Wd Ideal Wd Typ Tolerance Wc Ideal (dB) ( Hz) (dB) (dB) (dB) (dB) (dB) (dB) 19.95 -11.25 -11.30 -7.75 -7.81 -19.97 -20.02 +1 / -1 25.12 -13.14 -13.19 -9.80 -9.85 -21.98 -22.04 +1 / -1 31.62 -15.09 -15.12...
- Page 69 Freq We Ideal We Typ Wj Ideal Wj Typ Wk Ideal Wk Typ Tolerance dB ( Hz) (dB) (dB) (dB) (dB) (dB) (dB) 5.012 -13.93 -13.98 -1.99 -2.04 +0.33 0.28 +1 / -1 6.310 -15.95 -16.00 -0.47 -0.51 +0.46 0.42 +1 / -1 7.943 -17.97...
- Page 70 0.0108 1434.733 0.0102 804.139 0.0802 5740.123 0.1707 8823.712 0.0003 87.044 0.0002 3.235 0.0080 695.458 0.0077 397.953 0.0083 698.669 0.0067 400.711 0.0049 698.620 0.0034 204.094 For the following charts, the valid measurement range for each weighting is shown between the noise floor and the maximum.
- Page 71 FIGURE A-18 FIGURE A-19 HVM200 Reference Manual A-23...
- Page 72 FIGURE A-20 FIGURE A-21 HVM200 Reference Manual A-24...
- Page 73 FIGURE A-22 FIGURE A-23 HVM200 Reference Manual A-25...
- Page 74 FIGURE A-24 FIGURE A-25 HVM200 Reference Manual A-26...
- Page 75 FIGURE A-26 FIGURE A-27 HVM200 Reference Manual A-27...
- Page 76 FIGURE A-28 A.10 1/1 & 1/3 Octave Band Filters Octave Band Analysis (OBA) is an optional feature for the HVM200. OBA Compliance • IEC 61260-1:2014 Class 1 • ANSI S1.11-2014 Part 1, Class 1 OBA General Specifications • 1/1 Octave Filters: 0.5 Hz to 2000 Hz •...
- Page 77 0.0143 0.14 5.01 0.01415 0.13 5.01 0.01405 0.13 5.01 31.5 0.01408 0.09 5.01 0.0149 0.085 5.01 0.0171 0.08 5.01 0.0205 0.07 5.01 0.02417 0.08 5.01 1000 0.02973 0.08 5.01 2000 0.0385 0.14 5.01 FIGURE A-29 1/1 Octave Filter Response Summary Graph HVM200 Reference Manual A-29...
- Page 78 FIGURE A-30 1/1 OBA 8.0 Hz Filter Response FIGURE A-31 1/1 OBA 8.0 Hz Filter Response: Pass-band HVM200 Reference Manual A-30...
- Page 79 FIGURE A-32 1/1 OBA 16.0 Hz Filter Response FIGURE A-33 1/1 OBA 16.0 Hz Filter Response: Pass-band HVM200 Reference Manual A-31...
- Page 80 TABLE A.14 1/3 OBA Filter Responses Maximum Lower Limit Frequency (Hz) Overload (V) Noise Floor (mV) Linearity (mV) 0.022 0.13 5.01 0.02 0.13 5.01 0.63 0.018 0.14 5.01 0.017 0.15 5.01 0.0155 0.18 5.01 1.25 0.0148 0.21 5.01 0.0144 0.17 5.01 0.01435 0.14...
- Page 81 FIGURE A-34 1/3 Octave Filter Summary Graph FIGURE A-35 1/3 OBA 0.4 Hz Filter Response HVM200 Reference Manual A-33...
- Page 82 FIGURE A-36 1/3 OBA 0.4 Hz Filter Response: Pass-band FIGURE A-37 1/3 OBA 8.0 Hz Filter Response HVM200 Reference Manual A-34...
- Page 83 FIGURE A-38 1/3 OBA 8.0 Hz Filter Response: Pass-band FIGURE A-39 1/3 OBA 16.0 Hz Center Band Filter Response HVM200 Reference Manual A-35...
- Page 84 FIGURE A-40 1/3 OBA 16.0 Hz Filter Response: Pass-band FIGURE A-41 1/3 OBA 80.0 Hz Filter Response HVM200 Reference Manual A-36...
- Page 85 1/3 OBA 80.0 Hz Passband Filter Response A.11 Standards For Human Vibration Measurements The Larson Davis HVM200 Human Vibration Meter is a instrument designed for use in assessing vibration as perceived by human beings. The instrument measurement filters meet the requirements of ISO 8041-1:2017 and ISO 8041-2:2021.
-
Page 86: Appendix B Adapter Resonance And Frequency Response Test
Appendix B Adapter Resonance and Frequency Response Test Experimental measurements indicate no resonances within the “Wh” frequency range for the adapters ADP080A, ADP081A and ADP082A as shown in the following sections. Using these adapters does not affect the performance specifications outside of the meter specifications in Appendix A. - Page 87 B.1.1 ADP080A + SEN041 Mounting, Placement, and Result FIGURE B-1 Hand Adapter (ADP080A) and Accelerometer (SEN041) Mounting Specification ADP080A Total Mass of Vibration Sensor & Mounting 0.67 oz System (including sensor, adapter, & (19 grams) mounting screw) Mounting Height of Vibration Sensor 0.32 oz (distance between sensor and mounting (8.0 grams)
- Page 88 B.1.2 ADP081A + SEN041 Mounting, Placement, and Result FIGURE B-4 Handle Adapter and Accelerometer Mounting Specification ADP081A Total Mass of Vibration Sensor & Mounting 0.74 oz System (including sensor, adapter, & (21 grams) mounting screw) Mounting Height of Vibration Sensor 0.18 oz (distance between sensor and mounting (4.6 grams)
- Page 89 B.1.3 ADP082A + SEN041 Mounting, Placement, and Result FIGURE B-7 Clamp Adapter and Accelerometer Placement Specification ADP081A Total Mass of Vibration Sensor & Mounting 0.35 oz System (including sensor, adapter, & (10 grams) mounting screw) Mounting Height of Vibration Sensor 0.32 oz (distance between sensor and mounting (8.1 grams)
-
Page 90: Appendix C Glossary Of Terms
Appendix C Glossary of Terms The following table contains definitions and calculations for terminology used in the HVM200 manual. Term Equation Description -- - a t t RMS Acceleration T= Integration time in seconds. (t) = instantaneous acceleration. t = Time, in seconds. - Page 91 Term Equation Description Exposure Points k = the multiplying sum factor for the individual axis. = the vibration magnitude in m/s T= the exposure time in hours. = the exposure action value The summation measurement exposure points are the maximum of the three axes exposure points. -- - Arms t ...
- Page 92 Term Equation Description Amin = minimum reading of all Arms readings from Run to Reset. The display is updated at the end Minimum Transient of each Averaging time period. Vibration Value The vector sum is continuously compared to previous values for MIN, and Amin. Then, the lowest (MIN) value in the current averaging time period is selected for Amin.
-
Page 93: Appendix D Regulatory Compliance
Appendix D Regulatory Compliance The HVM200 contains a ATWILC1000-MR110PB module that has regulatory approval for the following countries: – United States/FCC ID: ZOC-LDHVM200B – Taiwan/NCC: CCAN18LP0310T7 – Canada/ISED: IC: 9732A-LDHVM200B – Europe/CE 根據 NCC LP0002 低功率射頻器材技術規範 _ 章節 3.8.2: – Japan/MIC: 005-101763 取得審驗證明之低功率射頻器材,非經核准,公司、商號或使... - Page 94 47 CFR 15.505- FCC Class B NOTE: This equipment has been tested and found to comply with the limits for a Class B digital device, pursuant to part 15 of the FCC Rules. These limits are designed to provide reasonable protection against harmful interference in a residential installation.
- Page 95 Larson Davis - a PCB Piezotronics division www.LarsonDavis.com IHVM200.01, Rev K Supporting firmware version 5.0.0 ©2024 PCB Piezotronics, Inc. Contact Larson Davis Toll-free (in the US): 888-258-3222 Worldwide Corporate Headquarters Phone: 716-926-8243 3425 Walden Avenue USA fax: 716-926-8215 Depew, NY 14043-2495 USA E-mail: sales@larsondavis.com...
Need help?
Do you have a question about the LARSON DAVIS HVM200 and is the answer not in the manual?
Questions and answers