Table of Contents
Advertisement
Quick Links
Advertisement
Table of Contents

Related Manuals for profometer PM8500


Summary of Contents for profometer PM8500
- Page 1 PM8500 Quick Reference...
-
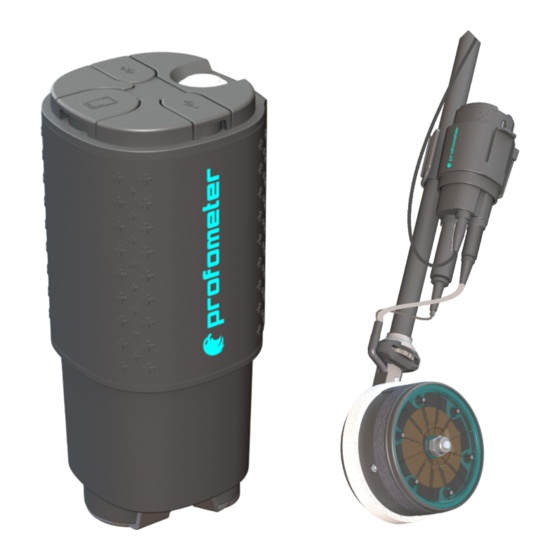
Page 2: Keys - Overview
Keys - Overview BT dongle USB-C Battery Top Button Port Device ON/OFF Medium push Power ON (3s) Medium push Power OFF (3s) Taking out the Reboot device Battery Potential cable (all Ground cable electrodes) connector Encoder cable (wheel electrodes) -
Page 3: Led - Behaviour
LED - Behaviour port LED behaviour Battery Status – While Green: single quick blink: >20% turning on the device Red: single quick blink: <20% Turn on, awaiting Bluettoh Green Solid connection Connected. Review Mode Blue Solid • Paused • Stopped While measuring Blue Blinking (rod/wheels) -
Page 4: Measurement Principle
Measurement Principle Half Cell Potential Under normal conditions reinforcement steel is protected from corrosion by a thin, passive film of hydrated iron oxide This passive film is decomposed due to the reaction of the concrete with atmospheric carbon dioxide (CO2, carbonatation), or by the penetration of substances aggressive to steel, in particular chlorides. - Page 5 Typical Reference Values Half Cell Potential Typical orders of magnitude (for information only) for the half-cell potential of steel in concrete measured against a Cu/CuSO4 reference electrode are in the following range (RILEM TC 154-EMC) RILEM TC 154-EMC Water saturated concrete -1000 to -900 mV without O2 Moist, chloride contaminated...
-
Page 6: External Factors
External Factors Half Cell Potential Moisture Cover Electrical resistivity Moisture has a large effect on the The potential becomes more positive Low electrical resistivity leads to measured potential leading with increasing concrete cover. more negative potentials and the to more negative values Very low concrete cover can lead potential gradients become flatter –... -
Page 7: Preliminary Operations
Preliminary operations Prepare the Rod Electrode: Remove the cap with the wooden plug and soak it into water for about an hour to allow the wood to saturate and swell. electrodes Wheel Electrode: The wooden plug is not intended to be removed. Immerse the wheel in water for an hour to allow the water to soak into the plug. - Page 8 Preliminary operations Coated surfaces It is not possible to make a measurement through an electrically isolating coating (e.g. an epoxy resin coating, sealing sheets or asphalt layers.) It is possible to make a measurement through thin dispersion coatings, however this can cause a small shift of the potentials.
-
Page 9: Maintenance And Cleaning
Maintenance and Cleaning To guarantee consistent, reliable and accurate measurements, the instrument should be calibrated on a yearly basis. The customer may, however, determine the service interval based on his or her own experience and usage. Do not immerse the instrument in water or other fluids. Keep the housing clean at all times. - Page 10 Settings File Name Live Potential Expand Grid Settings Panel Start / Stop Limits measurement Logbook Measuring Mode: Basic / Advanced Change Threshold Color Palette Standard: ASTM, Custom – Only for Basic Mode Potential Probe Type: View Color Rod, one wheel, Range four wheel Half Cell Solution:...
- Page 11 Settings Live Potential Expand Grid File Name Settings Panel Start / Stop Limits measurement Logbook Change Concrete Color Palette Temperature Auto potential Shift: If yes, it Potential assigns the drift View Color associated to the temperature. If not, it Range assign the manual value Auto Save Delay:...
- Page 12 Potential Map The potential map provides an area mapping of the measured potential values The cells where no potential value was measured are displayed in black Zoom and scroll to any desired location, change the color palette potential thresholds enhance the readability and highlight the desired details.
-
Page 13: Statistic View
Statistic View Distribution cumulative distribution are shown in the same view. horizontal axis, potential values are displayed; vertical bars show percentage of the respective potential values measured and stored. In the upper part, the median, standard deviation, minimum and maximum values are shown, together with the number of measurements. - Page 14 Statistic View The cumulative distribution graph is used to determine the active and the passive potential thresholds that will affect Chipping Graph, discriminating actively corroding areas from passive areas where no corrosion is to be expected. If the surface under test has both actively corroding as well as passive rebars, then the curve will typically exhibit a central region with a lower...
-
Page 15: Chipping Graph
Chipping Graph The Chipping Graph View provides an area mapping measured potential values with fixed green/yellow/red color palette referring to the thresholds set in the Cumulative Distribution View. immediate overview then provided discriminating the actively corroding areas (red) from passive areas (green) uncertain regions (yellow). -
Page 16: Basic Mode
Basic Mode The Basic Mode shows directly the Chipping Graph at the same time as the measurement is done. For that purpose, the threshold limits have to be preset: Manually Selecting the ones included in the ASTM C876-09, Appendix X1, assigning a 90% probability of corrosion ongoing to the areas more negative than -350 mV, and a 90% probability of no corrosion to the areas more positive than -200 mV. -
Page 17: Advanced Mode
Advanced Mode The Advanced Mode is recommended for expert users that want to create their own threshold limits based on the total measured values. The process is the following: Potential map Statistic View Setting the threshold limits Chipping Graph... - Page 19 For more information on the product use of the product, please refer to the Profometer PM8500 documentation It is available for download on www.screeningeagle.com/en/products/profometer-pm8500 For safety and liability information, please download at https://www.screeningeagle.com/en/about-us/gtc-and-certificates Subject to change. Copyright © 2023 by Proceq SA, Schwerzenbach. All rights reserved.
- Page 20 ASIA-PACIFIC EUROPE USA, CANADA & CENTRAL AMERICA Proceq Asia Pte Ltd. Proceq AG Screening Eagle USA Inc. 1 Fusionopolis Way Ringstrasse 2 14205 N Mopac Expressway Suite 533 Connexis South Tower #20-02 8603 Schwerzenbach Austin, TX 78728 | United States Singapore 138632 Zurich | Switzerland T +65 6382 3966...
Need help?
Do you have a question about the PM8500 and is the answer not in the manual?
Questions and answers