Table of Contents
Advertisement
Quick Links
Advertisement
Table of Contents

Related Manuals for SEF Mesy 3.0

Summary of Contents for SEF Mesy 3.0
- Page 1 Operation Manuell Temperature measurement system 570.70 Mesy 3.0 Year of manufacturing: Manufactureer: SEF Eltronic GmbH Kringelsburg D-21379 Scharnebeck Seriennummer: Telefon: 0049 (0)4136-909-0 Telefax: 0049 (0)4136-909-11 Please keep this manual for later disposal...
- Page 2 © SEF Eltronic GmbH, USB-Mesy Version 3.0 (Juni 2003) ® Subject to technical change.
-
Page 3: Table Of Contents
Table of contents Chapter 1 preface Introduction…………………………………………….……..1.1 Intended operation……...…..……………………………...…..1.2 Rights of use…………..……………………………………..…..1.3 About this manual………..……………………………...………...1.5 Special hints and conventions……..…………………...……..…1.7 Technical data…………………..………………………..……….1.8 Chapter 2 safety instructions General safety instructions ………..……………..…...…………2.1 Important instructions ………..………………………...…………2.2 This you should now for operating the measurement system..2.3 Disposal advices…………………………………..……...…...…..2.4 Chapter 3 installation Functional description……………...………..………..………….3.1... - Page 4 Table of contents Chapter 5 Measurement assembly and measurement Preparing the PCB……………………………………….……….5.1 Configuration for the measurement analysis…………….…….5.3 Starting the measurement…………………...…………………..5.5 Saving a graph…………………………………….……………...5.7 Stopping the measurement………………..…………………..5.7 Chapter 6 Measurement analysis The display supports……………..………………………………6.1 The measurement graph…………………..…………………….6.3 The reference graph…………………...…………………………6.5 Time and temperature values……………….…………………..6.7 Stretching and compressing the time axis………..…………...6.9 Stretching and compressing the temperature axis………..6.13 Chapter 7 Notes...
-
Page 5: Chapter 1 Preface
1.0 Preface Introduction Dear customer, this operation manual is made for the authorized user. Basic knowledge and the handling of a personal computer and its operation system is presumed. Please take care for the instructions about the hardware and software installation in this manual. Thereby you prevent damage at the hardware and software. -
Page 6: Intended Operation
1.0 Preface Intended operation The MESY 3.0 is designed for a measurement of temperatures from 0°C – 400°C. Damages due to higher temperatures are accounted to the operator. Please take care for: An intended or proper use also contains the com- pliance of the installation, operation and disposal instructions.. -
Page 7: Rights Of Use
1.0 Preface Rights of use The SEF Eltronic GmbH allows the customer the not exclusive and not negotiable use of the delivered harware and software (further named „product“) subject to the following regualations: Subject of the The rights of use authorises the customer to use contract the product and the necessary documentation. - Page 8 The general terms and conditions of the SEF Assignment of Eltronic GmbH are valid. These rights of use the rights off use succumb the right of the Federal Republic of Ger- many.
-
Page 9: About This Manual
About this manual This operation manual shall explain the handling of the measurement system and shall help you with the work with the MESY 3.0. Therefore we divided this manual in different chapters. Chapter 1, preface In this chapter you get knowledge about the intended use and the rights of use. -
Page 10: Special Hints And Conventions
1.0 Preface Special hints and conventions For an easier reading and consulting in this manual we marked some parts of the text. Marks descriptions, advices for a better handling of the system or cross references corresponding with other text passages. Aufzählungen mit vorausgehender Raute sind allgemeine Aufzählungen. - Page 11 1.0 Preface Technische Daten Size of the measurement box (lxwxh): 120 x70 x 23 mm Weight of the measurement box: 180 g Voltage supply: via USB-connector Data transfer: via USB-connector Operation temperature: 0°C – 50°C Number of temperature sensors: Type of temperature sensors: thermocouple type K Measurement- (temperature-) range: 0°C –...
- Page 12 1.0 Preface Site 1.8...
-
Page 13: General Safety Instructions
2.0 Safety instruction General safety instructions This measurement system is manufactured state of the art. Anyway the system can cause danger if it is not used in compliance with the instructions. The operation manual serves for an intended and safety work with the measurement system. - Page 14 2.0 Safety instructions Wichtige Hinweise Owner is every individual and legal person who has Owner bought the measurement system. Operator Operator is every individual and legal person who uses the measurement system gives the order to use it. Only competent, qualified and briefed persons are Competent and allowed to operate the measurement system.
-
Page 15: This You Should Now For Operating The Measurement System
2.0 Safety instruction This you should now for operating the measurement system Only assigned and instructed persons are allowed to use General safety measurement system. The state of health of these instructions persons must be okay so that they are in a position to operate the system and these persons must not come under the influence of pharmaceuticals which reduce the reaction time. -
Page 16: Disposal Advices
2.0 Safety instructions Disposal advices The system contains materials which can cause danger to the environment when disposed. The operator is obliged that these materials will be disposed conform to the law. For Germany is valid: It is mentioned in the federal law how to dispose these materials. -
Page 17: Chapter 3 Installation
3.0 Installation Functionel description The measurement system 570.70 was especially designed Intended for the use at wave and reflow soldering systems. The application measurement recording is taking place with a PC in an Excel form. The measurement values are transferred from Assembly the system to the PC. - Page 18 3.0 Installation Functionel description Measurement With the measurement system software the recorded data data can be displayed, analysed, organized and printed. For the display of the measurement data in a graph, the temperature and the time axis be adjusted, grid and measurement graph symbols can be faded in and out.
-
Page 19: Scope Of Delivery
3.0 Installation Lieferumfang The measurement system will be shipped in a special packing by post or another forwarder. What was You have received a measurement system 570.70 including delivered? the standard scope of delivery: Measurement box 570.70 Thermocouple sensors type K, length 2,5 m USB cable, length 3,0 m Installation CD-ROM Quick reference guide... -
Page 20: Software Installation
Open the file “Setup.exe” on the CD-ROM. Follow the instructions which appear on the screen. If necessary it is possible to create a new path. The software of the MESY 3.0 is installed on your PC after the installation procedure is fin- ished. Site 3.4... - Page 21 3.0 Installation Software installation For a better distinction of the separate measurement Creating graphs it may be helpful to create order or PCB specific subdirectories subdirectories. For this work you should also read the help instructions of Microsoft Excel 2000. For storing the measurement graphs you should make a back up from time to time.
-
Page 22: Hardware Installation
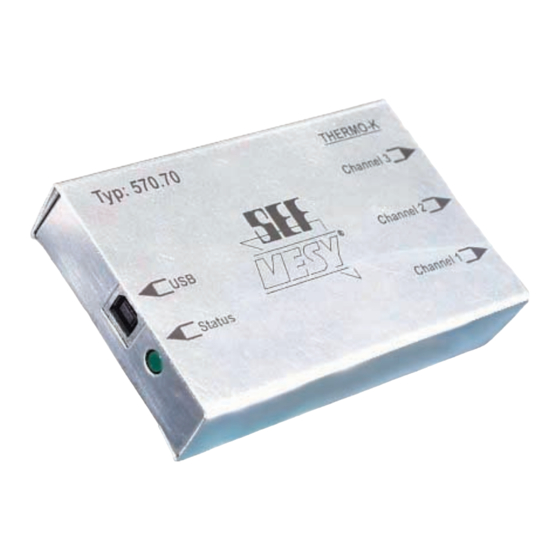
3.0 Installation Hardware installation Connectors and Frontview indication USB socket status LED Rear view measurement socket 1 - 3 At the front side of the measurement box you will find all Front side connection and indication elements. USB socket: Here you must connect the includ- ed USB cable. - Page 23 Take care for the coding of the plugs. Connect the included USB cable with the MESY 3.0 and with a free USB port at your The new USB device will be detected and the required driver will be installed automatically.
- Page 24 3.0 Installation Site 3.8...
-
Page 25: Chapter 4 System Configuration
MESY 3.0 was connected correctly with the measurement form. Confirm this information with >OK<. The LED will blink 5 times to confirm the procedure and then will flash all the time. Your MESY 3.0 is now ready for measurement. Site 4.1... - Page 26 4.0 System configuration Site 4.2...
-
Page 27: General Layout Of The Measurement Forms
4.0 System configuration General layout of the measurement forms Layout of the After the program was started, the main window will be measurement form shown on the screen. For a better view the measurement form was divided into 4 sheets. To shift between the sheets use the register switches at the left bottom side. - Page 28 4.0 System configuration Site 4.4...
- Page 29 4.0 System configuration The configuration form In the table the following information can be displayed Overview respectively can be chosen: configuration Used name (1) Check (2) Channel no. (3) Available (4) Measurable (5) Use channel (6) Initialize (7) Interval (8) Duration (9) Duration in seconds (10) In diagram shown time window (11)
- Page 30 4.0 System configuration Menüstrukturen Site 4.6...
-
Page 31: The Configuration Sheet
Channel no. Channel no. (3) Here you can see the channel numbers of your MESY 3.0. Actually only the channels 1-3 and channel 8 are available. Channel 5-7 are reserved for a later extension. Channel 8shows the values of an internal sensor which measures the temperature inside the measurement box. - Page 32 4.0 System configuration 10 9 Site 4.8...
- Page 33 Initialize (11) Initialize With this button you can initialize your MESY 3.0 again. This is maybe necessary if the screen saver has started in the meantime or any error messages have appeared. A successful initialisation will be confirmed by the message “Download OK”and the...
- Page 34 4.0 System configuration 10 16 Site 4.10...
- Page 35 4.0 System configuration Das Konfigurationsformular In diagram shown time window (11) In diagram shown Here you can enter the time window in seconds in time window which the measurement will be shown on the diagram sheet. Automatically Automatically analyze graphic for soldering pro- analyze graphic files after measurement (12) for soldering...
- Page 36 4.0 System configuration Site 4.12...
-
Page 37: The Diagram Sheet
4.0 System configuration The diagram sheet In the diagram sheet the graphic display of the measurement Overview diagram analysis takes place. The temperature profile is shown as a sheet coloured graph. The colour of this graph can be changed to any in Excel available colour. - Page 38 4.0 System configuration Site 4.14...
- Page 39 4.0 System configuration The diagram sheet In the table the following information will be shown respectively can be chosen. Channel name Channel name (1) Display of the channel name referring to the entry in the field “Used name” on the configuration sheet. Channel colour (2) Channel colour Colour display of each channel.
- Page 40 4.0 System configuration Site 4.16...
- Page 41 4.0 System configuration The diagram sheet Peak temperature (7) Peak temperature Display of the maximum peak temperature and of the duration between the beginning of the measurement and the reach of the peak temperature. Max. slope Max. slope (8) Display of the maximum temperature slope during the soldering Start process.
- Page 42 4.0 System configuration Site 4.18...
-
Page 43: The Value Sheet
4.0 System configuration The value sheet On the value sheet the numeric diplay of the measurement Overview value values takes place. In the table the following information will sheet be diplayed respectively can be chosen. Channel name (1) Time (2) Clear list (3) Save graph (4) Start (5) - Page 44 4.0 System configuration Site 4.20...
- Page 45 4.0 System configuration The value sheet In the table the following information will be diplayed respectively can be chosen. Channel Channel name (1) Display of the channel name referring to the entry which was made on the configuration sheet. It is possible to edit the name.
- Page 46 4.0 System configuration Site 4.22...
- Page 47 4.0 System configuration The value sheet Save graph Save graph This button allows to save a graph for a later use as a reference graph. The save menu can be also called up by pressing the right mouse button on the channel name.
- Page 48 4.0 System configuration Site 4.24...
- Page 49 Confirm the message with >OK<. The values of the saved channel are now available for loading as a reference graph in the reference sheet. Start (5) Start With this button you can start and stop the measurement of the MESY 3.0 Site 4.25...
- Page 50 4.0 System configuration Site 4.26...
-
Page 51: The Reference Sheet
4.0 System configuration The reference sheet On the reference sheet the reference values will be displayed Overview in numeric form. In the table the following information is shown reference sheet respectively can be chosen. Time (1) Temperature (2) Reference± (3) Reference + (4) Reference –... - Page 52 4.0 System configuration Site 4.28...
- Page 53 4.0 System configuration The reference sheet In the table the following information will be shown respectively can be chosen. Time Time (1) Listing of the measurement intervals Temperature Temperature (2) Listing of the temperature values of the loaded reference graph. These values can be edited manually for an optimized profil.
- Page 54 4.0 System configuration Site 4.30...
- Page 55 4.0 System configuration The reference sheet Load reference Loaf reference With the button >Load reference< it is possible to load a previous saved graph as a reference graph. Press the button >Load reference< (6). The following menu will appear: Select a graph by clicking and confirm your choice with >OK<.
- Page 56 4.0 System configuration Site 4.32...
- Page 57 4.0 System configuration The reference sheet The values of the loaded graph will be listed in the column „Temperature“ (2).The software will calculate the re- sults for “Reference+” (4) and “Refer- ence-” (5) according to the values in the columns “Temperature” (2) and “Refer- ence±”...
- Page 58 4.0 System configuration Site 4.34...
- Page 59 4.0 System configuration The reference sheet Clear list (8) Clear list It is possible to delete and load different referent graphs for comparison with the measured graph. The diagram will be updated automatically. Press the button >Clear list< (8). Confirm the following message with >OK<.
- Page 60 4.0 System configuration Site 4.36...
- Page 61 Connect measure- Connect the thermocouple sensors with the ment box with PC measurement box. Start the MESY 3.0 software. Press the button >Adjust< on the configuration sheet. Provide two pots filled with a non-conducting fluid (e.g. oil) with two different temperatures. For example 25°C and 100°C.
- Page 62 >Adjust Lo<. Press the button <Adjust Lo>. In the table you will now see your entry and there- corded value of the MESY 3.0. Follow the same procedure for the channels 2 and 3 for 25°C. Adjust high tem- Now the channels will be adjusted with 100°C.
- Page 63 4.0 System configuration Follow the same procedure for the channel 2 and 3 for 100°C. Close the menu >Adjust<. If you press the button >Start< now, a measure- ment will begin. If the adjustment procedure was successful you should see now a graph at 25°C and at 100°Cdepending on the fluid the sensors tips are inserted in.
- Page 64 4.0 System configuration Site 4.40...
-
Page 65: Chapter 5 Measurement Assembly And Measurement
5.0 Measurement assembly and measurement Preparing the PCB The thermocouple sensors are capable for the measurement directly at a component or at the PCB. The sensors can be fixed with a heat-conductive paste temporarily or with chip glue permanently. Attention, danger Observe the instructions of the manufacturer when using heat-conductive paste or chip glue. -
Page 66: Configuration For The Measurement Analysis
5.0 Measurement assembly and measurement Configuration for the measurement analysis Site 5.2... - Page 67 5.0 Measurement assembly and measurement Configuration for the measurement analysis If you have enabled the automatic analysis on the Automatic configuration sheet, it will start directly after the analysis and measurement. You can start analysis again by pressing display the button “Analyze” on the diagram sheet. Activating- On the configuration sheet you can enter the activating- and melting...
- Page 68 5.0 Measurement assembly and measurement Site 5.4...
- Page 69 5.0 Measurement assembly and measurement Messung durchführen Insert the PCB with the fixed thermocouple Prepare PCB sensors in the measurement zone. Configure all settings on the configuration sheet referring to the instructions in chapter 4. Press the button <Start>. Start The measurement will now start.
- Page 70 5.0 Measurement assembly and measurement After the measurement is finished the recorded values can be used for further processing with all functions offered by Microsoft Excel 2000 © Save the file with a new name when closing the software. The original file”Mesy3.xls” will be retained with the standard settings.
-
Page 71: Chapter 6 Measurement Analysis
6.0 Measurement analysis The display supports After recording the measurement values you can analyze the graphs on the diagram sheet. Main- and auxil- The main- and the auxiliary interval help to iary interval read time-and temperature relations. Popup functions give short information in ap- Popup function pearing windows. - Page 72 6.0 Measurement analysis Site 6.2...
-
Page 73: The Measurement Graph
6.0 Measurement analysis The display supports The measurement graphs for each single channel are Measurement shown in a different colour. The software offers the graph option to save a recorded graph as a reference profile. See section “ Reference graph” on the following page. You can: Analyze which temperature acts in which heating- phase. - Page 74 6.0 Measurement analysis Site 6.4...
- Page 75 6.0 Measurement analysis The display support reference graph In first line reference graphs are a criterion for further Reference graph measurement graphs. The software offers the option to define and to save a measured graph as a reference graph. The reference graphs can be edited or created new on the reference sheet.
- Page 76 6.0 Measurement analysis 3 4 5 Site 6.6...
- Page 77 6.0 Measurement analysis The display support time and temperature value Peak tempera- Peak temperature ture The peak temperature is the maximum tempera- ture of a graph. In the foot line the peak tempera- ture, the time between the beginning of the meas- urement and the peak and the max.
- Page 78 6.0 Measurement analysis Site 6.8...
- Page 79 6.0 Measurement analysis Die Zeitachse strecken und stauchen For a better analysis of the measurement graphs it is Change time possible to stretch and to compress the time axis and to axis change the size of the time raster. Change to the configuration sheet and enter a new value in the field “In diagram shown time window”.
- Page 80 6.0 Measurement analysis Site 6.10...
- Page 81 6.0 Measurement analysis Die Zeitachse strecken und stauchen The following dialog appears: Help lines time axis You can enter the graduation of scale in the fields main interval and help interval according to your wishes. Confirm your entry with >OK<. The new graduation of scale is now available.
- Page 82 6.0 Measurement analysis Site 6.12...
- Page 83 6.0 Measurement analysis Compressing and stretching the temperature axis For a better analysis of the measurement graphs it is possible to compress or stretch the temperature axis and to change the size of the temperature raster. Change temper- Move the mouse pointer on the temperature axis ature axis (1) until the popup menu “scale axis Y”...
- Page 84 6.0 Measurement analysis Site 6.14...
- Page 85 6.0 Measurement analysis Die Temperaturachse strecken und stauchen The following dialog appears: Help lines You can enter the graduation of scale in the fields temperature axis main interval and help interval according to your wishes. Confirm your entry with >OK<. Site 6.15...
- Page 86 6.0 Measurement analysis Site 6.16...
- Page 87 7.0 Notes Site 7.1...
- Page 88 7.0 Notes Site 7.2...
- Page 89 7.0 Notes Site 7.3...
- Page 90 7.0 Notes Site 7.4...
- Page 91 7.0 Notes Site 7.5...
- Page 92 7.0 Notes Site 7.6...
Need help?
Do you have a question about the Mesy 3.0 and is the answer not in the manual?
Questions and answers