Table of Contents
Advertisement
Quick Links
Advertisement
Table of Contents

Related Manuals for ILX Lightwave FPM-8220


Summary of Contents for ILX Lightwave FPM-8220
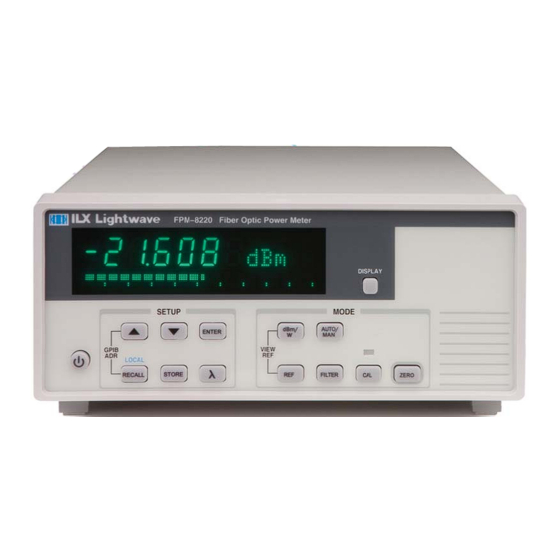
- Page 1 User’s Guide Fiber Optic Power Meter FPM-8220 LabView Driver ILX Lightwave Corporation · P. O. Box 6310 · Bozeman, MT, U.S.A. 59771 · U.S. & Canada: 1-800-459-9459 · International Inquiries: 406-556-2481 · Fax 406-586-9405 · ilx.custhelp.com www.ilxlightwave.com 700444 July 2011...
-
Page 3: Table Of Contents
T able of Contents Chapter 1: Introduction FPM-8220 LabVIEW Instrument Driver Overview USB Communication Configuring the COM Port GPIB Communication Chapter 2: Operation Front Panel vs. Block Diagram VISA session IN and OUT ... - Page 4 Page Left Intentionally Blank July 2011 FPM-8220 LabVIEW Manual...
-
Page 5: Chapter 1: Introduction
After the correct values are selected, click Validate and then Save. The COM port is now configured. GPIB Communication The GPIB connector is also located on the rear panel of the instrument. See the FPM-8220 Product Manual for instructions on setting the GPIB address using the front panel controls. July 2011... - Page 6 July 2011 FPM-8220 LabVIEW Manual...
-
Page 7: Chapter 2: Operation
Chapter 2: Operation This chapter is an introduction to the LabVIEW software and the FPM-8220 Fiber Optic Power Meter LabVIEW Instrument Driver. This chapter also includes: Common Instrument Driver Features FPM-8220 Sub-VI Descriptions FPM-8220 VI Descriptions Front Panel vs. Block Diagram The Front Panel appears when a sub-VI is opened. -
Page 8: Updating The Sub-Vi
Queries the instrument with the IEEE 488.2 command *IDN? and returns the manufacturer, model number, serial number and firmware version number as a string. FPM-8220 Read Errors Reads the instrument's error queue and returns it as a string. See the FPM-8220 Manual for more information. FPM-8220 Read Head ID... -
Page 9: Fpm-8220 Set/Read Range
This VI performs the instrument zeroing process. If there is an error during the zeroing process, the boolean output "Zeroing error" is asserted. FPM-8220 Example VI Description FPM-8220 Example VI This VI uses a number of sub-VI's to get the instrument and head IDs, as well as read the power in Watts and dBm at a specified wavelength. - Page 10 July 2011 FPM-8220 LabVIEW Manual...
-
Page 11: Chapter 3: Errors And Troubleshooting
Chapter 3: Errors and Troubleshooting This chapter is an introduction to the FPM-8220 Fiber Optic Power Meter LabVIEW Instrument Driver’s common errors. This chapter also includes: Troubleshooting NI Spy Errors Broken Gray Arrow: If a broken gray arrow appears in the toolbar (where the white arrow should be) and the white arrow is not there, this indicates an error in the code.
Need help?
Do you have a question about the FPM-8220 and is the answer not in the manual?
Questions and answers