Table of Contents
Advertisement
Quick Links
Advertisement
Table of Contents

Related Manuals for CAN CHECKED MFD28 Gen2


Summary of Contents for CAN CHECKED MFD28 Gen2
- Page 1 MFD28/32 Gen2 Manual...
-
Page 2: Table Of Contents
Content Description and scope of delivery ....................5 Connection of the plugs ........................6 Navigation on the display ........................ 8 Logging ............................10 Menu navigation on the display ....................11 Popup ............................ 12 Can Bus ..........................12 5.2.1 TRI/TRX File ........................13 5.2.2 Can Speed ........................ - Page 3 TRI Day ........................... 30 9.2.1 Handling ......................... 30 9.2.2 enhanced mode ......................31 Pages............................33 9.3.1 predefined pages ......................35 9.3.2 Widgets .......................... 36 9.3.2.1 General ........................37 9.3.2.2 Color selection ......................38 9.3.2.3 vertical bar ......................... 39 9.3.2.4 round meter ......................40 9.3.2.5 YT diagram .........................
- Page 4 9.5.7 Can Transmit ........................64 9.5.8 User tables ........................65 9.5.9 Math Channels....................... 66 9.5.10 Boost/PWM Control ...................... 67 Upload ........................... 68 Can Log ..........................69 Work offline ........................... 69 10 AIN Setup (analog inputs) ......................70 11 FAQ ..............................72 11.1 TRI/TRX file problem ......................
-
Page 5: Description And Scope Of Delivery
1 Description and scope of delivery Thank you for purchasing your MFD28/32 Gen2. With the CANchecked data display, you can display live data from your vehicle while driving, log sensors and use many other functions that are presented to you in this manual. This guide explains how to operate and handle your Gen2 data display. -
Page 6: Connection Of The Plugs
2 Connection of the plugs To operate your MFD28/32 via the Can bus, only four wires are required: • 12 volts on-board voltage, ideally ignition plus -> Pin A5 • Ground -> Pin A1 • Can High (CanH) -> Pin B2 •... - Page 7 Furthermore, the MFD28/32 Gen2 has a frequency input. With this you can separately feed wheel, engine or turbocharger speed (5V square wave signal) or the ethanol content of your fuel into the display. Pin B5 or B10 can be used for these applications. More information can be found 9.5.6 9.5.6. Some settings can be implemented directly via the display.
-
Page 8: Navigation On The Display
3 Navigation on the display You can operate your display like any standard smartphone with touch and swipe gestures. Figure 2: Gestures to operate the data display To switch sides, simply swipe left (one side forward) or right (one side back) across the display. - Page 9 If you swipe down from top to bottom on your display (red arrow) you will be taken to the setup and DTC (not available on all vehicles and protocols, more on this in chapter 6.2). In the setup you can make all settings relevant for the operation of the display. The menu navigation in the setup is described in chapter5 Figure 4: Setup and Quick Access Bar If you swipe your finger from bottom to top...
-
Page 10: Logging
4 Logging To start and stop the log, press the button in the lower left corner after swiping up. Depending on the active protocol (see chapter 6.26.2(without protocol) all sensors available in the TRI/TRX file are logged. The logs are numerically incremented, and the button appears in green when the log is active. -
Page 11: Menu Navigation On The Display
5 Menu navigation on the display This chapter describes the menu navigation and the submenus of the setup. Each point of the setup is processed in a subchapter. The setup can always be terminated by clicking on the white on a red background. -
Page 12: Popup
5.1 Popup Your data display has the possibility to show you a blue or red popup when falling below or exceeding set minimal and maximal values. Figure 8: Red popup when exhaust gas temperature is too high By default, the pop-ups are disabled both in the display and for each sensor individually. To activate the popup, it must be switched on globally in the setup under the menu item described here (see Figure 6) and the minimal or maximal values and the popup for the corresponding sensor must be activated in the TRI file9.2... -
Page 13: Tri/Trx File
5.2.1 TRI/TRX File Under the submenu item TRI/TRX File you can select the TRI/TRX File you need from a list or scan your engine data (UDS only) if your engine code letter (MKB) is not yet in the list to start a service request under info@canchecked.de. -
Page 14: License
For assignment, the corresponding sensor must be clicked on and can then be selected from the list of available sensors by clicking on it. The successful dialing is indicated by a green box. The sensor init can always be terminated by clicking on the white on a red background (changes are saved automatically). -
Page 15: Gears
Figure 10: License Furthermore, you can enter the license codes to activate paid additional functions here. At the bottom of the screen, you will find feedback on the activated additional functions such as the Haldex license. If this is red no license is active, if this green is the corresponding function is active. 5.5 Gears In the Gears submenu, the gear ratios can be entered for gears one to seven. -
Page 16: Splash Screen
5.6 Splash Screen The splash screen is the start image/animation of your data display. In this menu you can set whether and for how long the splash screen should be displayed when your data display is switched on. By tapping the number, you can switch between off and a time of one to ten seconds. 5.7 Start Page Under Start Page you can set on which page your display should be after starting. - Page 17 The last item of this submenu is the orientation of your data display. The user interface can be aligned in all four spatial directions. Horizontal, vertical, horizontal2 and vertical2 are available as options. After a change, a restart of the display is necessary. This can be done by disconnecting the power supply or by rebooting (described in Chapter 5.3).
-
Page 18: Custom Button
5.11 Custom Button The custom button, if activated, can be found at the bottom right of the quick access bar. So far, the following options are available: Table 2: Custom Button Option Description The custom button is not active and is not displayed Sleep Display turns black and only lights up again with the next touch Reset Max... -
Page 19: Das Tri/Trx File
6 The TRI/TRX File The TRI or TRI. TRX File is the heart of your data display. All sensors and the associated information are stored in the TRI file. In principle, every TRX file is a TRI file, but some information is encrypted in it. -
Page 20: Name Encoding Of Tri/Trx Files
Table 3: TRI/TRX data column Designation Purpose and particularities position Header bus header for OBD/UDS (hexadecimal) 0 = no protocol or specific Can Bus Identifier for protocol Can ID Can Bus Identifier (hexadecimal) when using OBD/UDS/TP2.0: Address for querying the device Format 0 ->... -
Page 21: Protocols
• stands for the English language and the units metric • stands for the language English and the units imperial • stands for hybrid here is the language English and the units partly imperial, partly metric, more detailed information can be found in the enclosed Quickstartguide •... - Page 22 Figure 15: TRI/TRX Selection Submenu Now you can select your engine code/ECU from the list and by clicking on the corresponding file the name of the file will be transferred to the load file button. Now you can press Load file to load and activate the TRI/TRX file.
-
Page 23: Adjust On The Display
7 Adjust on the display While with the Gen1 CANchecked data displays almost everything could be configured on the display, the possibilities to set up the sides on the display itself have been significantly reduced with the Gen2. To improve the setup of your data display, we've put even more work into customizing your display using DSS. - Page 24 In the image below, the three layers of the DailyDash are visible. Figure 16: The three layers (round meter, overlay and sensor value) on the DailyDash With the DailyDash are not only three layers above the large boost pressure display, but also above the three small round displays arranged on the side.
-
Page 25: Flashing The Firmware
Flashing the firmware To change or update the firmware installed on your display, you must use our CANchecked Updater. You can find it on our website under Downloads MFD28/32/32S (https://www.canchecked.de/downloads/mfd28-mfd32-mfd32s-mfa28-update- softwareaktualisierung/). The updater is available for Windows and Mac. ATTENTION: Windows 7 still requires a driver. This can also be found in the MFD28/32/32S download area. - Page 26 If you have downloaded the firmware to your PC/Mac, you can now continue in the CANchecked Updater. By clicking on the upload button in the CANchecked Updater, the folder structures can now be searched. Now navigate to the directory where you saved your firmware, select it with a mouse click and press Open.
-
Page 27: Customizing The Display On The Pc With The Dss
9 Customizing the display on the PC with the DSS To make your data display unique, you can't avoid our DSS. You can download the DSS for free from our website at www.canchecked.de/dss/. This is available for both PC and Mac. On our website you will find a quick guide to download and install. -
Page 28: Connection
9.1 Connection To connect to your data display, you have to click on the Connection tab in the tab overview. Figure 21: DSS tab overview By now at the latest, you should have connected your data display to your PC/Mac via USB. If this is the case, you can select the data display as an available COM port from the list on the left side of the screen and establish the connection by clicking on it. - Page 29 If the check mark is set at the first selection field, all pages of your data display are imported into the DSS. During the import of the pages, your display automatically switches through all pages. Only if this check mark is set, you can call up an overview of all pages in the Pages tab. More on this in chapter 9.3 If the second selection field is checked, the TRI Editor is emptied before the sensors are imported from the data display.
-
Page 30: Tri Day
9.2 TRI Day In the TRI Editor, all sensors of your data display can be found after the import. In addition to the sensors that come as can messages on your display, you can also create and parameterize the four analog inputs here. -
Page 31: Enhanced Mode
• MathChannel7 • MathChannel8 • Usertable1 • Usertable2 • Usertable3 • Usertable4 • Usertable5 • Usertable6 • Usertable7 • Usertable8 fourth area can be used to get a quick overview of the individual information about the sensors. Simply select the desired information and compare it directly. In the fifth and last area you have the possibility to activate the enhanced mode by a slider. - Page 32 now specify the sensor speed as RefSensor with a RefValue of 3000, the min oil pressure warning will only be activated if the oil pressure is less than 1.5 bar, but only as long as the sensor speed has a value above 3000.
-
Page 33: Pages
9.3 Pages In this tab you can adjust the individual pages of your data display. If you have ticked both boxes when establishing the connection, you will get an overview of all pages created on your data display by clicking on the Pages tab and can also switch from here to the individual view of the pages by clicking on them. - Page 34 Attention: If your data display is connected to the DSS, it is no longer possible to change the pages on the display by swiping gestures. When the connection is active, the pages can only be switched through by pressing the arrows in the single view.
-
Page 35: Predefined
9.3.1 predefined pages We are constantly expanding our predefined pages. By clicking on the load predefined page button, you get the names and a preview of the corresponding pages displayed and can load them into the DSS by double-clicking. So far, you can choose from these views: •... -
Page 36: Widgets
9.3.2 Widgets To the right of the preview of the page, you'll find the list of active widgets on the page. The smaller the number of the widget, the further it is in the background. For example, widget 5 is always above widget 4. -
Page 37: General
9.3.2.1 General In the display options of your sensors, you can choose from 20 widgets to have all important information at a glance. In the following, each and the configuration options of the widgets within the DSS are explained. In general, almost all widgets can be changed in their position, color and size. The position and size are given in X and Y coordinates. -
Page 38: Color Selection
9.3.2.2 Color selection For most widgets, you can configure the colors. Color gradients, font colors and background colors are freely configurable. The color wheel shown in the figure below is used to adjust the colors. In the outer circle you specify the base color, in the inner square the brightness or darkness. The color is then always written as hexadecimal code in the corresponding field of the widget and can be marked and copied here to be applied to other widgets. -
Page 39: Vertical Bar
9.3.2.3 vertical bar The vertical bar is a vertical bar chart and can be used wonderfully to display and compare temperatures or pressures. This is freely configurable in both size and color. A gradient is also possible. Figure 31: Display view of the vertical bar widget for comparing three pressures When it comes to the course of the vertical bar, you can choose from three options: •... -
Page 40: Round Meter
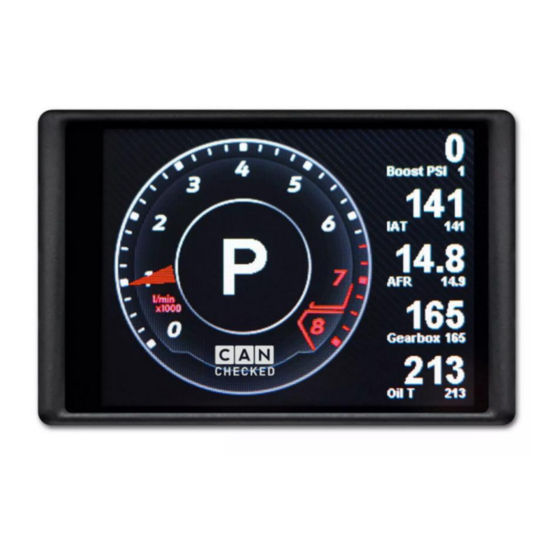
9.3.2.4 round meter The round meter is a classical display, which is already known from the Gen1 CANchecked data displays. Different sizes and color gradients are possible here. In the figure below, one large and four small round meters with different color gradients are visible. The central value does not belong to the round meter widget but is a separate sensor value widget. -
Page 41: Yt Diagram
9.3.2.5 YT diagram The YT diagram is also known from the Gen1 data displays. With this widget you can display the history of a sensor value over time. Ideal for a direct overview of the peaks of your sensor readings after a pull. -
Page 42: Enumeration
9.3.2.6 Enumeration With the enumeration widget you have the possibility to display numbers in text. So, you can display error codes in plain text. For example, a "1" received via the Can Bus could be shown on the display as "No errors deposited". A "2" received via the bus, on the other hand, could mean "engine malfunction –... -
Page 43: Icon
9.3.2.7 Icon The icon widget can not only be used to beautify the pages and make them look more appealing. Rather, it can also be used to concisely display the states of sensors. For example, a red icon can signal that a certain pressure or temperature has been exceeded or undercut. There are no limits to your imagination, and you can choose from a variety of predefined icons. -
Page 44: Sensor Value
9.3.2.8 sensor value With the sensor value widget, you can display a sensor value as a simple number. The number of decimal places is specified by the TRI/TRX file0 Figure 40: Display view for comparing pressures using the triple sensor value widget If you like a frame around the widget better, you can also activate it and adjust its color. - Page 45 Figure 42: Configuration sensor value By setting/removing the checkmarks, you can personalize your widget even further. • show name -> shows the name of the associated sensor • show max -> displays the maximum value of the current session as a small numerical value below the measured value one •...
-
Page 46: Gear
9.3.2.9 Gear With the gear widget you can display the currently engaged gear as a large number. The gear widget5.5TrackView. Figure 43: Display view of the gear indicator in the rev counter of the TrackView In automatic vehicles, the display of the gear (P; R; N; D; S). Important for the error-free function of this widget is the correct assignment of the sensors in the sensor init. -
Page 47: G-Meter
9.3.2.10 G-meter The G-meter is a widget known from motorsport. The sphere shows you your longitudinal and lateral accelerations (unit: G). In addition, the maximum lateral and longitudinal accelerations achieved can also be displayed. Ideal for the next trackday to find the ideal line, just to improve your lap times or verify your aeromods. -
Page 48: Can Switch
9.3.2.11 can switch The can switch widget is also already known from Gen1. With this widget you can save yourself a Can Keypad and use your data display as a keypad instead. Possible functions would be switching on and off additional devices such as pumps or fans or other hidden functions that you have integrated into your vehicle. -
Page 49: Multi Switch
9.3.2.12 multi switch A multi switch is a switch that can assume two or more states. This can be used, for example, to switch different boost levels or to configure the control of the ABS. This function can be used to emulate a rotary potentiometer, for example, with your data display. -
Page 50: Horizontal Bar
9.3.2.13 horizontal bar The horizontal bar is analogous to the vertical bar. The horizontal bar chart can also be used to display and compare temperatures or pressures. This is freely configurable in both size and color. A gradient is also possible. In the figure below, the widget is used to display the opening angle of the throttle. -
Page 51: Needle
9.3.2.14 Needle The new widget can be used to configure your own analog pointer displays (rev counter/boost pressure indicator). The needle widget can be scaled with the DSS exactly to the desired size. Both the size and the color of the pointer are adjustable. In the screenshot below, the needle widget can be seen on the predefined TrackView. - Page 52 The menu items start angle and end angle refer to min value and max value and are, as already specified in the round meter in degrees, where 0 degrees is at 12 o'clock. For example, if you want a classic "6 o'clock speedometer" your min value is 0 and the start angle is -180. As already known from the round meter, there is also a split-seconds pointer in the needle widget.
-
Page 53: Overlay
9.3.2.15 Overlay With the overlay widget you can display flashing warnings regardless of the min and maximum warning values stored in the TRI/TRX file. You can freely configure the flashing frequency and color. The overlay widget can be found by default for various purposes (warning, shiftlight) on the following pages: •... -
Page 54: Pixel
9.3.2.16 Pixel The pixel widget is interesting for all users who use the log function. Those sensors created as a pixel widget are additionally queried and stored in the log file. If you have now created an appealing page on which, for example, you monitor the boost pressure and the exhaust gas temperature and want to log along, but you would also like to see lambda and speed in the log without displaying these sensors as widgets (round meter, sensor value, etc.) on your new page, you can create the pixel widget twice. -
Page 55: Performance Meter
9.3.2.17 performance meter You can use the form meter to test improvements to your vehicle on closed test tracks. The form meter is active and measures as soon as you are on this page. The following (best) times are stored: •... -
Page 56: Status Rectangle
9.3.2.18 status rectangle The status rectangle widget can be used similar to the icon widget. It is also variable in position (x/y coord) and size (x/y size). Each of the two states can be assigned a color or a gradient using the color wheel. -
Page 57: Rectangle
9.3.2.19 rectangle The rectangle, like the status rectangle, is adjustable in size, position and color (gradient). It is not assignable to any sensor, so you can use it as a construction element for your pages. Due to the variable size and position, this widget allows you to draw fine lines to spatially separate your ads. You can also use it to create backgrounds for other ads. -
Page 58: Text Field
9.3.2.20 text field With the text field widget, you can design your pages even better and create your own words or sensor names on your pages. The text fields can be changed in position and size and the size and color of the font is variable. -
Page 59: Picture
9.3.2.21 picture In addition to the text fields, you can also use the picture widget to make your pages more appealing or provide a custom background. In the figure below, the CANchecked logo and the carbon background are created as a picture widget. Figure 64: Carbon background and CANchecked logo as picture widget The position of the image can be defined as usual with x/y coord. - Page 60 Figure 66: RPM bar as predefinded page For example, an oil pressure indicator in digifiz style would also be conceivable. As with our other widgets, there are no limits to your creativity, and you can make the CANchecked data display your data display.
- Page 61 In contrast to the RPM bar of the Gen1 displays, other sensors can also be assigned to this widget with the Gen2. For example, it is possible to show or hide images/logos based on the accelerator pedal position. Attention: you can only use one image for RPM Bar per page – i.e., several RPM Bar widgets with the same image.
-
Page 62: Log Viewer
9.4 Log Viewer In the Log Viewer, the 4 To view a log, you have to navigate to the Log Viewer tab and import the logs stored on the data display into the DSS via import from Display. In this navigation bar you can also export logs to your PC or load them from your PC into the Log Viewer. -
Page 63: Other Settings
9.5 Other settings As with the setup on the data display itself, changes can also be made to the settings of the data display in the DSS. If changes are made here, they must always be transferred to the data display with the write to display button at the bottom left. -
Page 64: Sensor Init
9.5.5 Sensor init Analogous to the setup on your data display, the sensor init settings can also be made directly via the DSS. Figure 72: Sensor init For most applications, it is sufficient to set RPM to the sensor speed , speed to the sensor speed and gear to the sensor gear. -
Page 65: User Tables
Figure 74: Can Switches Furthermore, you can send up to four Custom Can Frames from your data display to the Can bus. The frames can be activated individually (Activate). Figure 75: Can frame To do this, the number of messages in the frame, the Base ID (Message Id 0x), the transmission rate (Transmit rate) as well as the Endiness (Endian) and the data type (Data Type) must be specified. -
Page 66: Math Channels
Figure 76: User Table By clicking on the write to display button, the newly created user table is transferred to your data display. In order to use the User Table as output, it must be created as an internal sensor in the TRI editor. -
Page 67: Boost/Pwm Control
Figure 77: Math Channel One decimal place is sufficient as a resolution here. Accordingly, a resolution of 0.1 is chosen. As in the TRI Editor, the decimal separator is a period and not a comma! From the drop-down menu, select the most suitable calculation template, assign the variable and fixed values and click on the write to display button to transfer the newly created Math Channel to your data display. -
Page 68: Upload
Figure 78: Boost/PWM Control The output output can be corrected by further user tables. In the following example, the boost output is corrected (scaled) by a table with the gears. With this Boost by Gear, the boost pressure control valve is scaled down in the lower gears for more traction and scaled up even more in the upper gears. -
Page 69: Can Log
Figure 80: DSS Upload Section If old images are overwritten, they must be deleted from the flash memory after successfully uploading the new image. To do this, please swipe down from top to bottom on the display after uploading, click on Setup -> Sensor Init -> Erase flash.5.3 In addition to uploading your own images and files, you can upload internal DSS images and TRI/TRX files via the lower area of the upload section. -
Page 70: Ain Setup (Analog Inputs)
10 AIN Setup (analog inputs) Your display has 4 analog inputs with 10bit resolution (0-1023). Already successfully tested and installed sensors as well as their characteristic curves and connection diagrams can be found under www.canchecked.de/help/analoge-eingaenge-gen2/. Figure 81: Connecting the AINs The analog inputs are also set up via the DSS. - Page 71 • OFF (shows the 10bit ADC value: 0-1023) • • Figure 83: MAP Figure 84: NTC If set to OFF, no characteristic curve is activated and a value of 0-1023 is output. If set to MAP, the values for zero and five volts can be entered. If the data sheet of your sensor only provides values for 0.5 and 4.5 volts, you can open the calculation tool by clicking on calculate to calculate the corresponding values for zero and five volts.
-
Page 72: Faq
11 FAQ This chapter collects recurring questions and offers solutions. 11.1 TRI/TRX file problem If your data display shows you this error message, you have not selected a TRI/TRX file. Figure 86: TRI/TRX file problem Solution: Select TRI/TRX File as described in Chapter 6.3 11.2 Display does not turn on If your display doesn't turn on, there's probably a problem with the power supply. -
Page 73: Gear Indicator Does Not Work
If no improvement occurs, please contact info@canchecked.de with a complete description of the error. 11.5 Gear indicator does not work The gear indicator calculates the gear from engine speed and speed. If your gear indicator does not work, this can have various causes: •... -
Page 74: My Performance Meter Runs Permanently
11.7 My Performance Meter runs permanently If the Performance Meter runs continuously, even when stationary, the widget is assigned the wrong sensor. To assign the right sensor there are 2 ways: unlocking the pages, click performance meter, assigning the sensor speed, locking the pages. On the computer: Connect to the DSS, select the performance meter, assign the sensor speed. -
Page 75: How Do I Rotate The Ui Of My Display
11.11 How do I rotate the UI of my display? The user interface of your data display can be changed either on the display directly under Setup -> Pages -> Orientation or via the DSS (chapter 9.5.1). 11.12 My DSS gets stuck on page X If your data display always hangs on a defined side when connecting, it is easiest to delete this page manually on the display and then create it again.
Need help?
Do you have a question about the MFD28 Gen2 and is the answer not in the manual?
Questions and answers