Table of Contents
Advertisement
Quick Links
Advertisement
Table of Contents

Subscribe to Our Youtube Channel
Related Manuals for Biobase BK-S430 NIR


Summary of Contents for Biobase BK-S430 NIR
- Page 1 BK-S430 NIR SPECTROPHOTOMETER User Manual ...
-
Page 2: Preface
Thank you for purchasing this instrument. This manual will show you how to use the instrument and software. Please read this manual carefully before using Prolab. Prolab is suitable for: BK-S430 NIR Spectrophotometer The model “BK-S430” will be abbreviated as “S430” ... -
Page 3: Special Statement
S430 User Manual Special Statement Please read this manual carefully before installation or operation. The company will not take responsible for any trouble or damage due to unproper use. The company has the final interpretation of this manual. Modifications of the manual due to improvements of the instrument will not be announced. -
Page 4: Notice
S430 User Manual Notice 1.The instrument is suitable for analysis in laboratory. If the instrument is needed outside the lab, please make the field work environment meets the environmental requirements of the laboratory. 2.Pleaseuse original package when moving instrument. 3.Pleasewait 30 minutes after turning on the instrument to make it stable. -
Page 5: Table Of Contents
S430 User Manual MENU Preface ..........................1 Special Statement ......................2 Notice ..........................3 MENU ..........................4 Instrument Overview ....................6 Theory ......................6 Appearance ....................7 Performance ....................8 Packing List ....................8 Environmental Requirements of Software ..............9 PC Requirements .................. - Page 6 S430 User Manual General Operation ..................45 5.5.1 Wavelength ..................45 5.5.2 Set 100% .................... 45 5.5.3 Set 0% ....................45 5.5.4 Move sample rack ................45 5.5.5 Switch T/A ..................46 5.5.6 Locate file ................... 47 5.5.7 Data management ................47 5.5.8 Characteristic Peak ................
-
Page 7: Instrument Overview
S430 User Manual 1 Instrument Overview 1.1 Theory The principle of spectrophotometric analysis is to show the substances absorb phenomenon on different wavelengths and do qualitative and quantitative analysis of the substances. This instrument is measuring base on relative measurement. Choose a certain substance (Distilled water, air or the sample) as reference solution, set its transmittance to 100%. -
Page 8: Appearance
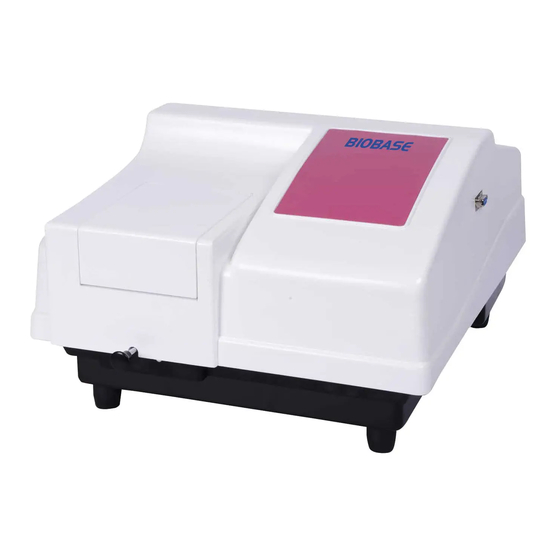
S430 User Manual 1.2 Appearance Fig 1.2.1Appearance 1. Sample compartment lid 2.Power switch 3. Fuse 4.Power socket 5.USB Port Fig 1.2.2Left view... -
Page 9: Performance
S430 User Manual Performance Wavelength Range 900-2500 nm Wavelength Accuracy ±0.2nm Wavelength Reproducbility ≤0.05nm Absorbance Noise <50uA 0.001A Baseline flatness Resolution Stray Light <0.1% Light Source >10000 hours Scanning time <1 minute Communicate Port USB2.0 Size 360×460×240mm Weight 12kg 1.4 Packing List Main body 1 pc Power cable... -
Page 10: Environmental Requirements Of Software
S430 User Manual Environmental Requirements of Software Please read the manual of Windows XP or higher version before reading this section. Windows XP is recommended. When the operating system is Windows Vista or higher version, . . . .. . .. . . . . . . . .. . . . . .. . . . . . . . . . . . . .. .. . . . . .. . . . . . . . please run the software under administrator account. - Page 11 S430 User Manual Click “Next” to continue. Input name and company, then click “Next” to continue.
- Page 12 S430 User Manual Click “Change” to change the install path. Click “Next” to confirm.
- Page 13 S430 User Manual...
-
Page 14: Before Use
S430 User Manual 3 Before Use 3.1 Connect to PC Please use the USB cable to connect the instrument and PC. Driver installation will automatically start when first time connecting. Please run the software after driver installation is done. 3.2 How To Connect Plug in USB cable Connect the instrument and PC with USB cable while the PC is on. -
Page 15: Functions
S430 User Manual 4 Functions 4.1 Modes There are 4 modes: Photometric (1) Measure the photometric data of the sample. (2) Data display as Trans./Abs.. (3) Photometric data supports up to 26 wavelengths. (4) support up to 10 user-defined calculation formula. (5)... -
Page 16: Interface
S430 User Manual 4.2 Interface 4.2.1 Modules Menu Tool bar File browser Status Information 4.2.2 Modules Intro 1. Menu & Toolbar Menu & Toolbar... - Page 17 S430 User Manual Provides instrument controls and settings. Tool bar are shortcuts for common features. 2. Document Browser Document Brower shows files saved in Wavelength Scan, Time Scan and Quantitative Analysis mode. Double click to open a file. 1) Double click a file to open/reset spectrum. 2) Right click a file to open, rename or delete.
-
Page 18: Icons
S430 User Ma a nual 4.2 2 .3 Icons s Icon Functio New M Measurement Open S Spectrum Show/H Hide Status Show/H Hide Spectru um Informat tion Wavele ength scan / / Time scan Photom metric windo Quantit tation windo Back to o original co ordinate... - Page 19 S430 User Manual Set wavelength Set 100% Set baseline Spectrum Properties Print Data Trans. / Abs. Move sample rack to “Sample” position Move sample rack to “Reference” position Current status online/offline...
-
Page 20: Software Operation
S430 User Manual Software Operation 5.1 Photometric Photometric work flow Photometric work flow Power on Initialize Run software Create new measurement Select “Photometric” Set parameters Confirm paremeters Start Input file name Measure samples Finish Print out data 5.1.1 Create Measurement Create a new measurement. - Page 21 S430 User Manual Measurement summary: Measure Mode: Choose “Photometric”. Operator: Input operator’s name. Serial Number: Shows the serial number of the instrument. Version Number: Shows the version of the instrument. Memo: Enter a description or notes on measuring conditions. Click to reset.
- Page 22 S430 User Manual Data Mode: Data display as Trans. or Abs. Wavelength: Input wavelength in , then click to add it in the table. Change wavelength:Select the wavelength in the table then change the value here . Click finish. Delete wavelength: Select the wavelength in the table .
- Page 23 S430 User Manual Add formula: Input formula here and click to add it in the list. Change formula: Select formula want change ,edit it here and click to finish. Delete formula: Select formula want delete , then click to delete it. Clear: Click to delete all formula.
-
Page 24: Start A Measurement
S430 User Manual 5.1.2 Start a Measurement Create Photometric measurement as 2.3.1.1. Put the reference sample in the sample cell and click to set 100% and 0%. Put sample in the sample cell and click to start measuring. There will be a popout window after the first measurement. Input file name and click OK (or leave it) to save. -
Page 25: Wavelength Scan
S430 User Manual Wavelength Scan Wavelength Scan work flow Power On Initialize Run Prolab Create a new measurement Select Wavelength Scan Set parameters Confirm parameters Start scan Input file name Confirm Finish scanning Print out data... -
Page 26: Create A Measurement
S430 User Manual 5.2.1 Create a Measurement Select “Files”->“Create Method” or click to enter Create Method Window. General Tab: Measure Mode: Choose “Wavelength Scan”. Operator: Input operator’s name. Serial Number: Shows the serial number of the instrument. Version Number: Shows the version of the instrument. Memo: Enter a description or notes on measuring conditions. - Page 27 S430 User Manual Instrument Tab: Data mode: Data display as Abs., Trans. or Energy. WL.Min: Input the start wavelength. WL.Max: Input the ending wavelength. Speed: Select the scan speed. The faster the more noise appears. Interval: Shows data sampling interval according to the scan speed. Delay: After pressing the Measure button, measurement isstarted following the delay time set here.
- Page 28 S430 User Manual Monitor Tab Y Axis: Enter the max and min point of Y axis.The max point should be larger. Auto Zoom: Y axis will automatically set by spectrum data. Processing Tab: Available: Savitsky-Golaysmooth,Mean smooth, Median smooth and Derivative are available for data processing.
- Page 29 S430 User Manual Click a method in the “Available” box then click to put it in the Selected box. Click a method in the “Selected” box then click to remove it. Selected: Final data will be calculated with methods in the Selected box. You can set parameters for each method.
-
Page 30: Start A Wavelength Scan
S430 User Manual Clear Data: Clear current data section. 5.2.2 Start a wavelength scan Create a new measurement. Put reference sample in the sample cell and click to adjust baseline. Put sample in the sample cell and click to start scanning. There will be a popout window after the first measurement. -
Page 31: Model
S430 User Manual Click to show/hide peaks. 10. Click to show/hide grid. 11. Click to move sample cell. 12. Click to switch between Trans. and Abs. 13. Click to run spectrum comparison. 14. Click to run spectrum calculation. 15. Click to run Spectrum derivation. -
Page 32: Time Scan
S430 User Manual 5.3 Time Scan Time scan work flow Power On Initialize Run software Create a new measurement Select Time Scan Set parameters Confirm parameters Start scan Input file name Confirm scan Finish scan Print out data 5.3.1 Create a new measurement Select “Files”->“Create Method”... - Page 33 S430 User Manual Measure Mode: Choose “Time Scan”. Operator: Input operator’s name. Serial Number: Shows the serial number of the instrument. Version Number: Shows the version of the instrument. Memo: Enter a description or notes on measuring conditions. Click to reset. Click to open saved parameters.
- Page 34 S430 User Manual Data mode: Data display as Abs.,or Trans. Wavelength: Input time scan wavelength. Unit: Set time unit to sec or ms. Time: Set the scan time. Interval: Fixed at 0.1 sec. Delay: Delay time before scan. Slit: Fixed at 8nm. Replicate: Set the number of repeat measurements .The instrument will only scan once when it’s 1.
- Page 35 S430 User Manual Available: Savitsky-Golaysmooth,Mean smooth, Median smooth and Derivative are available for data processing. Click a method in the “Available” box then click to put it in the Selected box. Click a method in the “Selected” box then click to remove it.
- Page 36 S430 User Manual Output: Print Report or Export to CSV file. Output options : Choose the printout data.Check the content in “Properties” button on the left after the scan. Add Data: When “Spectrum Data” is checked,you can choose data section to printout.Set the start wavelength, end wavelength and interval in the pop out window,then click OK.Click the “+”...
-
Page 37: Start A Time Scan
S430 User Manual 5.3.2 Start a Time Scan Create a new time scan measurement as 2.3.3.1. Put reference sample in the sample cell, then click to set 100%. Click to set 0%. Put sample in the sample cell, then click to start scan. - Page 38 S430 User Manual 11. Click to move sample cell. 12. Click to switch between Trans. and Abs. 13. Click to do spectrum comparison. 14. Click to do spectrum calculation. 15. Click to do spectrum derivation. 16. Click to do spectrum smoothing. 17.
-
Page 39: Quantitation
S430 User Manual 5.4 Quantitation Quantitation work flow Power On Initialize Run software Create a new measurement Select Quantitation Set parameters Confirm parameters Measure standard sample Input file name Create curve Measure sample Print out data Done... -
Page 40: Create A Measurement
S430 User Manual 5.4.1 Create a measurement Select “Files”->“Create Method” or click to enter Create Method Window. General Tab: Measure Mode: Choose “Time Scan”. Operator: Input operator’s name. Serial Number: Shows the serial number of the instrument. Version Number: Shows the version of the instrument. Memo: Enter a description or notes on measuring conditions. - Page 41 S430 User Manual Quantitation Tab: Method: Quantitation method. Only wavelength available now. WL Number: Number of wavelengths to analyse with. Unit: Concentration unit. Type: The type of fomula to display. Order: Linear, Quadratic and Cubic available. Custom Coef: Check the box to customize equation as “Conc A1 ∗...
-
Page 42: Biuld Calibration Curve
S430 User Manual Data mode: Choose Abs. or Trans. to display value. Wavelength: Input test wavelengths based on WL numbers in Quantitation tab. When WL number is 3, the number of 3 wavelengths need to be increasing or decreasing. Delay: Delay time before scan. Integral: Data integral time. - Page 43 S430 User Manual To change sample name, description and concentration: Click then double click in the table to modify the content you want. Then click to confirm. Measure a standard sample: Click to select a sample in the table, then click button.
-
Page 44: Measuring Unknown Samples
S430 User Manual 5.4.3 Measuring unknown samples When the regression curve is created, you can start measuring the sample. Operate the test sample in samples window as below. There are functions in the sample window: Measure, Modify, Delete and Clear. Change sample name &... -
Page 45: Data Processing
S430 User Manual delete and click button to delete the sample. Click confirm the modification and back to test sample window. Clear sample list: Click button, then click button. Click to confirm the modification and back to test sample window. 5.4.4 Data Processing Click to show detail of current measurement. -
Page 46: General Operation
S430 User Manual 5.5 General Operation 5.5.1 Wavelength When the instrument is not measuring (shows below), click to open wavelength dialog. Input the wavelength you want then click to go. Wavelength range: S430:1000nm~1800nm 5.5.2 Set 100% When the instrument is not measuring (shows below), click to set 100%. -
Page 47: Switch T/A
S430 User Manual 5.5.5 Switch T/A When the instrument is not measuring (shows below), click to switch T/A. Switch current value Switch spectrum data... -
Page 48: Locate File
S430 User Manual 5.5.6 Locate file To locate test files, you can input keyword in keyword blank. 5.5.7 Data management Click File-Data management to enter Data management. In data management you can quickly delete, export, hide in batch. Refresh: Select type, status and input keyword, then click to show the fitting files. -
Page 49: Characteristic Peak
S430 User Manual Batch Print: Select the files you need, then click to print one by one.It will print all data in the file. Change status: Switch between Display/Hide. Hidden files won’t be seen in the list outside Data management. Delete: Select the files you want to delete, then click to delete those files. -
Page 50: Spectrum Compare
S430 User Manual Spectrum 2 Spectrum1 Functions Results Files1 Type Type Files 2 Functions: Select arithmetic, calculate, save and export. Button Function Select addition, subtraction, multiplication or division Click calculate spectrums. Click to save a BMP file. Click to print. Spectrum 1 &... - Page 51 S43 3 0 User Man nual Interfa ce: Type ype: Choose e the spectru um type. les: Shows the certain n type of sp pectrums. H Hold Ctrl to select mult iple pectrums. Click O OK to compa are selected d spectrums.
-
Page 52: Find Peak
S430 User Manual 5.5.11 Find Peak This function is to quickly find peaks of spectrum. Click to set threshold according to current spectrum. Higher peaks need larger Y axis threshold; wider peaks need larger X axis threshold. Click to show peaks. The icon turns to . -
Page 53: Instrument Parameter
S430 User Manual 5.5.14 Instrument Parameter This is to change the save path, file name and spectrum type. Click “Settings” “Options” to open option window. General tab Default Method: Instrument use default parameters. New method: Instrument uses specified parameters. Save Tab: Automatic Increase after Scan: Automatically add a number suffix to file names. - Page 54 S430 User Manual Curve color: Sets curve color. Serie width: Sets curve width. Point color: Sets dot color. Point width: Sets dot width. Point height: Sets dot height. Point style: Sets dot shape as rectangle, circle, triangle, down triangle, cross, diagcross, star and diamond. Grid color: Sets the table color in “Spectrum information”...
-
Page 55: Rename & Delete Files
S430 User Manual When this item is checked, the reference data is corrected before each measurement in“wavelength scan”. 5.5.15 Rename & Delete Files Right click on a file in file browser. You can delete or rename in the pop-out menu. -
Page 56: Appendix
S430 User Manual 6 Appendix 6.1 Quantitative analysis wavelength method 6.1.1 Single Wavelength λ Abs. A is the value on the curve at λ 6.1.2 Double Wavelengths λ λ λ λ are the Fluorescence at... -
Page 57: Triple Wavelengths
S430 User Manual 6.1.3 Triple Wavelengths λ λ λ λ λ λ are the Fluorescence at – It has to beλ >λ >λ or λ <λ <λ 6.2 DETAILS ON QUANTITATIVE Prolab provides 3 calibration types: Linear working curve, Quadratic working curve and Cubic working curve. -
Page 58: Quadratic Working Curve (2Nd Order)
S430 User Manual ∑ ∑ ∙ ∑ ∑ ∑ ∑ ∑ 6.2.2 Quadratic Working Curve (2nd order) The calculation formula is as follow: Where, Concentration of standard sample : Abs. of each sample (measured value) are calculated by the least squares method ,C Suppose there are n data points( ),then:... -
Page 59: Derivative Operation On Spectrum
S430 User Manual 6.3 Derivative Operation on Spectrum The derivative of a function of a real variable measures the sensitivity to change of a quantity (a function or dependent variable) which is determined by another quantity (the independent variable). Derivative of the function There are many ways of derivative operation on spectrum. -
Page 60: Smoothing
S430 User Manual In Fig.1,there is a clear alternation of peaks. In Fig.2, the acromion is higher after derivative. Second order derivative spectrum is clearer. In Fig.3, the original spectrum two curves are seriously overlapping, but in n=2/4 the peaks are clearer. Higher order derivative can eliminate the low order background curves. - Page 61 BIOBASE GROUP 2# building, No.9 Gangxing Road, High-tech Zone, Jinan City, Shandong Province, China Tel: +86-531-81219803/01 Fax: +86-531-81219804 Inquiry: export@biobase.com Complaints: customer_support@biobase.cc After-sales service: service_sd@biobase.cc; service_ivd@biobase.cc Web: www.biobase.cc/www.meihuatrade.com / www.biobase.com...
Need help?
Do you have a question about the BK-S430 NIR and is the answer not in the manual?
Questions and answers